Waterfall Chart
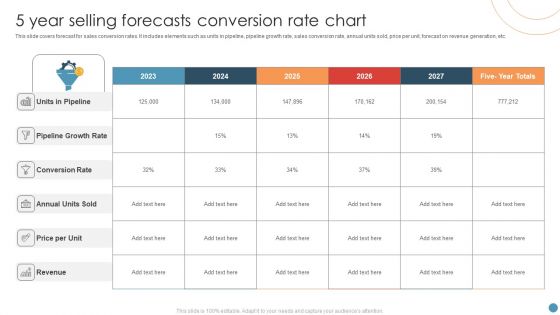
5 Year Selling Forecasts Conversion Rate Chart Microsoft PDF
This slide covers forecast for sales conversion rates. It includes elements such as units in pipeline, pipeline growth rate, sales conversion rate, annual units sold, price per unit, forecast on revenue generation, etc. Pitch your topic with ease and precision using this 5 Year Selling Forecasts Conversion Rate Chart Microsoft PDF. This layout presents information on Conversion Rate, Price Per Unit, Growth Rate. It is also available for immediate download and adjustment. So, changes can be made in the color, design, graphics or any other component to create a unique layout.
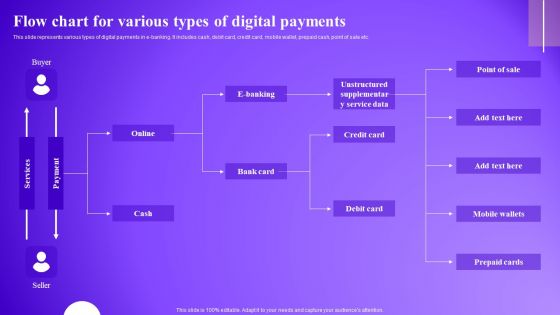
Flow Chart For Various Types Of Digital Payments Guidelines PDF
This slide represents various types of digital payments in e banking. It includes cash, debit card, credit card, mobile wallet, prepaid cash, point of sale etc. Want to ace your presentation in front of a live audience Our Flow Chart For Various Types Of Digital Payments Guidelines PDF can help you do that by engaging all the users towards you. Slidegeeks experts have put their efforts and expertise into creating these impeccable powerpoint presentations so that you can communicate your ideas clearly. Moreover, all the templates are customizable, and easy to edit and downloadable. Use these for both personal and commercial use.
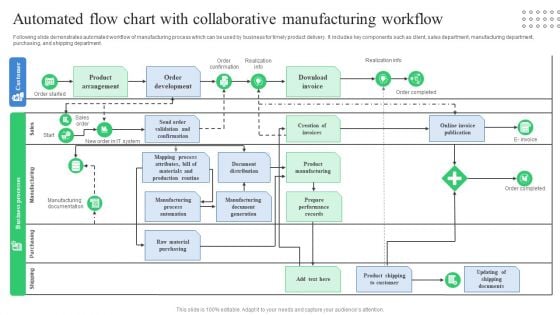
Automated Flow Chart With Collaborative Manufacturing Workflow Infographics PDF
Following slide demonstrates automated workflow of manufacturing process which can be used by business for timely product delivery. It includes key components such as client, sales department, manufacturing department, purchasing, and shipping department. Showcasing this set of slides titled Automated Flow Chart With Collaborative Manufacturing Workflow Infographics PDF. The topics addressed in these templates are Product Arrangement, Order Development, Download Invoice. All the content presented in this PPT design is completely editable. Download it and make adjustments in color, background, font etc. as per your unique business setting.
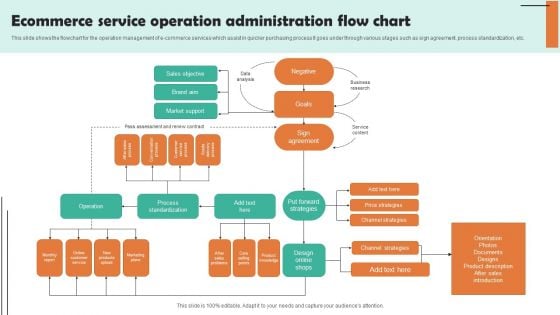
Ecommerce Service Operation Administration Flow Chart Template PDF
This slide shows the flowchart for the operation management of e-commerce services which assist in quicker purchasing process It goes under through various stages such as sign agreement, process standardization, etc. Showcasing this set of slides titled Ecommerce Service Operation Administration Flow Chart Template PDF. The topics addressed in these templates are Sales Objective, Brand Aim, Market Support. All the content presented in this PPT design is completely editable. Download it and make adjustments in color, background, font etc. as per your unique business setting.
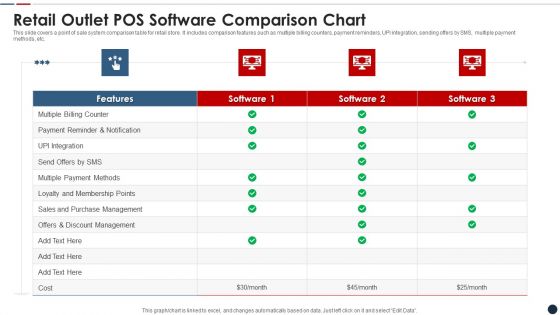
Retail Outlet POS Software Comparison Chart Formats PDF
This slide covers a point of sale system comparison table for retail store. It includes comparison features such as multiple billing counters, payment reminders, UPI integration, sending offers by SMS, multiple payment methods, etc. Showcasing this set of slides titled retail outlet pos software comparison chart formats pdf The topics addressed in these templates are Multiple billing counter, multiple payment methods, discount management All the content presented in this PPT design is completely editable. Download it and make adjustments in color, background, font etc. as per your unique business setting.
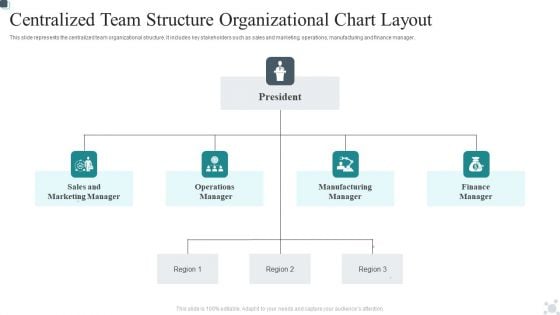
Centralized Team Structure Organizational Chart Layout Download PDF
This slide represents the centralized team organizational structure. It includes key stakeholders such as sales and marketing, operations, manufacturing and finance manager.Persuade your audience using this Centralized Team Structure Organizational Chart Layout Download PDF. This PPT design covers four stages, thus making it a great tool to use. It also caters to a variety of topics including Operations Manager, Manufacturing Manager, Finance Manager. Download this PPT design now to present a convincing pitch that not only emphasizes the topic but also showcases your presentation skills.
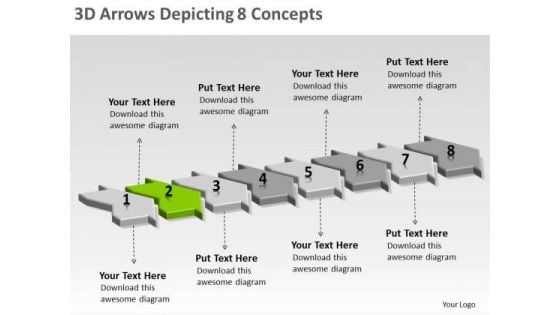
3d Arrows Depicting 8 Concepts Flow Chart Generator PowerPoint Templates
We present our 3d arrows depicting 8 concepts flow chart generator PowerPoint templates. Use our Marketing PowerPoint Templates because, It has inspired a whole new world of medical endeavor. Use our Business PowerPoint Templates because, Marketing Strategy Business Template:- Maximizing sales of your product is the intended destination. Use our Shapes PowerPoint Templates because, Profit fairly earned is what you believe in. Use our Process and Flows PowerPoint Templates because; Use them to your advantage to priorities your ideas. Use our Arrows PowerPoint Templates because, Hence this diagram has the unique ability to drive home your ideas and show how they mesh to guarantee success. Use these PowerPoint slides for presentations relating to Advertising, arrow, background, banner, bookmark, choice, concept, creative, design, direction, flow, illustration, instruction, label, layout, manual, marketing, modern, next, offer, options, order, pointer, process, product, promotion, sequence, simple, special, symbol, template, tutorial, two, vector, version, website. The prominent colors used in the PowerPoint template are Gray, White, and Green Equalize the equation with our 3d Arrows Depicting 8 Concepts Flow Chart Generator PowerPoint Templates. Get the audience on board with you.
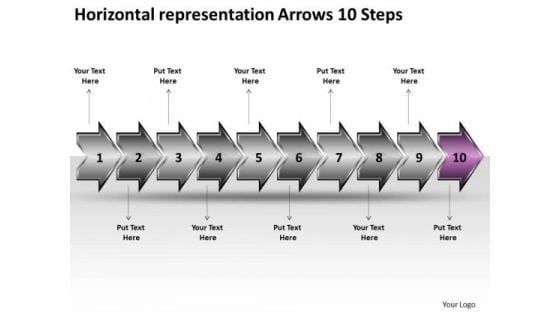
Horizontal Representation Arrows 10 Steps Documentation Flow Chart PowerPoint Templates
We present our horizontal representation arrows 10 steps documentation flow chart PowerPoint templates. Use our Design PowerPoint Templates because; represent the progress in our lives. Use our Arrows PowerPoint Templates because; now funnel your marketing strategies down the cone, stage by stage, refining as you go along. Use our Process and Flows PowerPoint Templates because, But you have an idea of which you are sure. Use our Shapes PowerPoint Templates because; amplify on this basic corporate concept and forefront the benefits of overlapping processes to arrive at common goals. Use our Business PowerPoint Templates because, Marketing Strategy Business Template:- Maximizing sales of your product is the intended destination. Use these PowerPoint slides for presentations relating to 3d ,abstract, around, arrows, business, center, circle, circular, concept, connections, curve, cycle, directions, distribution, illustration, management, middle, objects, plan, process, recycle, rounded, shadows, space, system. The prominent colors used in the PowerPoint template are Purple, White, and Gray Display your enterprise with our Horizontal Representation Arrows 10 Steps Documentation Flow Chart PowerPoint Templates. Go boldly forth with your plans.
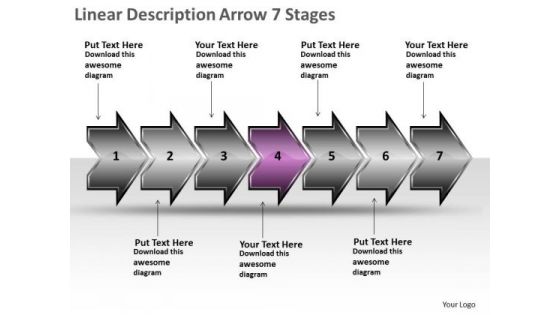
Linear Description Arrow 7 Stages Function Flow Chart PowerPoint Templates
We present our linear description arrow 7 stages function flow chart PowerPoint templates. Use our Finance PowerPoint Templates because, Our PowerPoint templates designed for your ideas to sell. Use our Arrows PowerPoint Templates because; Reaffirm to your team your faith in maintaining the highest ethical standards. Use our Business PowerPoint Templates because, Marketing Strategy Business Template: - Maximizing sales of your product is the intended destination. Use our Shapes PowerPoint Templates because; Trigger their minds with your interesting ideas. Use our Process and Flows PowerPoint Templates because, you have the people in place, selected the team leaders and all are raring to go. Use these PowerPoint slides for presentations relating to 3d, abstract, around, arrows, business, center, circle, circular, concept, connections, curve, cycle, directions, distribution, illustration, management, middle, objects, plan, process, recycle, rounded, shadows, space, system. The prominent colors used in the PowerPoint template are Purple, White, and Gray Taste success with our Linear Description Arrow 7 Stages Function Flow Chart PowerPoint Templates. You will come out on top.
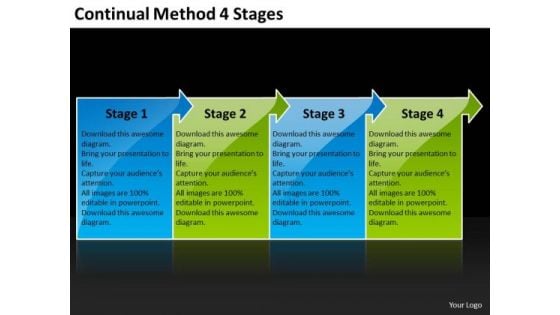
Continual Method 4 Stages Oil Flow Chart PowerPoint Slides
We present our continual method 4 stages oil flow chart PowerPoint Slides. Use our Arrows PowerPoint Templates because, the vision of being the market leader is clear to you. Use our Symbol PowerPoint Templates because, your quicksilver ideas are the arrows in your quiver. Use our Business PowerPoint Templates because, Marketing Strategy Business Template: - Maximizing sales of your product is the intended destination. Use our Metaphor PowerPoint Templates because, you have the people in place, selected the team leaders and all are raring to go. Use our Process and Flows PowerPoint Templates because, Aesthetically designed to make a great first impression this template highlights .Use these PowerPoint slides for presentations relating to Arrow, Background, Banner, Blue, Bookmark, Card, Choice, Concept, Corporate, Creative, Design, Direction, Flow, Green, Illustration, Info graphic, Instruction, Label, Layout, Manual, Modern, Number, Offer, One, Options, Order, Page, Paper, Pointer, Product, Progress, Promotion, Red, Retro, Sequence, Simple, Special, Step, Symbol, Tab, Tag, Template, Three, Tutorial, Two, Vector, Version. The prominent colors used in the PowerPoint template are Green, Blue, and Black Do a commendable job with our Continual Method 4 Stages Oil Flow Chart PowerPoint Slides. Your audience will keep clapping for you.
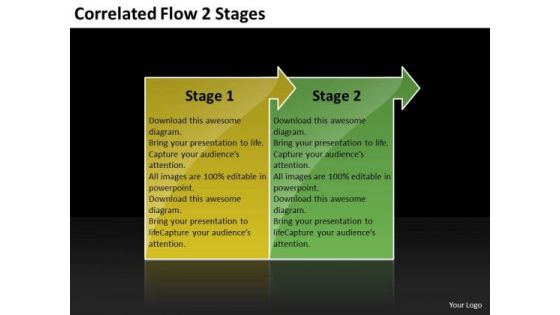
Correlated Flow 2 Stages Oil Chart PowerPoint Slides
We present our correlated flow 2 stages oil chart PowerPoint Slides. Use our Arrows PowerPoint Templates because, Weak Links & Chains:- Chain reactions and the element of teamwork add value to your efforts. Use our Symbol PowerPoint Templates because, However there is a key aspect to be emphasized. Use our Business PowerPoint Templates because, Marketing Strategy Business Template:- Maximizing sales of your product is the intended destination. Use our Metaphor PowerPoint Templates because, are truly some of the wonders of our life. Use our Process and Flows PowerPoint Templates because, you have understood the essence of this chain reaction like sequence of events. Use these PowerPoint slides for presentations relating to Arrow, Background, Banner, Blue, Bookmark, Card, Choice, Concept, Corporate, Creative, Design, Direction, Flow, Green, Illustration, Info graphic, Instruction, Label, Layout, Manual, Modern, Number, Offer, One, Options, Order, Page, Paper, Pointer, Product, Progress, Promotion, Red, Retro, Sequence, Simple, Special, Step, Symbol, Tab, Tag, Template, Three, Tutorial, Two, Vector, Version. The prominent colors used in the PowerPoint template are Green, Yellow, and Black Our Correlated Flow 2 Stages Oil Chart PowerPoint Slides capture the attention of your audience. With our money back guarantee you have nothing to lose.
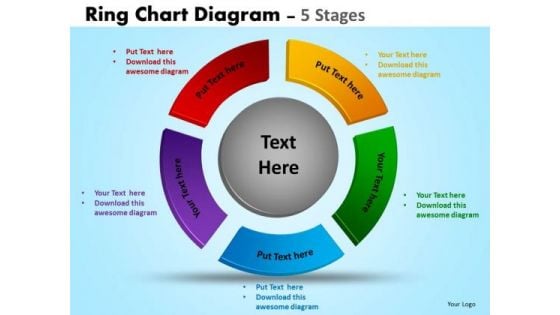
Business Diagram Ring Chart Diagram 5 Stages Sales Diagram
Doll Up Your Thoughts With Our Business_Diagram_Ring_Chart_Diagram_5_Stages_Sales_Diagram Powerpoint Templates. They Will Make A Pretty Picture.
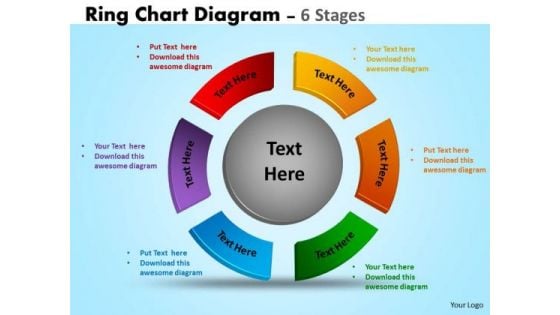
Business Cycle Diagram Ring Chart Diagram 6 Stages Sales Diagram
Get Out Of The Dock With Our Business_Cycle_Diagram_Ring_Chart_Diagram_6_Stages_Sales_Diagram Powerpoint Templates. Your Mind Will Be Set Free.
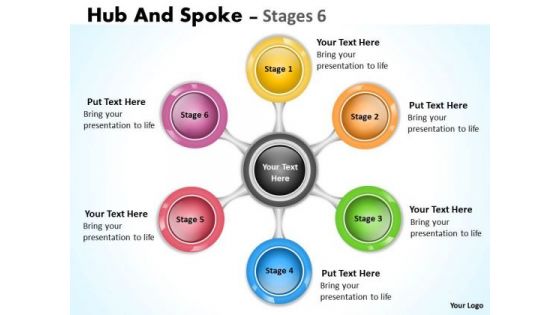
Consulting Diagram Diverging Flow Chart Business 6 Sales Diagram
Our Consulting_Diagram_Diverging_Flow_Chart_Business_6_Sales_Diagram Powerpoint Templates Team Are A Dogged Lot. They Keep At It Till They Get It Right.
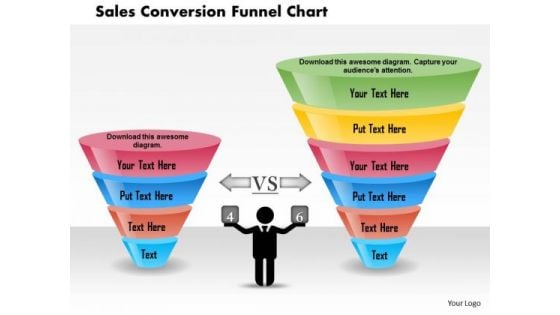
Business Diagram Sales Conversion Funnel Chart Presentation Template
This power point template slide has been crafted with graphic of funnel chart. This PPT diagram contains the concept of sales conversion. Use this PPT diagram for business and sales related presentations.
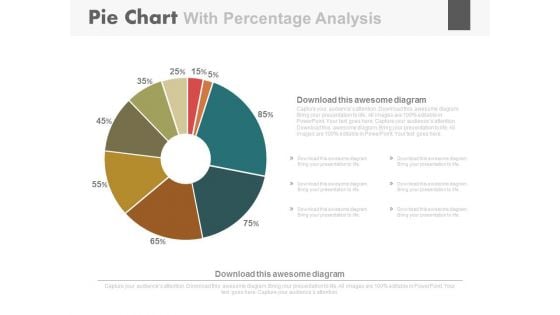
Pie Chart For Strategic Sales Plan Powerpoint Slides
This PowerPoint template has been designed with diagram of pie chart. This PPT slide can be used to prepare presentations on strategic sales plan. You can download finance PowerPoint template to prepare awesome presentations.
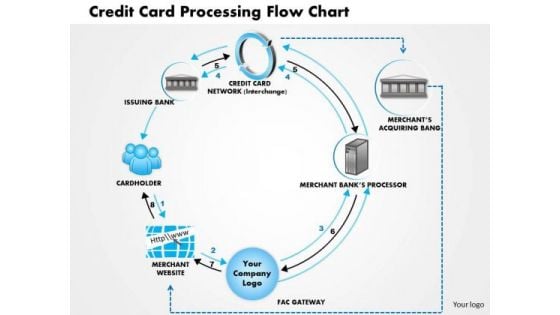
Business Framework Credit Card Processing Flow Chart PowerPoint Presentation
This innovative image slide has been designed to depict credit card processing flow chart. This business framework template may be used in banking presentations to express view on process of money transaction through credit card. This image slide will enhance the quality of your presentations.
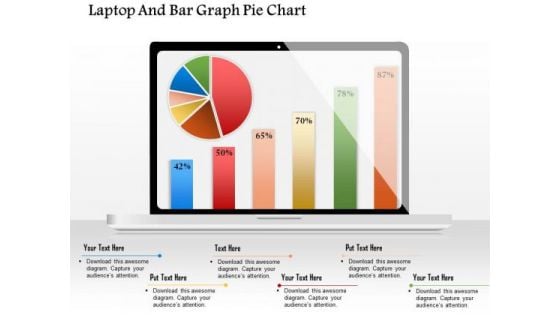
Business Diagram Laptop And Bar Graph Pie Chart Presentation Template
This Power Point template has been designed with graphic of target dart. This PPT diagram contains the concept of information communication. Use this PPT in your business communication related presentations.
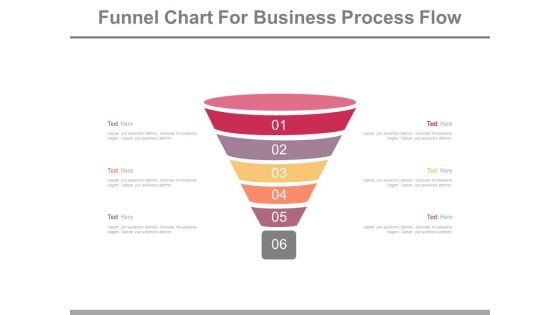
Six Steps Funnel Chart For Business Powerpoint Slides
This PowerPoint template has been designed with professional graphics of funnel chart. This PPT slide can be used to display steps of sales process. You can download finance PowerPoint template to prepare awesome presentations.

Funnel Chart For Joint Venture Marketing Powerpoint Slides
This PowerPoint template has been designed with graphics of funnel chart. This PPT slide can be used to display joint venture marketing. You can download finance PowerPoint template to prepare awesome presentations.
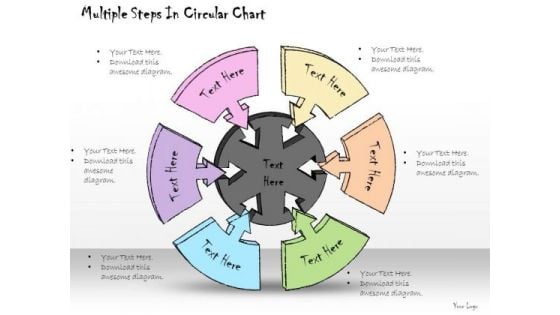
Ppt Slide Multiple Steps In Circular Chart Consulting Firms
Draw It Out On Our PPT Slide one orange in apples consulting firms Powerpoint Templates. Provide Inspiration To Your Colleagues. Motivate The Disheartened With Our Business Plan Powerpoint Templates. Inspire Them With The Goodness In You.
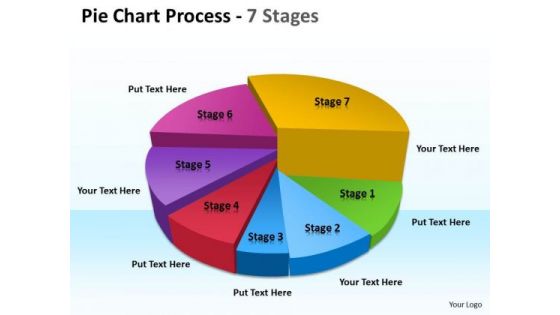
Sales Diagram Pie Chart Mba Models And Frameworks
Get The Domestics Right With Our MBA Models And Frameworks Step By Step Growth Consulting Diagram Powerpoint Templates. Create The Base For Thoughts To Grow.
Comparison Map Chart With Social Media Icons Powerpoint Slides
This PowerPoint template has been designed with map diagram and social media icons. Each and every property of any region - color, size, shading etc can be modified to help you build an effective PowerPoint presentation. You may use this map slide to display sales territories, business and new office locations, travel planning etc in your presentations.
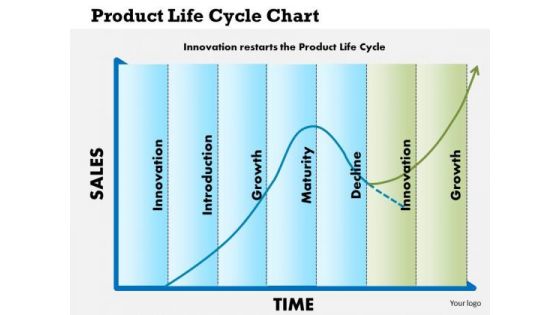
Business Framework Product Life Cycle Chart PowerPoint Presentation
his image slide has been designed to displays product life cycle diagram template. This image slide has been designed with graph of sales and time with product lifecycle with double innovation. This image slide may be used in your presentations to depict lifecycle for a product in market. Create interesting presentations using this image slide.
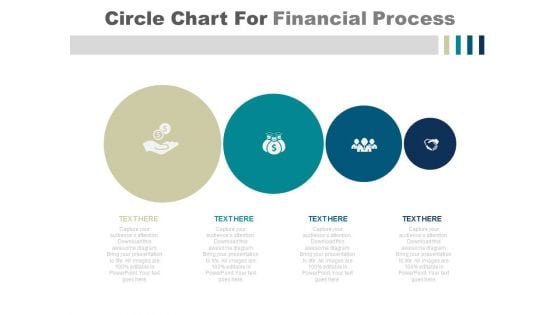
Circle Chart For Financial Planning Process PowerPoint Slides
This PowerPoint template has been created by professionals keeping in mind the need of light slides with more information. The slide uses minimalistic yet impactful visuals to explain a 4 step process. The reducing size of the circles can be creatively used to show that the process or the steps are getting an organization or a business firm closer to its targets or goals. There is ample space available to write text describe the steps involved in the process. This can be an ideal presentation for a company to show its financial plan or sales strategy to its investors or clients to gain their confidence. The icons and colors of the slide are customizable and can be edited to match the theme of the slide or the topic of the presentation.
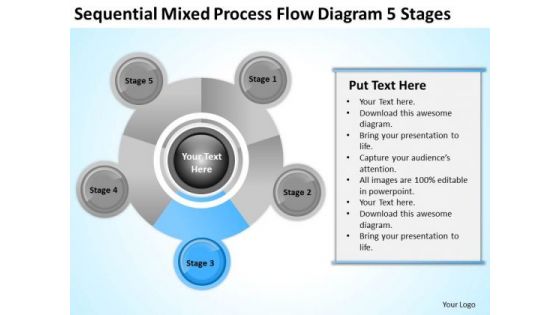
Business Organizational Chart Examples Mixed Process Flow Diagram 5 Stages PowerPoint Slide
We present our business organizational chart examples mixed process flow diagram 5 stages PowerPoint Slide.Download our Construction PowerPoint Templates because You can Hit the nail on the head with our PowerPoint Templates and Slides. Embed your ideas in the minds of your audience. Use our Advertising PowerPoint Templates because Our PowerPoint Templates and Slides are conceived by a dedicated team. Use them and give form to your wondrous ideas. Use our Circle Charts PowerPoint Templates because You can Be the puppeteer with our PowerPoint Templates and Slides as your strings. Lead your team through the steps of your script. Use our Business PowerPoint Templates because You can Channelise the thoughts of your team with our PowerPoint Templates and Slides. Urge them to focus on the goals you have set. Download our Shapes PowerPoint Templates because Our PowerPoint Templates and Slides have the Brilliant backdrops. Guaranteed to illuminate the minds of your audience.Use these PowerPoint slides for presentations relating to Development, diagram, life, test, process, chart, concept, vector, stage, project, business, workflow, team, design, phase, product, model, schema, corporate, implementation, tag, plan, engineering, success, symbol, stack, circle, graphic, data, shape, management, cycle, steps, illustration, system, strategy, waterfall, colors, objects, lifecycle, professional, quality, organization, implement, background, image, detail, software, structure, ideas. The prominent colors used in the PowerPoint template are Blue, Gray, Black. Our Business Organizational Chart Examples Mixed Process Flow Diagram 5 Stages PowerPoint Slide are really enterprising. They dig out ways to convey your ideas.
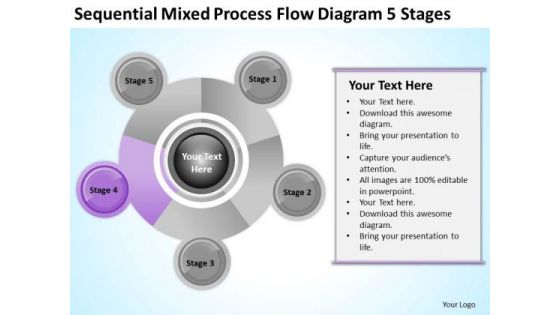
Business Organizational Chart Examples Mixed Process Flow Diagram 5 Stages Ppt PowerPoint Slide
We present our business organizational chart examples mixed process flow diagram 5 stages ppt PowerPoint Slide.Present our Construction PowerPoint Templates because Our PowerPoint Templates and Slides will definately Enhance the stature of your presentation. Adorn the beauty of your thoughts with their colourful backgrounds. Use our Advertising PowerPoint Templates because Your ideas provide food for thought. Our PowerPoint Templates and Slides will help you create a dish to tickle the most discerning palate. Download and present our Circle Charts PowerPoint Templates because Our PowerPoint Templates and Slides will let you meet your Deadlines. Download and present our Business PowerPoint Templates because It can be used to Set your controls for the heart of the sun. Our PowerPoint Templates and Slides will be the propellant to get you there. Present our Shapes PowerPoint Templates because You should Throw the gauntlet with our PowerPoint Templates and Slides. They are created to take up any challenge.Use these PowerPoint slides for presentations relating to Development, diagram, life, test, process, chart, concept, vector, stage, project, business, workflow, team, design, phase, product, model, schema, corporate, implementation, tag, plan, engineering, success, symbol, stack, circle, graphic, data, shape, management, cycle, steps, illustration, system, strategy, waterfall, colors, objects, lifecycle, professional, quality, organization, implement, background, image, detail, software, structure, ideas. The prominent colors used in the PowerPoint template are Purple, Gray, Black. Our Business Organizational Chart Examples Mixed Process Flow Diagram 5 Stages Ppt PowerPoint Slide make a great bait. Your ideas will hook them all.
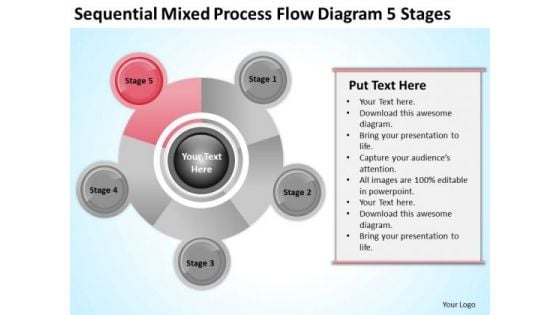
Business Organizational Chart Examples Mixed Process Flow Diagram 5 Stages Ppt PowerPoint Slides
We present our business organizational chart examples mixed process flow diagram 5 stages ppt PowerPoint Slides.Download and present our Construction PowerPoint Templates because Our PowerPoint Templates and Slides are created with admirable insight. Use them and give your group a sense of your logical mind. Download our Advertising PowerPoint Templates because These PowerPoint Templates and Slides will give the updraft to your ideas. See them soar to great heights with ease. Download and present our Circle Charts PowerPoint Templates because They will bring a lot to the table. Their alluring flavours will make your audience salivate. Use our Business PowerPoint Templates because Our PowerPoint Templates and Slides will effectively help you save your valuable time. They are readymade to fit into any presentation structure. Download and present our Shapes PowerPoint Templates because Our PowerPoint Templates and Slides will let you Hit the right notes. Watch your audience start singing to your tune.Use these PowerPoint slides for presentations relating to Development, diagram, life, test, process, chart, concept, vector, stage, project, business, workflow, team, design, phase, product, model, schema, corporate, implementation, tag, plan, engineering, success, symbol, stack, circle, graphic, data, shape, management, cycle, steps, illustration, system, strategy, waterfall, colors, objects, lifecycle, professional, quality, organization, implement, background, image, detail, software, structure, ideas. The prominent colors used in the PowerPoint template are Red, Gray, Black. Let your ideas explode on the scene. Trigger the fuse with our Business Organizational Chart Examples Mixed Process Flow Diagram 5 Stages Ppt PowerPoint Slides.

Sales Monthly Trends Analysis Chart Ppt Powerpoint Presentation Gallery Objects Pdf
Pitch your topic with ease and precision using this sales monthly trends analysis chart ppt powerpoint presentation gallery objects pdf. This layout presents information on sales monthly trends analysis chart. It is also available for immediate download and adjustment. So, changes can be made in the color, design, graphics or any other component to create a unique layout.

Goal Pie Chart Concept Business PowerPoint Templates And PowerPoint Themes 0712
Goal Pie Chart Concept Business PowerPoint Templates And PowerPoint Themes 0712-Microsoft Powerpoint Templates and Background with pie chart concept Lecture teams with our Goal Pie Chart Concept Business PowerPoint Templates And PowerPoint Themes 0712. Download without worries with our money back guaranteee.
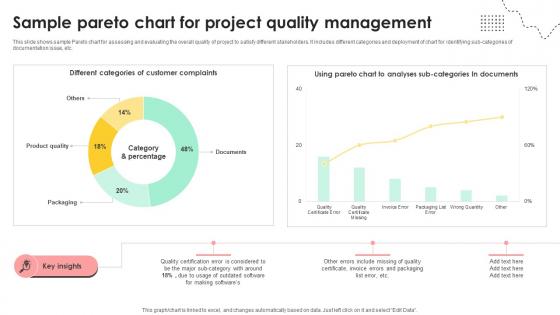
Administering Quality Assurance Sample Pareto Chart For Project Quality Management PM SS V
This slide shows sample Pareto chart for assessing and evaluating the overall quality of project to satisfy different stakeholders. It includes different categories and deployment of chart for identifying sub-categories of documentation issue, etc. Slidegeeks is here to make your presentations a breeze with Administering Quality Assurance Sample Pareto Chart For Project Quality Management PM SS V With our easy-to-use and customizable templates, you can focus on delivering your ideas rather than worrying about formatting. With a variety of designs to choose from, you are sure to find one that suits your needs. And with animations and unique photos, illustrations, and fonts, you can make your presentation pop. So whether you are giving a sales pitch or presenting to the board, make sure to check out Slidegeeks first This slide shows sample Pareto chart for assessing and evaluating the overall quality of project to satisfy different stakeholders. It includes different categories and deployment of chart for identifying sub-categories of documentation issue, etc.
Bar Chart Showing Quarterly Business Sales Ppt PowerPoint Presentation Model Icon
Presenting this set of slides with name bar chart showing quarterly business sales ppt powerpoint presentation model icon. The topics discussed in these slides are revenue trend, bar chart, financial. This is a completely editable PowerPoint presentation and is available for immediate download. Download now and impress your audience.
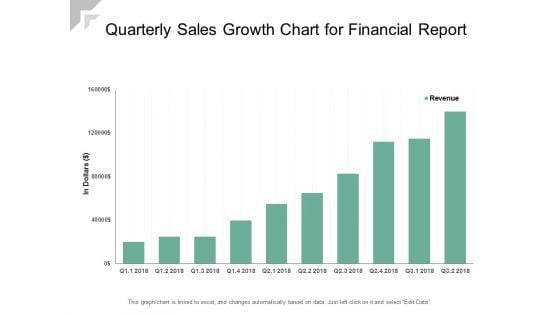
Quarterly Sales Growth Chart For Financial Report Ppt PowerPoint Presentation Ideas Infographics
Presenting this set of slides with name quarterly sales growth chart for financial report ppt powerpoint presentation ideas infographics. The topics discussed in these slides are revenue trend, bar chart, financial. This is a completely editable PowerPoint presentation and is available for immediate download. Download now and impress your audience.
Bar Graph And Pie Chart Marketing PowerPoint Templates And PowerPoint Themes 0612
Bar Graph And Pie Chart Marketing PowerPoint Templates And PowerPoint Themes 0612-Microsoft Powerpoint Templates and Background with bar and pie chart Our Bar Graph And Pie Chart Marketing PowerPoint Templates And PowerPoint Themes 0612 have a festive effect. The audience will celebrate your ideas.
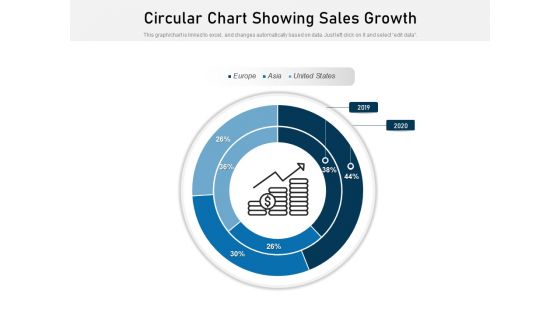
Circular Chart Showing Sales Growth Ppt PowerPoint Presentation File Images PDF
Presenting this set of slides with name circular chart showing sales growth ppt powerpoint presentation file images pdf. The topics discussed in these slides are circular chart showing sales growth, 2019 to 2020. This is a completely editable PowerPoint presentation and is available for immediate download. Download now and impress your audience.
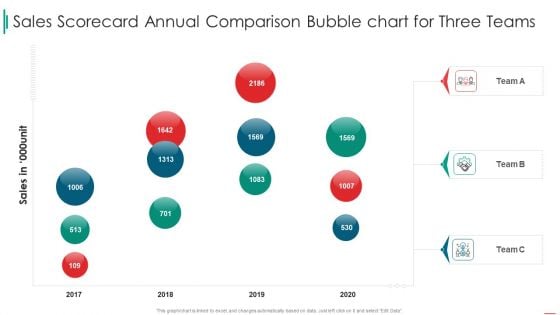
Sales Rep Scorecard Sales Scorecard Annual Comparison Bubble Chart For Three Teams Designs PDF
Deliver and pitch your topic in the best possible manner with this sales rep scorecard sales scorecard annual comparison bubble chart for three teams designs pdf. Use them to share invaluable insights on sales scorecard annual comparison bubble chart for three teams and impress your audience. This template can be altered and modified as per your expectations. So, grab it now.
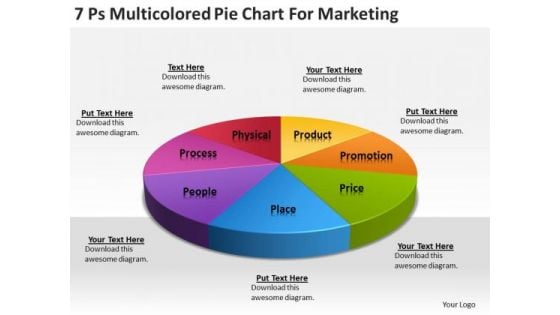
Strategy PowerPoint Template 7 Ps Multicolored Pie Chart For Marketing Ppt Slides
Lower the drawbridge with our strategy powerpoint template 7 ps multicolored pie chart for marketing ppt Slides. Capture the minds of your audience. Cajole them with our Marketing PowerPoint Templates. Your audience will be drawn to your ideas. Draw up your agenda on our Circle Charts PowerPoint Templates. Coax your audience into acceptance. Consultour Strategy PowerPoint Template 7 Ps Multicolored Pie Chart For Marketing Ppt Slides for any advice. Get answers that are ethical and actionable.
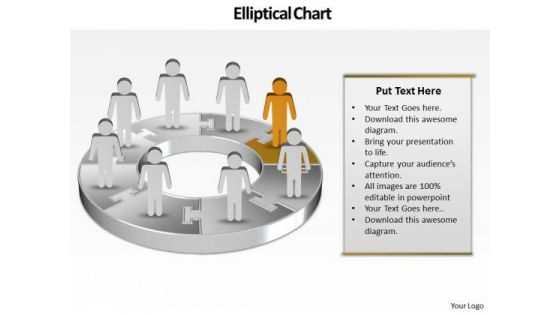
Ppt Team Work Person Presentation Standing Orange Piece Of Chart PowerPoint Templates
PPT team work person presentation standing orange piece of chart PowerPoint Templates-Use this graphical approach to represent global business issues such as financial data, stock market Exchange, increase in sales, corporate presentations and more. Create captivating presentations to deliver comparative and weighted arguments.-PPT team work person presentation standing orange piece of chart PowerPoint Templates-arrow, bar, business, businessman, candidate, cartoon, character, chart, circle, circular, client, communication, company, concept, diagram, finance, financial, flow, growth, human, illustration, increase, information, iteration, man, market, marketing, process, processing, profit, sales, statistics, stats, success, target Bounce back with our Ppt Team Work Person Presentation Standing Orange Piece Of Chart PowerPoint Templates. You will come out on top.
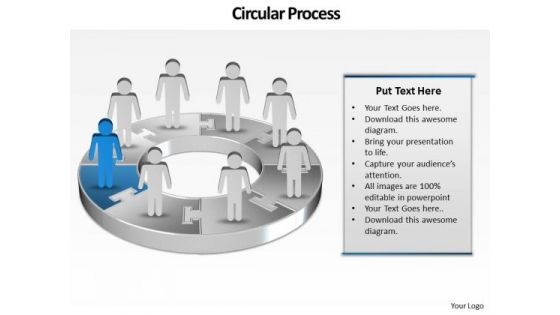
Ppt Group Of People Pie Chart Person Presentation Standing Blue Piece PowerPoint Templates
PPT group of people pie chart person presentation standing blue piece PowerPoint Templates-This PowerPoint Diagram shows the Round Description of steps which are involved in development Process. It includes Eight Steps. You can change color, size and orientation of any icon to your liking.-PPT group of people pie chart person presentation standing blue piece PowerPoint Templates-arrow, bar, business, businessman, candidate, cartoon, character, chart, circle, circular, client, communication, company, concept, diagram, finance, growth, human, illustration, increase, information, marketing, person, presentation, process, profit, sales, stats, success, target Expound your logic on our Ppt Group Of People Pie Chart Person Presentation Standing Blue Piece PowerPoint Templates. Let them in on your chain of thought.
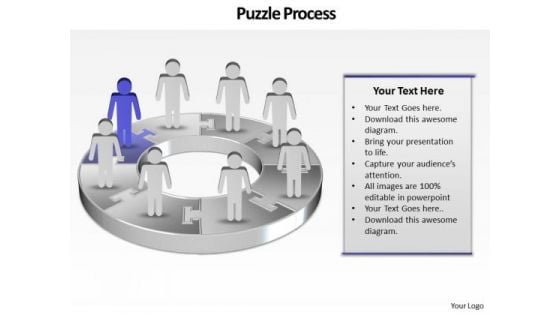
Ppt Group Of People Pie Chart Person Standing Purple Piece PowerPoint Templates
PPT group of people pie chart person standing purple piece PowerPoint Templates-This continual illustration of procedure graphic is a visual representation of your information and ideas. Use this diagram as a method of graphically representing the flow of data as an information processing system.-PPT group of people pie chart person standing purple piece PowerPoint Templates-arrow, bar, business, businessman, candidate, cartoon, character, chart, circle, circular, client, communication, company, concept, diagram, finance, growth, human, illustration, increase, information, marketing, person, presentation, process, profit, sales, stats, success, target Establish your command over the subject. Display your awareness with our Ppt Group Of People Pie Chart Person Standing Purple Piece PowerPoint Templates.
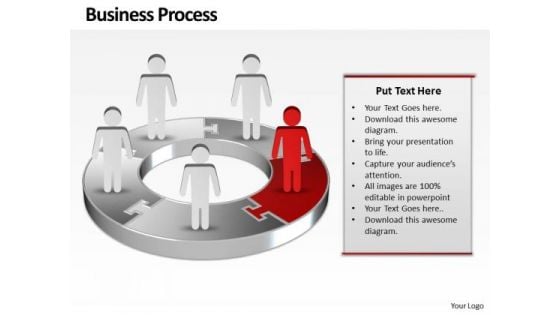
Ppt Red Men Standing On Business PowerPoint Theme Pie Chart Templates
PPT red men standing on business powerpoint theme pie chart Templates-Use this graphical approach to represent global business issues such as financial data, stock market Exchange, increase in sales, corporate presentations and more.-PPT red men standing on business powerpoint theme pie chart Templates-3d, arrow, background, blue, chart, circle, circular, clipart, colorful, connection, continuity, cycle, cyclic, diagram, direction, flow, graph, icon, illustration, isolated, loop, motion, process, progress, recycle, ring, round, step, sticker, symbol, teamwork, template, turn, vector Make a beautiful presentation with our Ppt Red Men Standing On Business PowerPoint Theme Pie Chart Templates. Just download, type and present.

Bar Graph And Pie Chart Finance PowerPoint Templates And PowerPoint Themes 0612
Bar Graph And Pie Chart Finance PowerPoint Templates And PowerPoint Themes Business-Microsoft Powerpoint Templates and Background with bar and pie graph Arouse a committee with our Bar Graph And Pie Chart Finance PowerPoint Templates And PowerPoint Themes 0612. Just download, type and present.
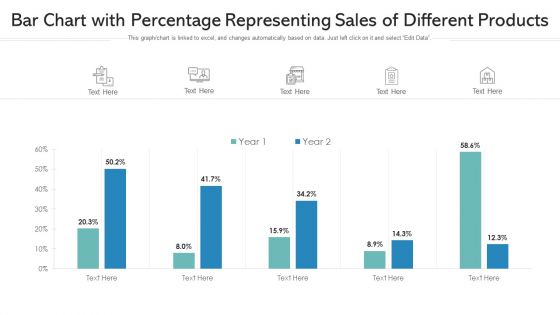
Bar Chart With Percentage Representing Sales Of Different Products Ppt PowerPoint Presentation Gallery Diagrams PDF
Showcasing this set of slides titled bar chart with percentage representing sales of different products ppt powerpoint presentation gallery diagrams pdf. The topics addressed in these templates are bar chart with percentage representing sales of different products. All the content presented in this PPT design is completely editable. Download it and make adjustments in color, background, font etc. as per your unique business setting.
Product Distribution Sales And Marketing Channels Bar Chart Ppt Infographics Icon PDF
Presenting this set of slides with name product distribution sales and marketing channels bar chart ppt infographics icon pdf. The topics discussed in these slide is bar chart. This is a completely editable PowerPoint presentation and is available for immediate download. Download now and impress your audience.
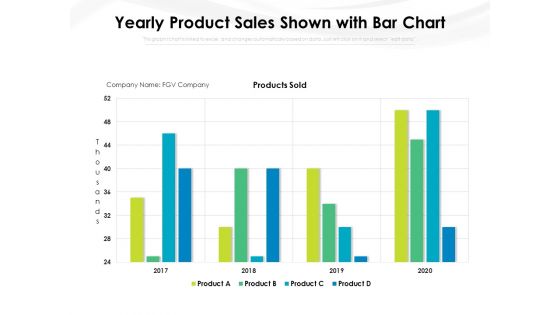
Yearly Product Sales Shown With Bar Chart Ppt PowerPoint Presentation File Gridlines PDF
Pitch your topic with ease and precision using this yearly product sales shown with bar chart ppt powerpoint presentation file gridlines pdf. This layout presents information on yearly product sales shown with bar chart. It is also available for immediate download and adjustment. So, changes can be made in the color, design, graphics or any other component to create a unique layout.
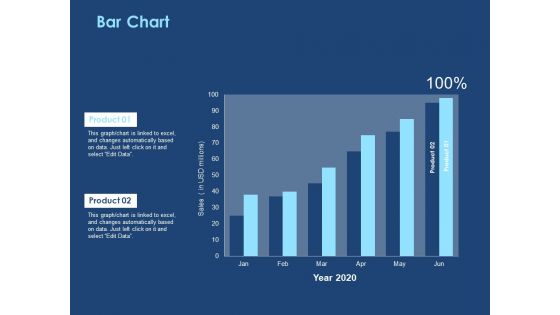
Creating The Best Sales Strategy For Your Business Bar Chart Ppt Slides Summary PDF
Presenting this set of slides with name creating the best sales strategy for your business bar chart ppt slides summary pdf. The topics discussed in these slide is bar chart. This is a completely editable PowerPoint presentation and is available for immediate download. Download now and impress your audience.
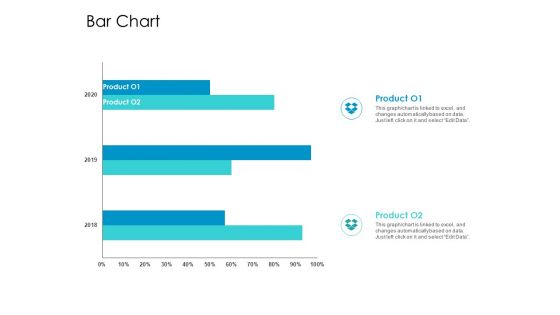
Developing New Sales And Marketing Strategic Approach Bar Chart Ppt PowerPoint Presentation Show Samples PDF
Presenting this set of slides with name developing new sales and marketing strategic approach bar chart ppt powerpoint presentation show samples pdf. The topics discussed in these slide is bar chart. This is a completely editable PowerPoint presentation and is available for immediate download. Download now and impress your audience.
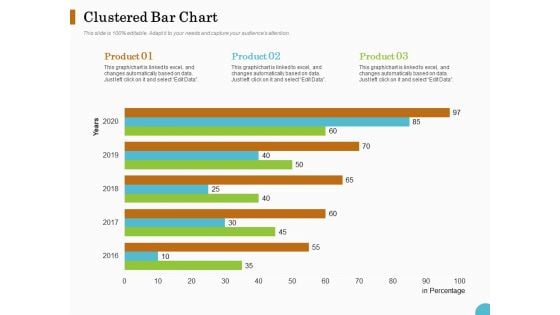
Lead Ranking Sales Methodology Model Clustered Bar Chart Ppt PowerPoint Presentation Styles Introduction PDF
Presenting this set of slides with name lead ranking sales methodology model clustered bar chart ppt powerpoint presentation styles introduction pdf. The topics discussed in these slide is clustered bar chart. This is a completely editable PowerPoint presentation and is available for immediate download. Download now and impress your audience.
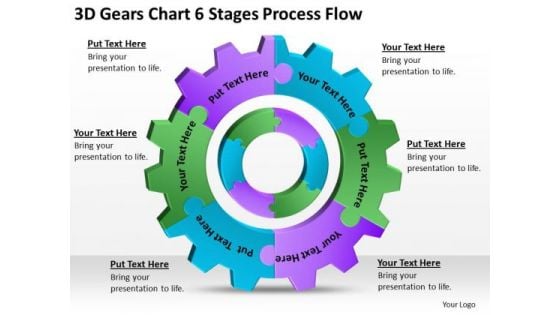
3d Gears Chart 6 Stages Process Flow Ppt Business Plans For Sale PowerPoint Slides
Analyse ailments on our 3d gears chart 6 stages process flow ppt business plans for sale PowerPoint Slides. Bring out the thinking doctor in you. Bite the bullet with our 3d Gears Chart 6 Stages Process Flow Ppt Business Plans For Sale PowerPoint Slides. Face the issues head-on.
Real Property Strategic Plan Real Estate Home Sales Chart Ppt Icon Slide PDF
Deliver and pitch your topic in the best possible manner with this real property strategic plan real estate home sales chart ppt icon slide pdf. Use them to share invaluable insights on real estate home sales chart and impress your audience. This template can be altered and modified as per your expectations. So, grab it now.
Business Quarterly Sales Pie Chart Ppt PowerPoint Presentation Icon Slides PDF
Showcasing this set of slides titled business quarterly sales pie chart ppt powerpoint presentation icon slides pdf. The topics addressed in these templates are business quarterly sales pie chart. All the content presented in this PPT design is completely editable. Download it and make adjustments in color, background, font etc. as per your unique business setting.
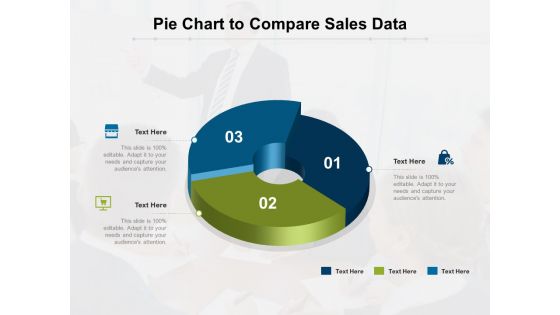
Pie Chart To Compare Sales Data Ppt PowerPoint Presentation Gallery Design Templates PDF
Showcasing this set of slides titled pie chart to compare sales data ppt powerpoint presentation gallery design templates pdf. The topics addressed in these templates are pie chart to compare sales data. All the content presented in this PPT design is completely editable. Download it and make adjustments in color, background, font etc. as per your unique business setting.
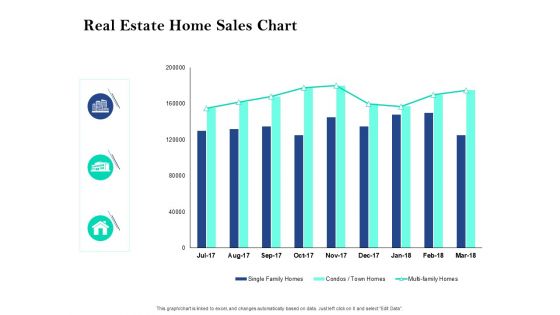
Property Investment Strategies Real Estate Home Sales Chart Ppt PowerPoint Presentation Ideas Graphics Template PDF
Deliver and pitch your topic in the best possible manner with this property investment strategies real estate home sales chart ppt powerpoint presentation ideas graphics template pdf. Use them to share invaluable insights on real estate home sales chart. and impress your audience. This template can be altered and modified as per your expectations. So, grab it now.
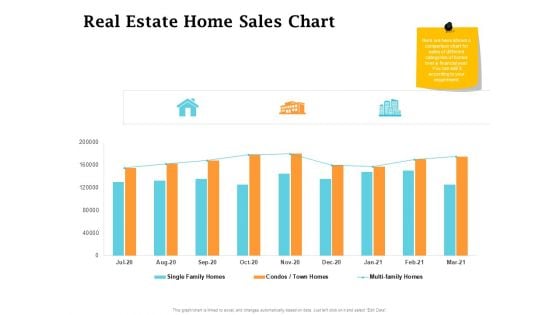
Real Estate Asset Management Real Estate Home Sales Chart Ppt Infographic Template Mockup PDF
Deliver and pitch your topic in the best possible manner with this real estate asset management real estate home sales chart ppt infographic template mockup pdf. Use them to share invaluable insights on real estate home sales chart and impress your audience. This template can be altered and modified as per your expectations. So, grab it now.
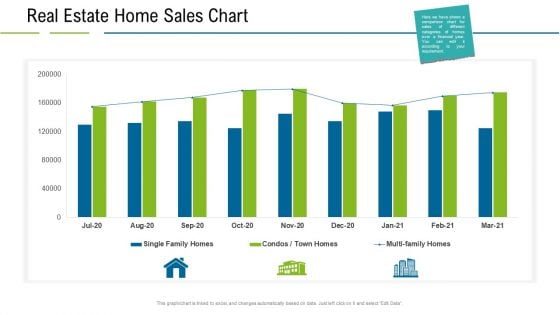
United States Real Estate Industry Real Estate Home Sales Chart Ppt Gallery Infographic Template PDF
Deliver and pitch your topic in the best possible manner with this united states real estate industry real estate home sales chart ppt gallery infographic template pdf. Use them to share invaluable insights on real estate home sales chart and impress your audience. This template can be altered and modified as per your expectations. So, grab it now.
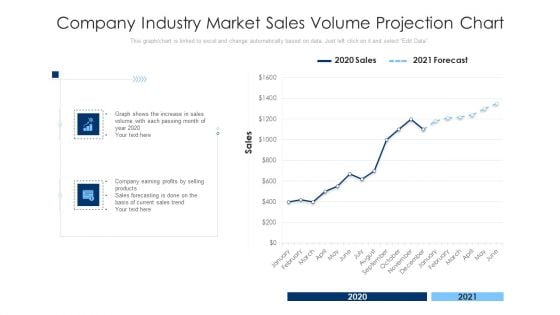
Company Industry Market Sales Volume Projection Chart Ppt PowerPoint Presentation Infographic Template Clipart PDF
Pitch your topic with ease and precision using this company industry market sales volume projection chart ppt powerpoint presentation infographic template clipart pdf. This layout presents information on company industry market sales volume projection chart. It is also available for immediate download and adjustment. So, changes can be made in the color, design, graphics or any other component to create a unique layout.
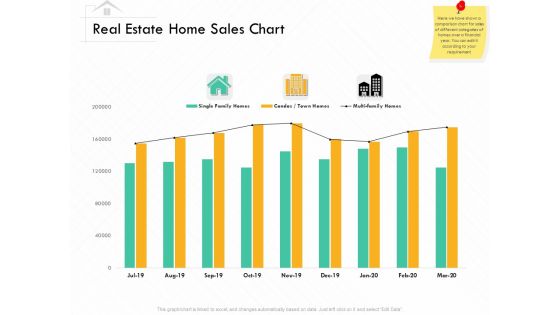
Selling Home Property Real Estate Home Sales Chart Ppt Professional Slideshow PDF
Deliver and pitch your topic in the best possible manner with this selling home property real estate home sales chart ppt professional slideshow pdf. Use them to share invaluable insights on real estate home sales chart and impress your audience. This template can be altered and modified as per your expectations. So, grab it now.
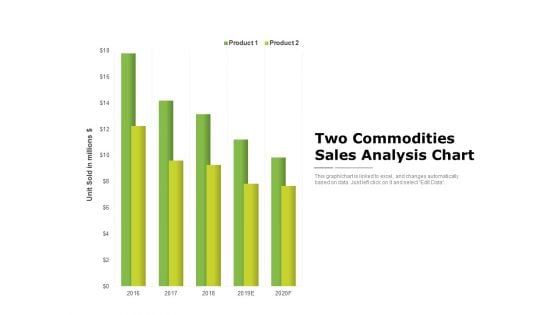
Two Commodities Sales Analysis Chart Ppt PowerPoint Presentation Ideas Inspiration PDF
Showcasing this set of slides titled two commodities sales analysis chart ppt powerpoint presentation ideas inspiration pdf. The topics addressed in these templates are two commodities sales analysis chart. All the content presented in this PPT design is completely editable. Download it and make adjustments in color, background, font etc. as per your unique business setting.
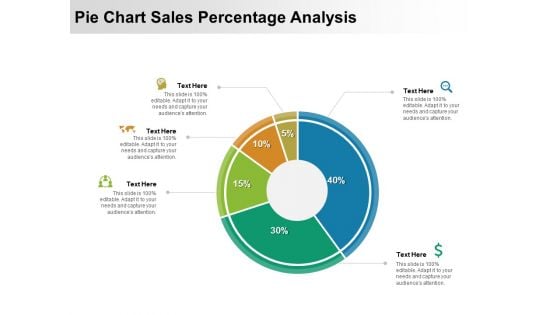
Pie Chart Sales Percentage Analysis Ppt PowerPoint Presentation Gallery Slides PDF
Showcasing this set of slides titled pie chart sales percentage analysis ppt powerpoint presentation gallery slides pdf. The topics addressed in these templates are pie chart sales percentage analysis. All the content presented in this PPT design is completely editable. Download it and make adjustments in color, background, font etc. as per your unique business setting.
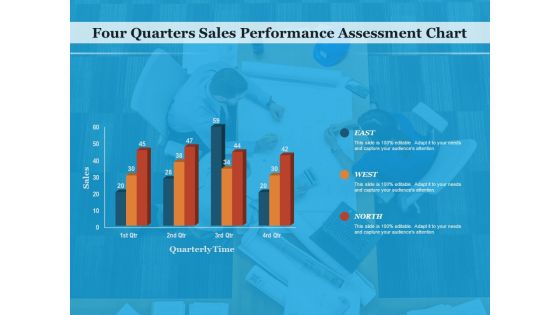
Four Quarters Sales Performance Assessment Chart Ppt PowerPoint Presentation Gallery Maker PDF
Showcasing this set of slides titled four quarters sales performance assessment chart ppt powerpoint presentation gallery maker pdf. The topics addressed in these templates are four quarters sales performance assessment chart. All the content presented in this PPT design is completely editable. Download it and make adjustments in color, background, font etc. as per your unique business setting.


 Continue with Email

 Home
Home


