Waterfall Chart

Business Framework Vision Mission Strategic And Enabling Pillars PowerPoint Presentation
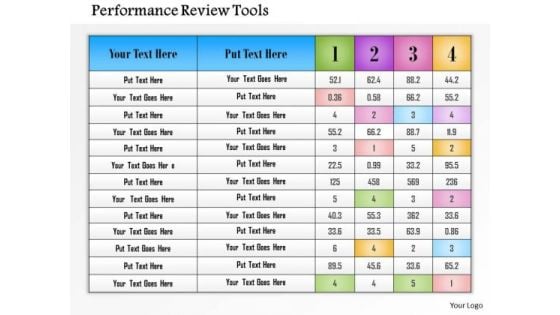
Business Framework Performance Review Tools PowerPoint Presentation
This Power Point template slide has been designed with graphic of text box chart. This text box chart contains the performance tools and ratings. This PPT slide can be used for business and individual performance judgment techniques with these tools.
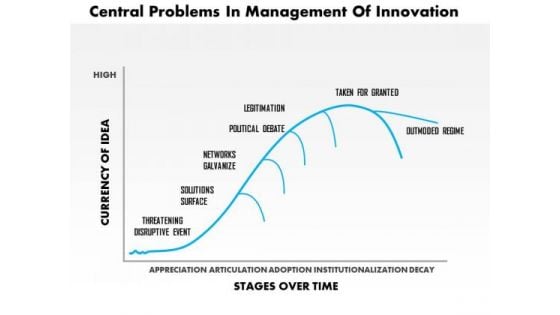
Business Framework Central Problems In Management Of Innovation PowerPoint Presentation
This business framework PPT has been crafted with graphic of analysis chart. This chart is displaying the curve of analysis for central problem in management of innovation. Use this diagram slide and display problems in form of analysis.
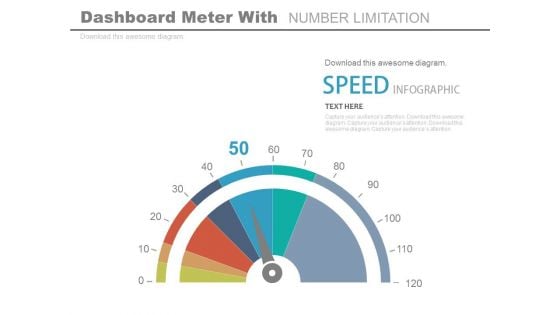
Dashboard To Impact The Performance Powerpoint Slides
This PowerPoint template graphics of meter chart. Download this PPT chart for business performance analysis. This PowerPoint slide is of great help in the business sector to make realistic presentations and provides effective way of presenting your newer thoughts.
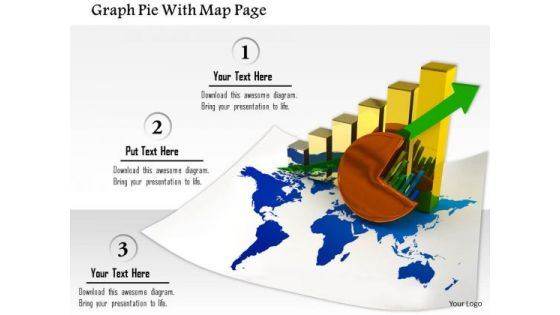
Stock Photo Graph Pie With Map Page PowerPoint Slide
This image slide contains business charts on world map. This image is designed with bar graph and pie chart on world map depicting global economy. Use this image slide to represent financial growth in any business presentation.
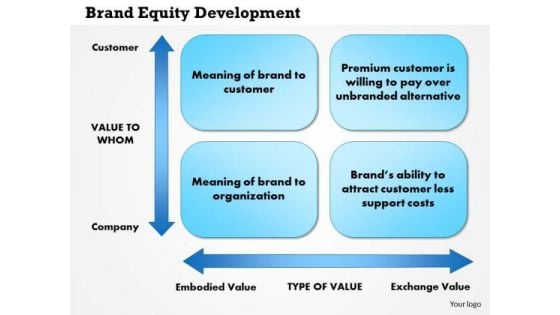
Business Framework Brand Equity Development PowerPoint Presentation
This power point diagram slide has been crafted with graphic of two axial flow chart. This chart refers to the concept of brand equity development. Display this concept in your presentations and get detailed information about brand architecture.
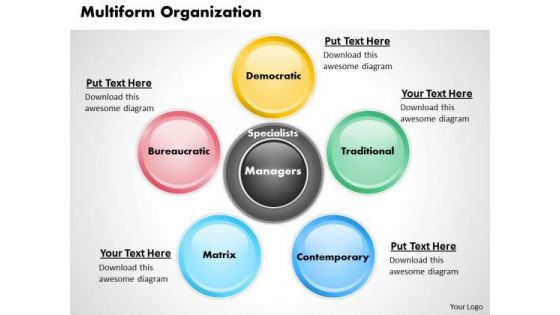
Business Framework Multiform Organization PowerPoint Presentation
This power point template has been crafted with multiform organization chart. This PPT contains five staged multiform organization chart which can be used for various organizational operations. Add this PPT in your business presentations and create an impact on viewers.
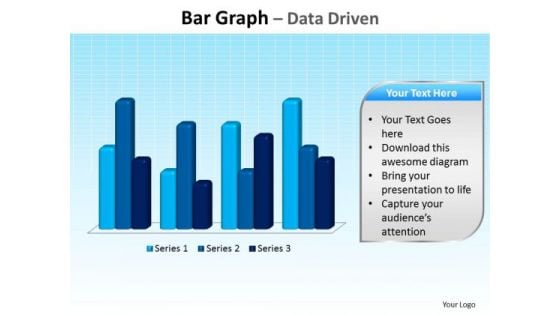
Business Education PowerPoint Templates Business Bar Graph Data Driven Ppt Slides
Business Education PowerPoint Templates Business bar graph data driven PPT Slides-This PowerPoint slide is a data driven Columns Chart. The number of columns depend on the data.-Business Editable PowerPoint Templates Business beveled column chart PPT Slides-This ppt can be used for concepts relating to-chart,, graph, growth, investment, , market, percentage, , presentation report, results, statistics, stock, success and business. Our Business Education PowerPoint Templates Business Bar Graph Data Driven Ppt Slides keep the faith alive. Belief in you will get stronger.
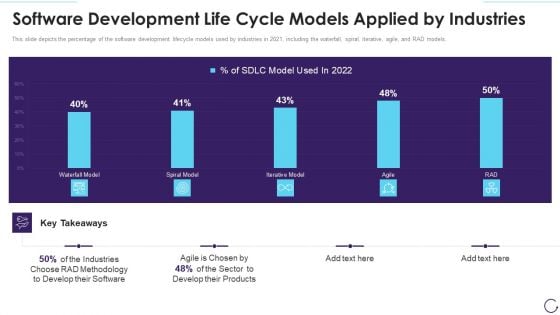
Software Development Life Cycle Models Applied By Industries Template PDF
This slide depicts the percentage of the software development lifecycle models used by industries in 2021, including the waterfall, spiral, iterative, agile, and RAD models. Deliver an awe inspiring pitch with this creative software development life cycle models applied by industries template pdf bundle. Topics like time usage of software development life cycle models in software development designs pdf can be discussed with this completely editable template. It is available for immediate download depending on the needs and requirements of the user.
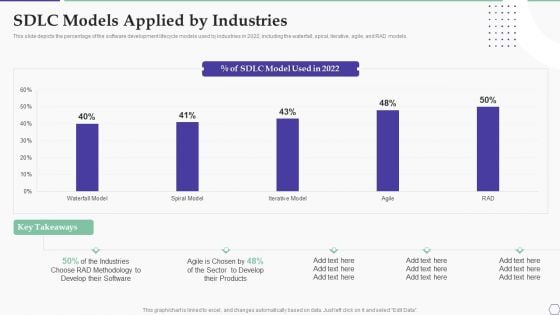
Solution Development Process SDLC Models Applied By Industries Rules PDF
This slide depicts the percentage of the software development lifecycle models used by industries in 2022, including the waterfall, spiral, iterative, agile, and RAD models.Deliver and pitch your topic in the best possible manner with this Solution Development Process SDLC Models Applied By Industries Rules PDF. Use them to share invaluable insights on Industries, Choose Methodology, Develop Software and impress your audience. This template can be altered and modified as per your expectations. So, grab it now.
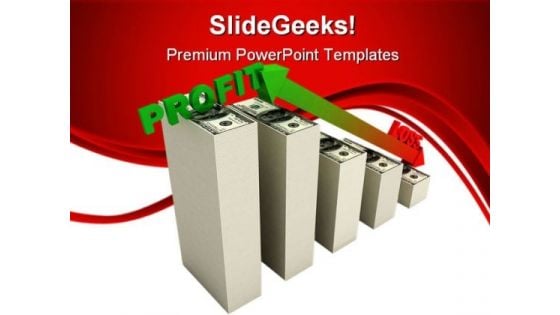
Profit Graph Business PowerPoint Templates And PowerPoint Backgrounds 0711
Microsoft PowerPoint Template and Background with business chart Discover new faith with our Profit Graph Business PowerPoint Templates And PowerPoint Backgrounds 0711. Let extra dimensions in you emerge.
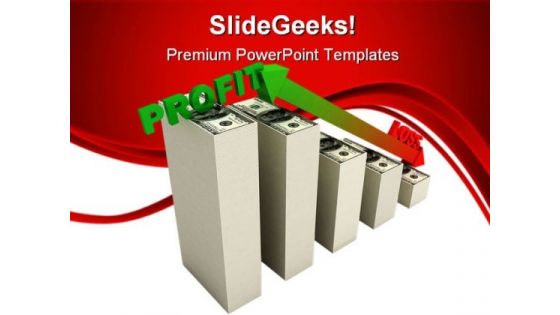
Profit Graph Business PowerPoint Themes And PowerPoint Slides 0711
Microsoft PowerPoint Theme and Slide with business chart Extract assent with our Profit Graph Business PowerPoint Themes And PowerPoint Slides 0711. The audience will become agreeable.
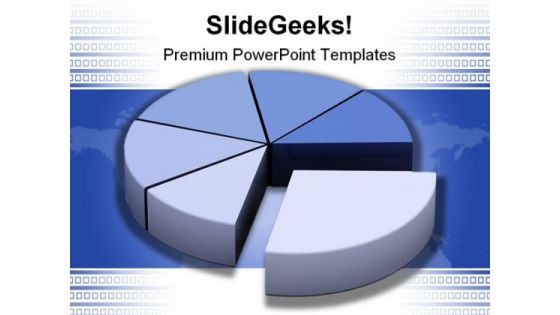
Pie Business PowerPoint Template 0510
Golden pie chart on a white background. Part of a series. Optimize your business cyclewith our Pie Business PowerPoint Template 0510. You'll deliver your best presentation yet.
Business Data Graph PowerPoint Icon Cc
Increasing Bar Chart - Business Data Graph With World Map Lead your army with our Business Data Graph PowerPoint Icon Cc. You will come out on top.
Business Data Graph PowerPoint Icon S
Increasing Bar Chart - Business Data Graph With World Map Our Business Data Graph PowerPoint Icon S do not compromise. Excellence is always the aim.

Market Crisis Finance PowerPoint Template 0610
Market chart with graph and stack of money Raise the bar with our Market Crisis Finance PowerPoint Template 0610. You will come out on top.
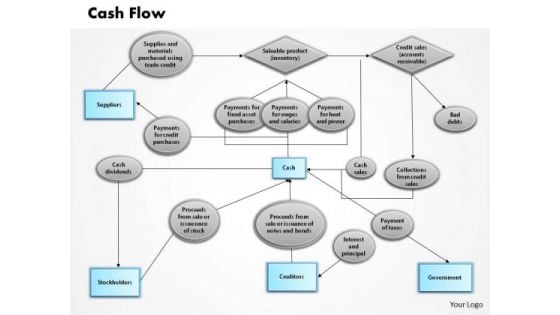
Business Framework Cash Flow PowerPoint Presentation
This business framework power point template has been crafted with graphic of multistage flowchart. This flow chart displays the concept of cash flow. This cash flow chart contains various decision boxes for explaining the importance of decision. this PPT is designed for business presentations use it and create an impact on viewers.
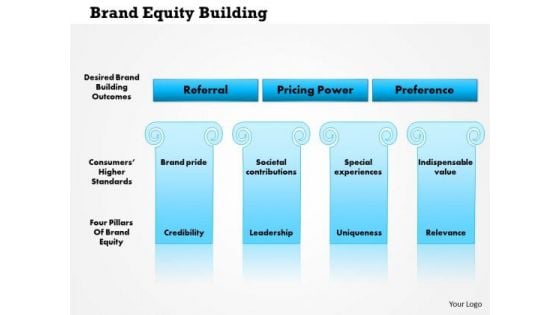
Business Framework Brand Equity Building PowerPoint Presentation
This business power point diagram slide has been crafted with graphic of two level flow chart. This flow chart is used to display brand equity building concept. To display the brand extension and brand strategy, use this exclusive graphic slide in your business presentations.
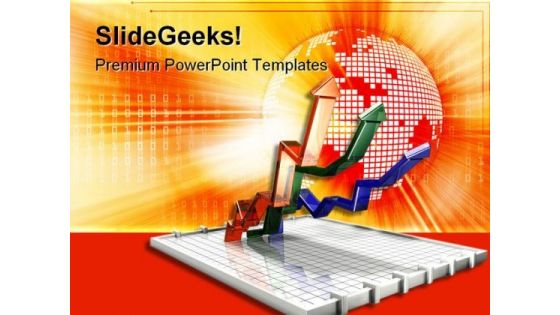
Business Growth Globe PowerPoint Template 0510
3d illustration of three up arrows on a flat box chart Bounce back with our Business Growth Globe PowerPoint Template 0510. You will come out on top.
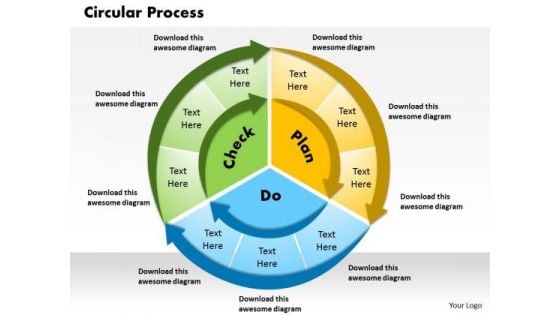
Business Framework Circular Process PowerPoint Presentation
Explain the circular process and its usage in business process flow. To define this we have used the graphic of three colored circular process chart. This chart can be used for various business flow representation. Use this Pot for business and marketing process flow related presentations.
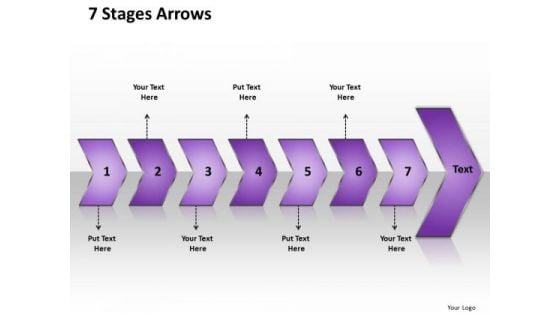
Ppt 7 Linear Curved Arrows PowerPoint 2010 Placed Sequentially Templates
PPT 7 linear curved arrows powerpoint 2010 placed sequentially Templates-This 3D Business PowerPoint Diagram Displays the curved arrows Successive to each other signifying the continuous flow of steps to be executed. This Diagram can be used to represent Process charts, Business chart, and Sales process chart and Finance process etc. An excellent graphic to attract the attention of your audience to improve earnings.-PPT 7 linear curved arrows powerpoint 2010 placed sequentially Templates-Arrow, Background, Process, Business, Chart, Diagram, Financial, Graphic, Gray, Icon, Illustration, Management, Orange, Perspective, Process, Reflection, Stage, Text, Transparency You will find our Ppt 7 Linear Curved Arrows PowerPoint 2010 Placed Sequentially Templates truly amenable. They will vibe well with your thoughts.
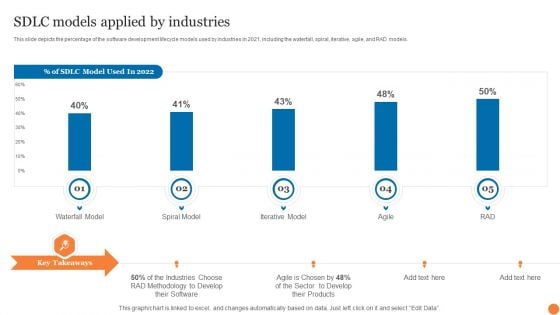
SDLC Models Applied By Industries Phases Of Software Development Procedure Mockup PDF
This slide depicts the percentage of the software development lifecycle models used by industries in 2021, including the waterfall, spiral, iterative, agile, and RAD models.This SDLC Models Applied By Industries Phases Of Software Development Procedure Mockup PDF is perfect for any presentation, be it in front of clients or colleagues. It is a versatile and stylish solution for organizing your meetings. The product features a modern design for your presentation meetings. The adjustable and customizable slides provide unlimited possibilities for acing up your presentation. Slidegeeks has done all the homework before launching the product for you. So, do not wait, grab the presentation templates today.
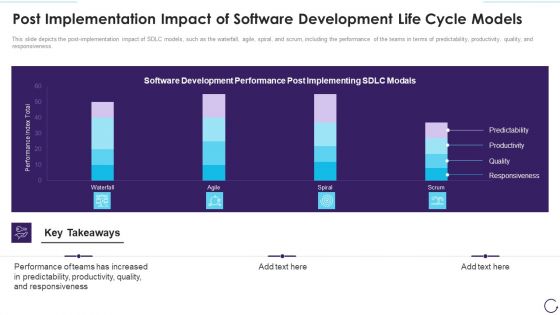
Post Implementation Impact Of Software Development Life Cycle Models Diagrams PDF
This slide depicts the post-implementation impact of SDLC models, such as the waterfall, agile, spiral, and scrum, including the performance of the teams in terms of predictability, productivity, quality, and responsiveness. Deliver an awe inspiring pitch with this creative overview of the software development life cycle company demonstration pdf bundle. Topics like maintenance of the product, requirement gathering and analysis, deployment in the market can be discussed with this completely editable template. It is available for immediate download depending on the needs and requirements of the user.
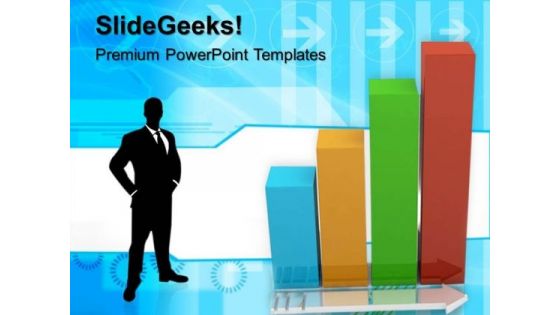
Bar Graph With Arrow Business PowerPoint Templates And PowerPoint Themes 0512
Microsoft Powerpoint Templates and Background with bar chart growth-These templates can be used for presentations relating to-Bar chart growth, business, marketing, finance, success, sales-Bar Garph With Arrow Business PowerPoint Templates And PowerPoint Themes 0512 Beat the budget with our Bar Graph With Arrow Business PowerPoint Templates And PowerPoint Themes 0512. Have enough to spare in the end.
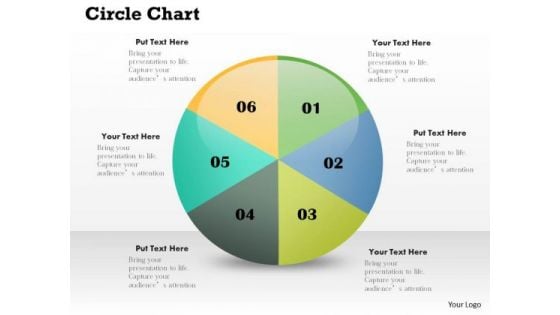
Business Framework PowerPoint Circle Diagram PowerPoint Presentation
This image slide displays circle chart template. This innovative image slide has been designed with pie chart to represent progress. This image slide is 100% editable. You may change color, size and orientation of any icon to your liking. This image slide may be used in school, business and social presentations. Make your presentations interesting using this image slide.
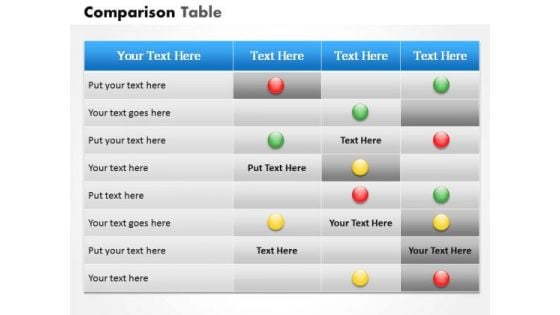
Business Framework PowerPoint Comparison Template PowerPoint Presentation
This image slide displays comparison chart diagram template. This innovative image slide has been designed with chart to represent progress. This image slide is 100% editable. You may change color, size and orientation of any icon to your liking. This image slide may be used in school, business and social presentations. This image slide will enhance the quality of your presentations.
Dashboard With Business Icons Powerpoint Slides
This PowerPoint template graphics of meter chart with business icons. Download this PPT chart to simplify business data analysis. This PowerPoint slide is of great help in the business sector to make realistic presentations and provides effective way of presenting your newer thoughts.
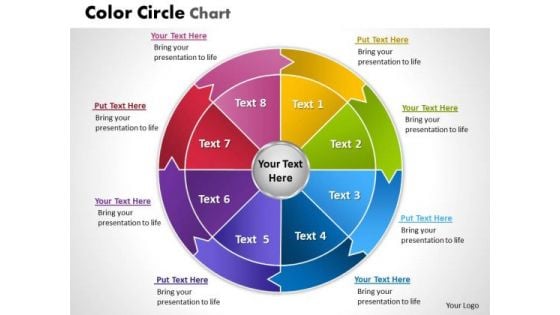
Business Framework PowerPoint Wheel PowerPoint Presentation
This image slide displays color circle chart template. This innovative image slide has been designed with circular chart to represent information. This image slide is 100% editable. You may change color, size and orientation of any icon to your liking. This image slide may be used in school, business and social presentations. Make your presentations interesting using this image slide.
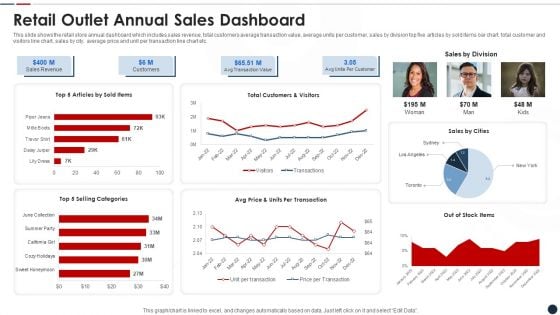
Retail Outlet Annual Sales Dashboard Elements PDF
This slide shows the retail store annual dashboard which includes sales revenue, total customers average transaction value, average units per customer, sales by division top five articles by sold items bar chart, total customer and visitors line chart, sales by city, average price and unit per transaction line chart etc.Pitch your topic with ease and precision using this retail outlet annual sales dashboard elements pdf This layout presents information on Retail outlet annual sales dashboard It is also available for immediate download and adjustment. So, changes can be made in the color, design, graphics or any other component to create a unique layout.
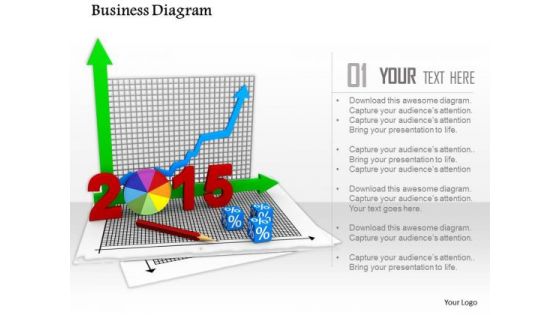
0814 Business Diagram For Planning Image Graphics For PowerPoint
Define the concepts of planning with this unique image. This image of charts and graphs depicts planning for year 2015. In this image pie chart and bar graph is displayed with year 2015. Use this image in business, marketing and sales related presentations.
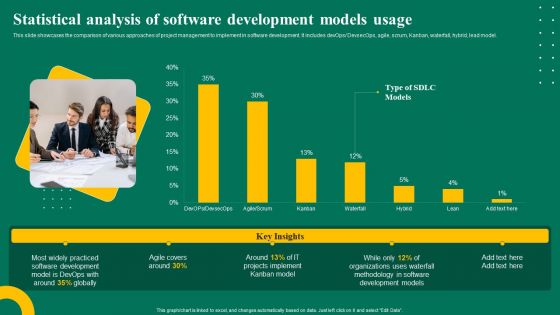
Statistical Analysis Of Software Development Models Usage Ppt Summary Inspiration PDF
This slide showcases the comparison of various approaches of project management to implement in software development. It includes devOps DevsecOps, agile, scrum, Kanban, waterfall, hybrid, lead model. Whether you have daily or monthly meetings, a brilliant presentation is necessary. Statistical Analysis Of Software Development Models Usage Ppt Summary Inspiration PDF can be your best option for delivering a presentation. Represent everything in detail using Statistical Analysis Of Software Development Models Usage Ppt Summary Inspiration PDF and make yourself stand out in meetings. The template is versatile and follows a structure that will cater to your requirements. All the templates prepared by Slidegeeks are easy to download and edit. Our research experts have taken care of the corporate themes as well. So, give it a try and see the results.
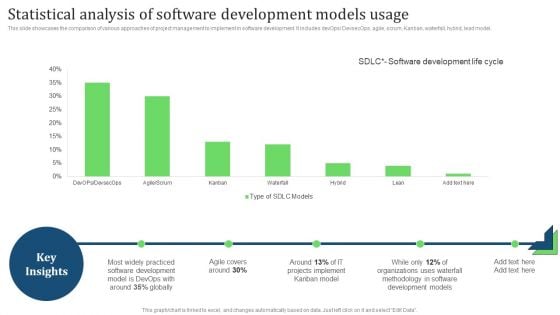
Statistical Analysis Of Software Development Models Usage Topics PDF
This slide showcases the comparison of various approaches of project management to implement in software development. It includes devOps DevsecOps, agile, scrum, Kanban, waterfall, hybrid, lead model. Find highly impressive Statistical Analysis Of Software Development Models Usage Topics PDF on Slidegeeks to deliver a meaningful presentation. You can save an ample amount of time using these presentation templates. No need to worry to prepare everything from scratch because Slidegeeks experts have already done a huge research and work for you. You need to download Statistical Analysis Of Software Development Models Usage Topics PDF for your upcoming presentation. All the presentation templates are 100 percent editable and you can change the color and personalize the content accordingly. Download now
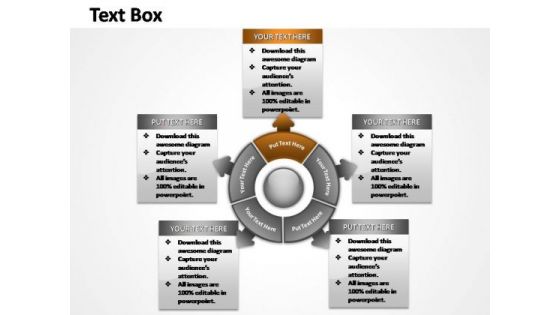
PowerPoint Slides Sales Steps Ppt Process
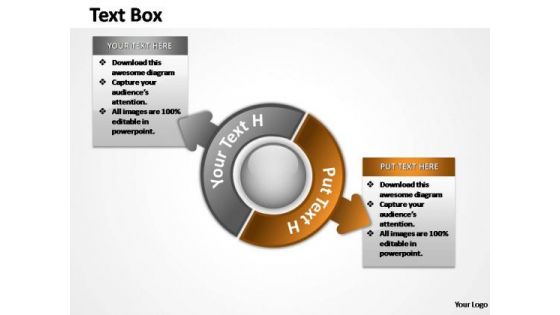
This chart visualize the of process steps, reoccurrences and components or of your company structure or product features. Embrace your dreams with our PowerPoint Slides Sales Steps Ppt Process. They will come within your grasp.
PowerPoint Slides Sales Steps Ppt Slide Designs
Circular business process chart assist you in creating your project roadmap with different ways, interim goals and project steps. Examine every argument with our PowerPoint Slides Sales Steps Ppt Slide Designs. Arrive at conclusions that befit your business.
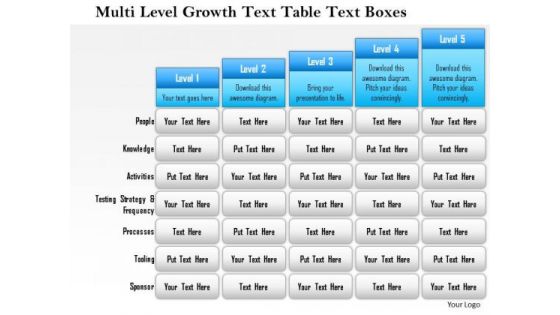
Business Framework Multi Level Growth Text Table Text Boxes 2 PowerPoint Presentation
Five staged text box style chart in bar graph design has been used to decorate this power point template slide. This diagram slide contains the multilevel growth concept. Use this PPT slide for financial growth and result analysis related topics.
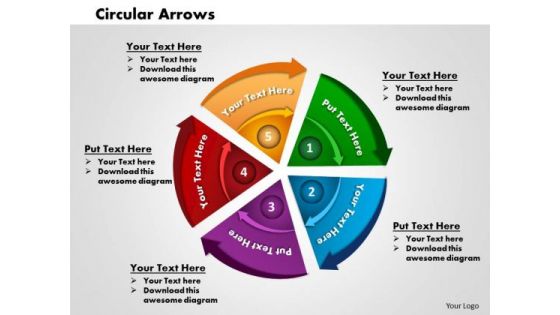
Business Framework Circular Arrows PowerPoint Presentation
This unique Power Point template has been crafted with graphic of circular flow chart with arrows. Enhance the effect of your view with this exclusive PPT. Use this PPT for your business and sales process flow activity.

Business Framework Business Unit PowerPoint Presentation
This Professional Power Point template has been crafted for business unit representation. This diagram template slide contains the graphic of two interconnected flow chart with three stages. Use this slide for displaying process flow for business and marketing activities.
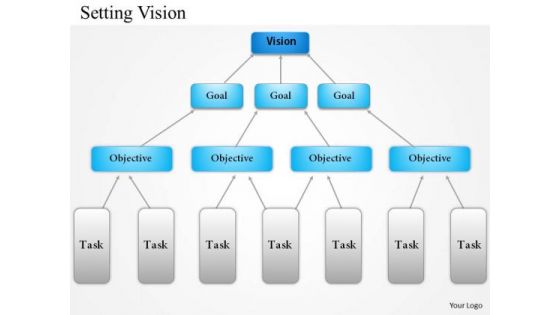
Business Framework Setting Vision PowerPoint Presentation
Set your business vision with this exclusive business framework power point template. This business PPT contains the graphic of flow chart architecture with three stages. Use this diagram template for setting vision and goal for getting success in business.
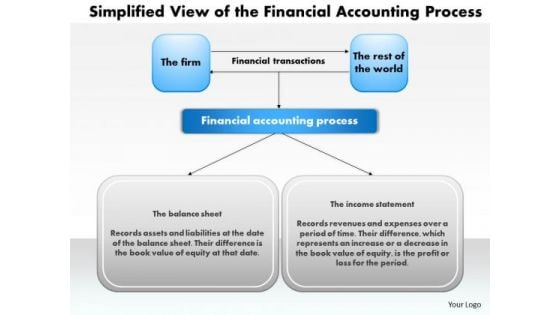
Business Framework Simplified View Of The Financial Accounting Process PowerPoint Presentation
Get the simplified view of financial accounting process with this unique business framework power point template. This diagram PPT contains the graphic of flow chart in vertical order. Use this PPT for business and finance related presentations.
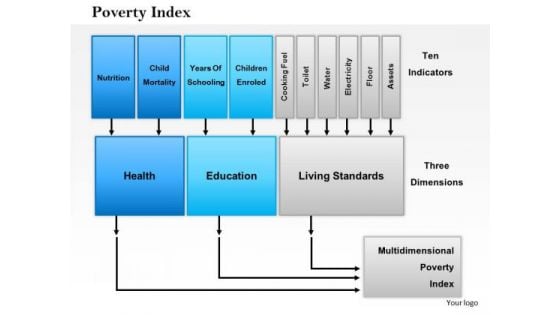
Business Framework Poverty Index PowerPoint Presentation
A linear growth chart with text boxes has been used to decorate this Power Point template slide. This diagram slide contains the concept of poverty index. Use this index in your financial presentations to show poverty based calculation.
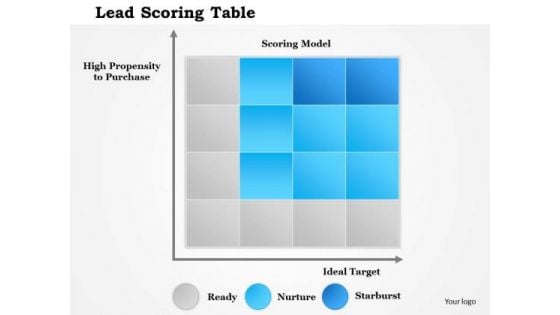
Business Framework Lead Scoring Table PowerPoint Presentation
A graph style cubical chart has been used to decorate this power point template slide. This PPT slide contains the concept of explaining score. Use this score table for displaying any data.
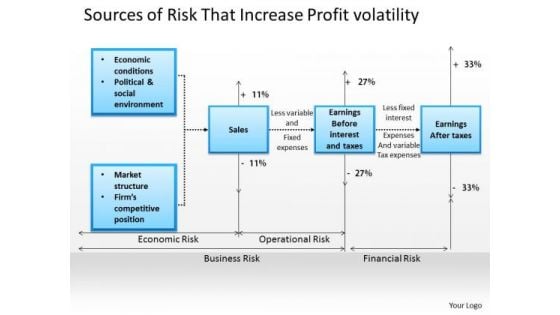
Business Framework Sources Of Risk That Increase Profit Volatility 2 PowerPoint Presentation
This PPT shows the sources of risk that increases profit volatility. This business framework power point template has been designed with graphic of text boxes in flow chart style. Use this PPT for business and marketing related topics.
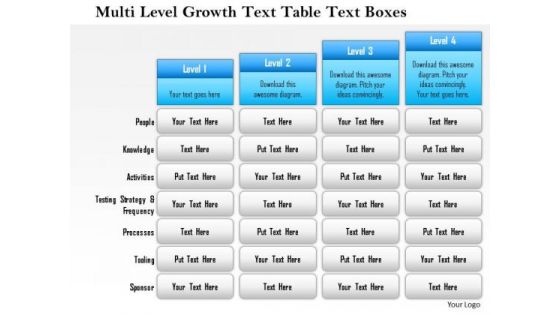
Business Framework Multi Level Growth Text Table Text Boxes 1 PowerPoint Presentation
Four staged text box chart design has been used to decorate this power point template slide. This PPT slide contains the concept of multi level growth. Use this PPT slide for your business and finance related presentations.
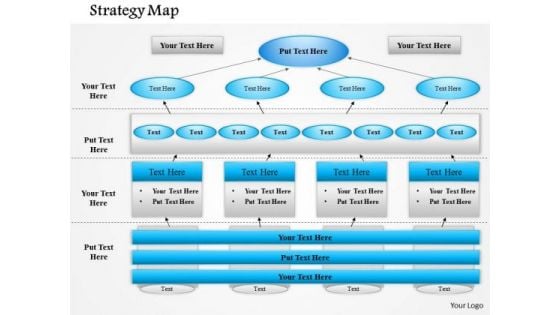
Business Framework Business Strategy Map PowerPoint Presentation
this business framework PPTslide has been designed with graphic of multilevel flow chart with multiple stages. This diagram PPT is usable for business strategy map. Use it and build a quality presentation for business topics.
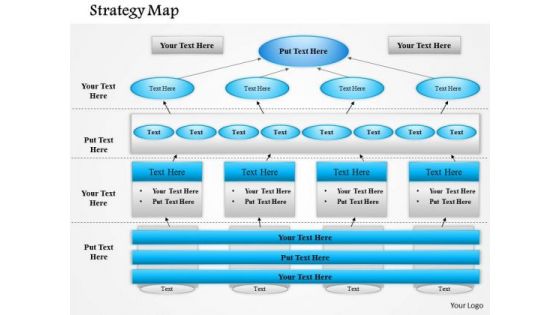
Business Framework Business Strategy Map PowerPoint Presentation 1
This PPTslide has been crafted with graphic of multilevel flow chart with multiple stages. This diagram PPT is usable for business strategy map. Use it and build a quality presentation for business topics.
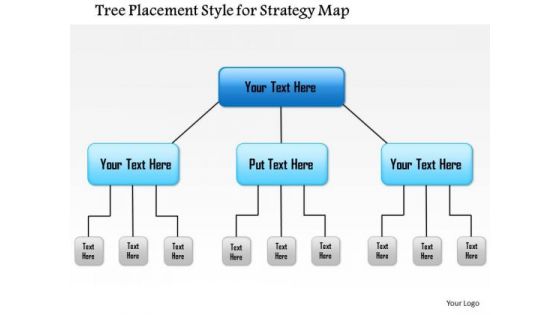
Business Framework Tree Placement Style For Strategy Map PowerPoint Presentation
A two layer flow chart diagram has been used to design this PPT slide. This PPT slide contains the concept of mapping for strategy. This PPt slide is useful for business and marketing strategy related presentations.
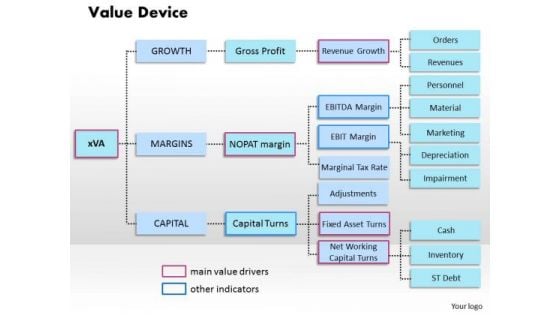
Business Framework Value Device PowerPoint Presentation
This business slide depicts framework of value device. It contains flow chart depicting activities related to growth margin and capital. Download this diagram as a tool for business presentations
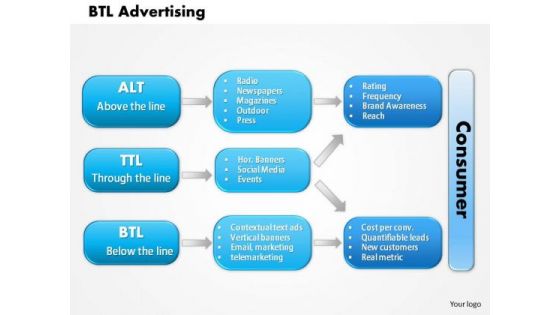
Business Framework Btl Advertising PowerPoint Presentation
This image has been designed for explaining the concept of below the line advertising. To display this concept we have used graphic of multi-link flow chart which displays the sequence of advertising. Use this PPT slide for marketing and sales.
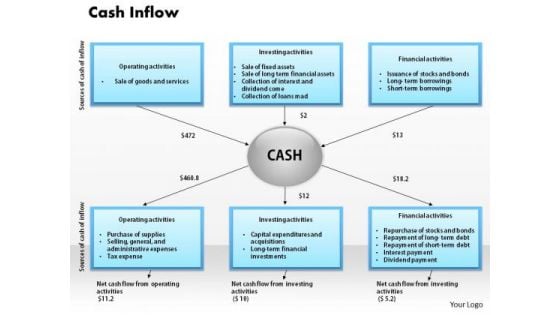
Business Framework Cash Inflow PowerPoint Presentation
Display the process of cash inflow with this business framework PPT. A multistage and interconnected flow chart has been used to display cash inflow process. Use this PPT and build more effective presentation for finance and money related concepts.
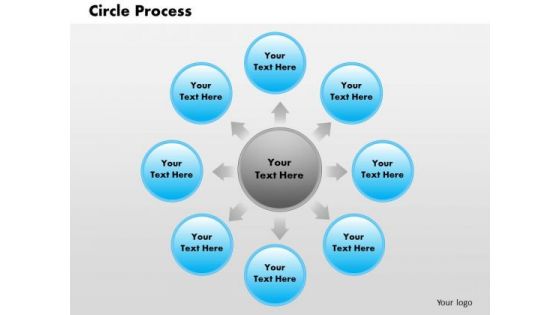
Business Framework Circle Process PowerPoint Presentation
A five staged multicolored circular process chart has been used to decorate this PPT. this business framework PPT is usable for various process flow with multiple levels. Use this PPT in your presentation and get good comments from viewers.
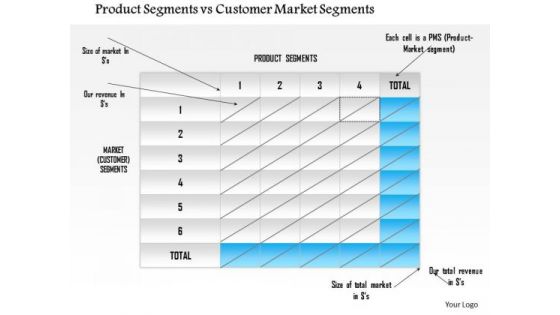
Business Framework Product Segments Vs Customer Market Segments PowerPoint Presentation
Blue and white cubes are used to design this chart for defining the concept of comparison. This PPT slide can be used to compare the product and customer market segments. Use this PPT slide for business and marketing presentations.
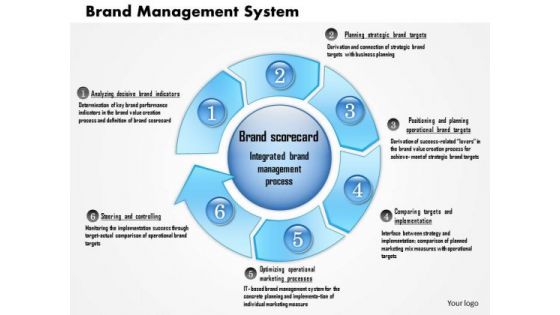
Business Framework Brand Management System PowerPoint Presentation
Explain the concept of brand management in any business presentation with this exclusive power point slide. We have used circular flow chart with multiple stages for displaying this system. This image may be used for sales and finance related presentations.
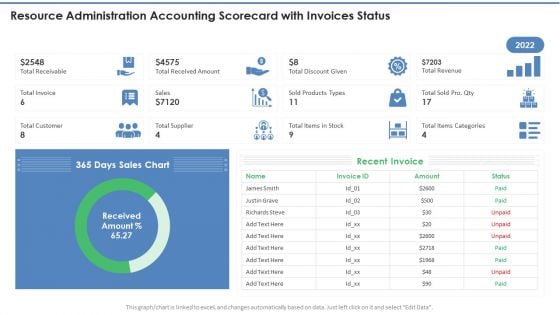
Resource Administration Accounting Scorecard With Invoices Status Topics PDF
This graph or chart is linked to excel, and changes automatically based on data. Just left click on it and select Edit Data. Deliver an awe inspiring pitch with this creative Resource Administration Accounting Scorecard With Invoices Status Topics PDF bundle. Topics like Recent Invoice, Sales Chart, Total Receivable can be discussed with this completely editable template. It is available for immediate download depending on the needs and requirements of the user.
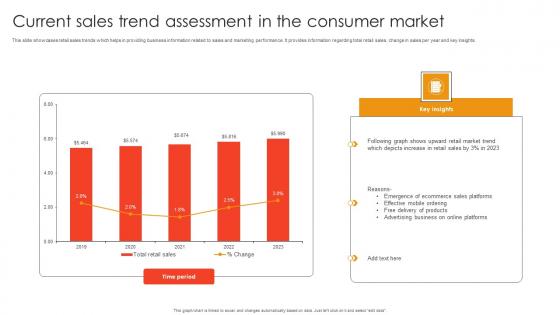
Current Sales Trend Assessment In The Consumer Market Sample Pdf
This slide showcases retail sales trends which helps in providing business information related to sales and marketing performance. It provides information regarding total retail sales, change in sales per year and key insights. Showcasing this set of slides titled Current Sales Trend Assessment In The Consumer Market Sample Pdf. The topics addressed in these templates are Emergence Ecommerce Sales Platforms, Effective Mobile Ordering, Free Delivery Products. All the content presented in this PPT design is completely editable. Download it and make adjustments in color, background, font etc. as per your unique business setting. This slide showcases retail sales trends which helps in providing business information related to sales and marketing performance. It provides information regarding total retail sales, change in sales per year and key insights.
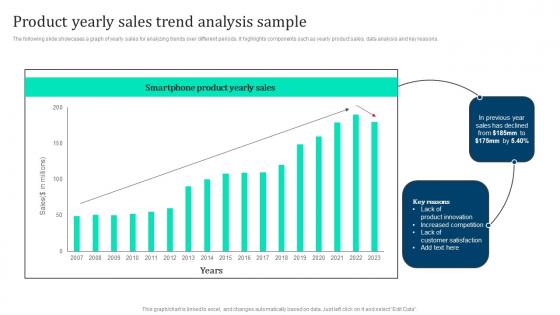
Product Yearly Sales Trend Analysis Marketing Intelligence Guide Data Gathering Introduction Pdf
The following slide showcases a graph of yearly sales for analyzing trends over different periods. It highlights components such as yearly product sales, data analysis and key reasons. Create an editable Product Yearly Sales Trend Analysis Marketing Intelligence Guide Data Gathering Introduction Pdf that communicates your idea and engages your audience. Whether you are presenting a business or an educational presentation, pre designed presentation templates help save time. Product Yearly Sales Trend Analysis Marketing Intelligence Guide Data Gathering Introduction Pdf is highly customizable and very easy to edit, covering many different styles from creative to business presentations. Slidegeeks has creative team members who have crafted amazing templates. So, go and get them without any delay. The following slide showcases a graph of yearly sales for analyzing trends over different periods. It highlights components such as yearly product sales, data analysis and key reasons.
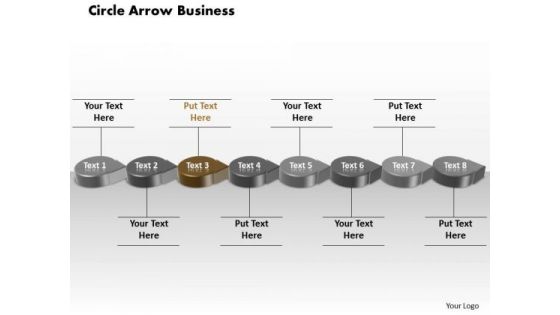
Ppt Brown PowerPoint Presentation Circular Arrow Business Transactions Diagram Templates
PPT brown powerpoint presentation circular arrow business transactions diagram Templates-This 3D Business PowerPoint Diagram Displays the circular arrows connected to each other signifying the continuous flow of steps to be executed. This Diagram can be used to represent Process charts, Business chart, Sales process chart and Finance process etc.-PPT brown powerpoint presentation circular arrow business transactions diagram Templates-3d, Advertisement, Advertising, Arrow, Border, Business, Circles, Collection, Customer, Design, Element, Icon, Idea, Illustration, Info, Information, Isolated, Label, Light, Location, Needle, New, Notification, Notify, Point, Pointer, Promotion, Role, Rounded Our Ppt Brown PowerPoint Presentation Circular Arrow Business Transactions Diagram Templates always show a full face. Get a complete view from any angle.
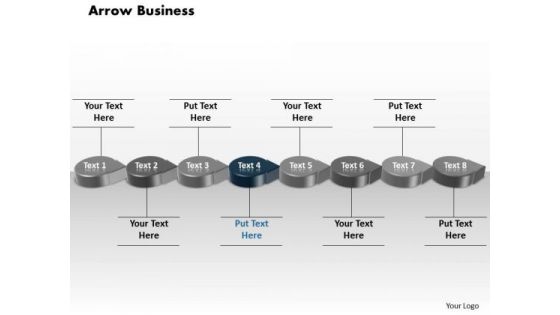
Ppt Blue Circular Arrow Business Transactions Diagram PowerPoint Slide Text Templates
PPT blue circular arrow business transactions diagram powerpoint slide text Templates-This 3D Business PowerPoint Diagram Displays the circular arrows connected to each other signifying the continuous flow of steps to be executed. This Diagram can be used to represent Process charts, Business chart, Sales process chart and Finance process etc.-PPT blue circular arrow business transactions diagram powerpoint slide text Templates-3d, Advertisement, Advertising, Arrow, Border, Business, Circles, Collection, Customer, Design, Element, Icon, Idea, Illustration, Info, Information, Isolated, Label, Light, Location, Needle, New, Notification, Notify, Point, Pointer, Promotion, Role, Rounded Establish the fundamentals of the venture. Fix the parameters. with our Ppt Blue Circular Arrow Business Transactions Diagram PowerPoint Slide Text Templates.
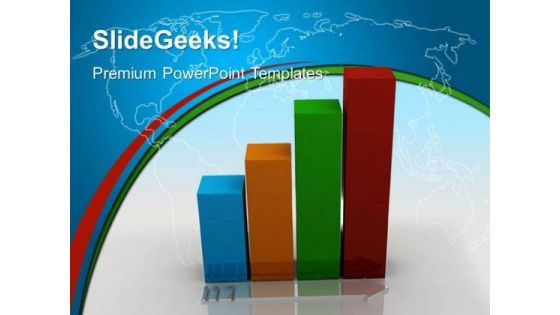
Bar Graph Showing Growth Global PowerPoint Templates And PowerPoint Themes 0412
Microsoft Powerpoint Templates and Background with bar chart growth Failsafe systems are difficult to design. Get to the bottom of it with our Bar Graph Showing Growth Global PowerPoint Templates And PowerPoint Themes 0412.
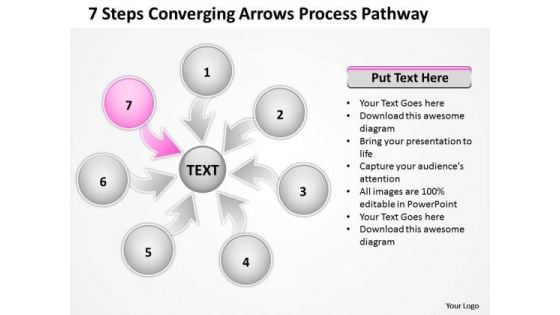
7 Steps Coverging Arrows Process Pathway Network Software PowerPoint Slide
We present our 7 steps coverging arrows process pathway Network Software PowerPoint Slide.Download our Arrows PowerPoint Templates because Our PowerPoint Templates and Slides will steer your racing mind. Hit the right buttons and spur on your audience. Download our Business PowerPoint Templates because maximising sales of your product is the intended destination. Download our Flow Charts PowerPoint Templates because Our PowerPoint Templates and Slides are aesthetically designed to attract attention. We gaurantee that they will grab all the eyeballs you need. Download and present our Ring Charts PowerPoint Templates because this graphics helps you to prove how they mesh to motivate the company team and provide the steam to activate the composite machine. Use our Circle Charts PowerPoint Templates because they represent the proress in our lives.Use these PowerPoint slides for presentations relating to Business, Businessman, Center, Central, Chart, Empty, Expand, Flow, Gist, Group, Industry, Link, Management, Manager, Part, Plan, Process, Scatter, Separate, Spread, Strategy, Support, Surround, Template, Transfer. The prominent colors used in the PowerPoint template are Pink, Gray, White. PowerPoint presentation experts tell us our 7 steps coverging arrows process pathway Network Software PowerPoint Slide are Upbeat. The feedback we get is that our Gist PowerPoint templates and PPT Slides are Splendid. Presenters tell us our 7 steps coverging arrows process pathway Network Software PowerPoint Slide are Spiffy. Presenters tell us our Flow PowerPoint templates and PPT Slides are Breathtaking. Professionals tell us our 7 steps coverging arrows process pathway Network Software PowerPoint Slide are second to none. The feedback we get is that our Expand PowerPoint templates and PPT Slides are Upbeat. Our 7 Steps Coverging Arrows Process Pathway Network Software PowerPoint Slide afford you different approaches. Cope with constantly changing demands.
Graph With America Flag Americana PowerPoint Templates And PowerPoint Backgrounds 0711
Microsoft PowerPoint Template and Background with bar chart and rippled american flag with currency Exhort your team with our Graph With America Flag Americana PowerPoint Templates And PowerPoint Backgrounds 0711. Urge them on to go one better.


 Continue with Email

 Home
Home


