Waterfall Chart
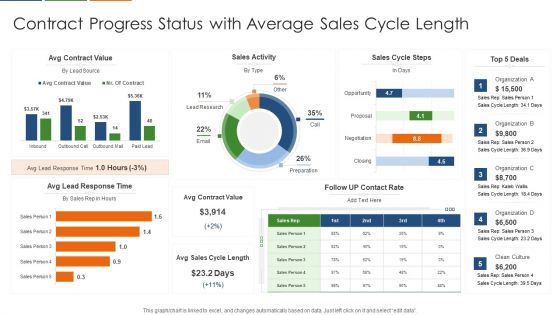
Contract Progress Status With Average Sales Cycle Length Topics PDF
Pitch your topic with ease and precision using this Contract Progress Status With Average Sales Cycle Length Topics PDF This layout presents information on Contract Value, Sales Activity, Sales Cycle It is also available for immediate download and adjustment. So, changes can be made in the color, design, graphics or any other component to create a unique layout.
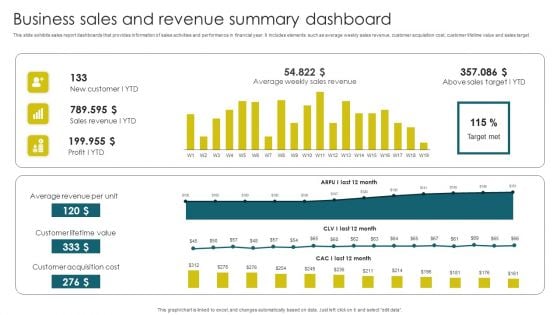
Business Sales And Revenue Summary Dashboard Brochure PDF
This slide exhibits sales report dashboards that provides information of sales activities and performance in financial year. It includes elements such as average weekly sales revenue, customer acquisition cost, customer lifetime value and sales target. Pitch your topic with ease and precision using this Business Sales And Revenue Summary Dashboard Brochure PDF. This layout presents information on Average Revenue, Customer Lifetime, Customer Acquisition. It is also available for immediate download and adjustment. So, changes can be made in the color, design, graphics or any other component to create a unique layout.
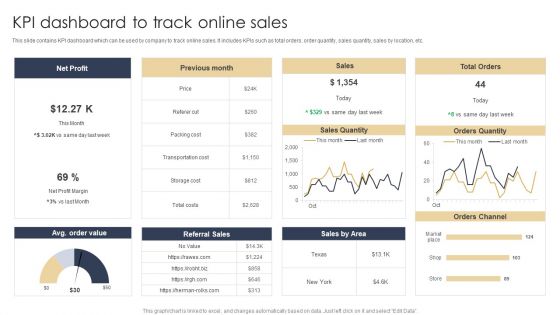
KPI Dashboard To Track Online Sales Structure PDF
This slide contains KPI dashboard which can be used by company to track online sales. It includes KPIs such as total orders, order quantity, sales quantity, sales by location, etc. Pitch your topic with ease and precision using this KPI Dashboard To Track Online Sales Structure PDF. This layout presents information on Net Profit, Sales, Orders Quantity. It is also available for immediate download and adjustment. So, changes can be made in the color, design, graphics or any other component to create a unique layout.
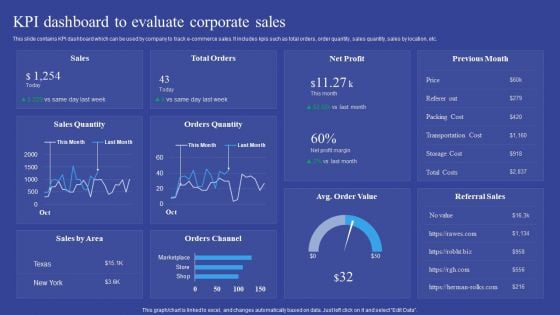
KPI Dashboard To Evaluate Corporate Sales Introduction PDF
This slide contains KPI dashboard which can be used by company to track e-commerce sales. It includes kpis such as total orders, order quantity, sales quantity, sales by location, etc. Pitch your topic with ease and precision using this KPI Dashboard To Evaluate Corporate Sales Introduction PDF. This layout presents information on KPI Dashboard, Evaluate Corporate Sales. It is also available for immediate download and adjustment. So, changes can be made in the color, design, graphics or any other component to create a unique layout.
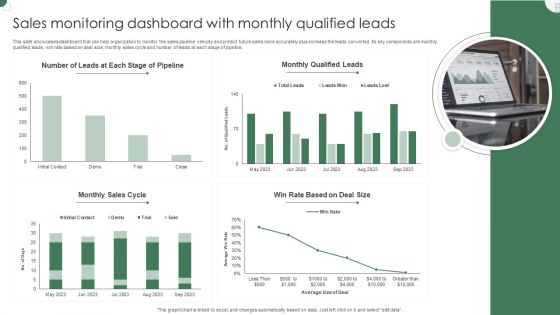
Sales Monitoring Dashboard With Monthly Qualified Leads Guidelines PDF
This slide showcases dashboard that can help organization to monitor the sales pipeline velocity and predict future sales more accurately plus increase the leads converted. Its key components are monthly qualified leads, win rate based on deal size, monthly sales cycle and number of leads at each stage of pipeline. Pitch your topic with ease and precision using this Sales Monitoring Dashboard With Monthly Qualified Leads Guidelines PDF. This layout presents information on Monthly Qualified, Monthly Sales Cycle, Deal Size. It is also available for immediate download and adjustment. So, changes can be made in the color, design, graphics or any other component to create a unique layout.
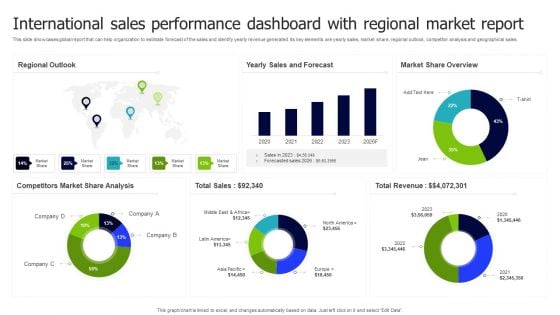
International Sales Performance Dashboard With Regional Market Report Inspiration PDF
This slide showcases global report that can help organization to estimate forecast of the sales and identify yearly revenue generated. Its key elements are yearly sales, market share, regional outlook, competitor analysis and geographical sales. Pitch your topic with ease and precision using this International Sales Performance Dashboard With Regional Market Report Inspiration PDF. This layout presents information on Regional Outlook, Sales And Forecast, Market Share Overview. It is also available for immediate download and adjustment. So, changes can be made in the color, design, graphics or any other component to create a unique layout.
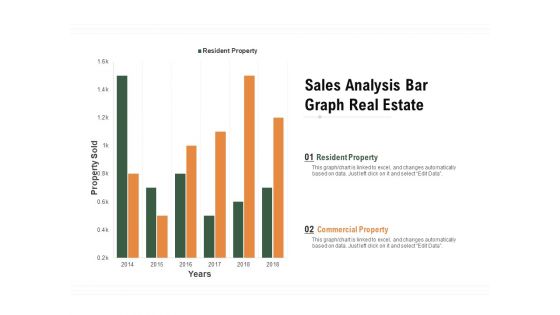
Sales Analysis Bar Graph Real Estate Ppt PowerPoint Presentation Infographic Template Show PDF
Pitch your topic with ease and precision using this sales analysis bar graph real estate ppt powerpoint presentation infographic template show pdf. This layout presents information on resident property, commercial property, property sold, 2014 to 2018. It is also available for immediate download and adjustment. So, changes can be made in the color, design, graphics or any other component to create a unique layout.
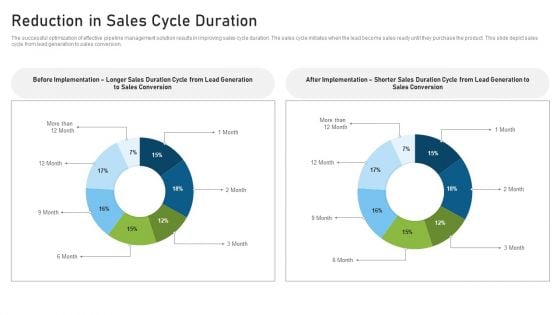
CRM Pipeline Administration Reduction In Sales Cycle Duration Formats PDF
The successful optimization of effective pipeline management solution results in improving sales cycle duration. The sales cycle initiates when the lead become sales ready until they purchase the product. This slide depict sales cycle from lead generation to sales conversion. Take your projects to the next level with our ultimate collection of CRM Pipeline Administration Reduction In Sales Cycle Duration Formats PDF. Slidegeeks has designed a range of layouts that are perfect for representing task or activity duration, keeping track of all your deadlines at a glance. Tailor these designs to your exact needs and give them a truly corporate look with your own brand colors theyll make your projects stand out from the rest.
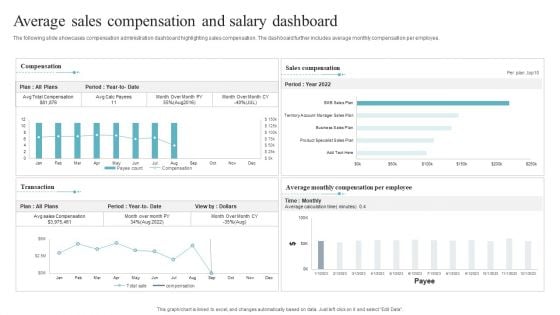
Average Sales Compensation And Salary Dashboard Introduction PDF
The following slide showcases compensation administration dashboard highlighting sales compensation. The dashboard further includes average monthly compensation per employee. Pitch your topic with ease and precision using this Average Sales Compensation And Salary Dashboard Introduction PDF. This layout presents information on Salary Dashboard, Average Sales Compensation. It is also available for immediate download and adjustment. So, changes can be made in the color, design, graphics or any other component to create a unique layout.
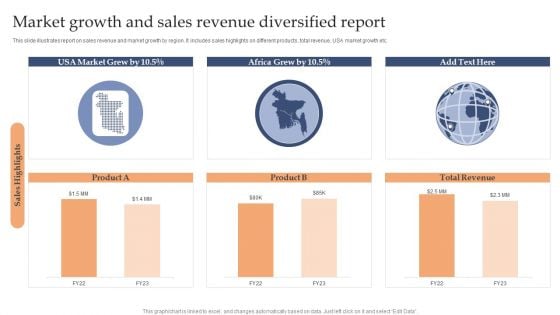
Market Growth And Sales Revenue Diversified Report Sample PDF
This slide illustrates report on sales revenue and market growth by region. It includes sales highlights on different products, total revenue, USA market growth etc.Pitch your topic with ease and precision using this Market Growth And Sales Revenue Diversified Report Sample PDF. This layout presents information on Market Grew, Africa Grew, Total Revenue. It is also available for immediate download and adjustment. So, changes can be made in the color, design, graphics or any other component to create a unique layout.
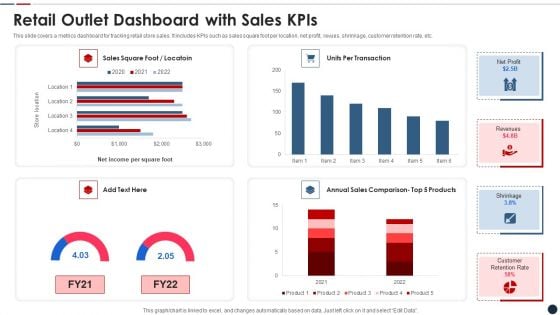
Retail Outlet Dashboard With Sales Kpis Clipart PDF
This slide covers a metrics dashboard for tracking retail store sales. It includes KPIs such as sales square foot per location, net profit, revues, shrinkage, customer retention rate, etc. Pitch your topic with ease and precision using this retail outlet dashboard with sales kpis clipart pdf This layout presents information on Retail outlet dashboard with sales kpis It is also available for immediate download and adjustment. So, changes can be made in the color, design, graphics or any other component to create a unique layout.
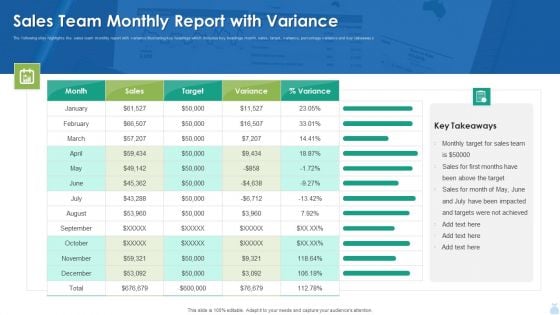
Sales Team Monthly Report With Variance Background PDF
The following slide highlights the sales team monthly report with variance illustrating key headings which includes key headings month, sales, target, variance, percentage variance and key takeaways. Pitch your topic with ease and precision using this Sales Team Monthly Report With Variance Background PDF. This layout presents information on Sales Team Monthly Report With Variance Background PDF. It is also available for immediate download and adjustment. So, changes can be made in the color, design, graphics or any other component to create a unique layout.

Manufactured Products Sales Performance Monitoring Dashboard Information PDF
This slide shows the dashboard the data related to the sales performance of the products manufactured by the organization in order to effectively measure and monitor the performance of the sales team. It shows details related to revenue generated and units sold etc.Pitch your topic with ease and precision using this Manufactured Products Sales Performance Monitoring Dashboard Information PDF. This layout presents information on Monthly Revenue, Manufactured Products, Sales Performance Monitoring. It is also available for immediate download and adjustment. So, changes can be made in the color, design, graphics or any other component to create a unique layout.
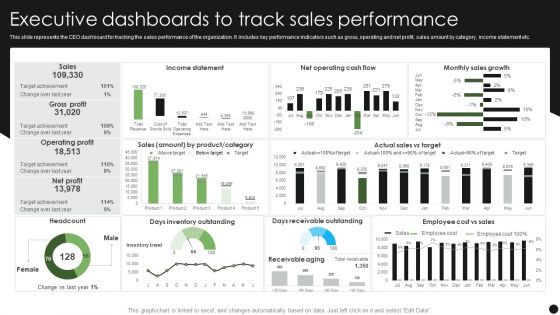
Executive Dashboards To Track Sales Performance Guidelines PDF
This slide represents the CEO dashboard for tracking the sales performance of the organization. It includes key performance indicators such as gross, operating and net profit, sales amount by category, income statement etc. Pitch your topic with ease and precision using this Executive Dashboards To Track Sales Performance Guidelines PDF. This layout presents information on Income Statement, Monthly Sales Growth, Days Receivable Outstanding. It is also available for immediate download and adjustment. So, changes can be made in the color, design, graphics or any other component to create a unique layout.
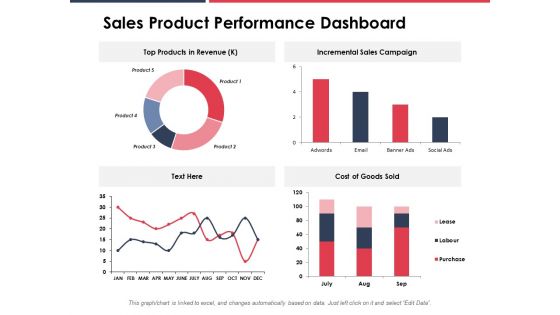
Sales Product Performance Dashboard Ppt PowerPoint Presentation Gallery Background
Presenting this set of slides with name sales product performance dashboard ppt powerpoint presentation gallery background. The topics discussed in these slides are sales, performance, revenue, incremental, social. This is a completely editable PowerPoint presentation and is available for immediate download. Download now and impress your audience.
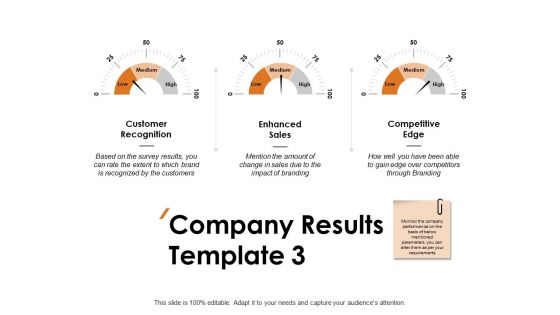
Company Results Sales Ppt PowerPoint Presentation Ideas Examples
Presenting this set of slides with name company results sales ppt powerpoint presentation ideas examples. The topics discussed in these slides are customer recognition, enhanced sales, competitive edge. This is a completely editable PowerPoint presentation and is available for immediate download. Download now and impress your audience.
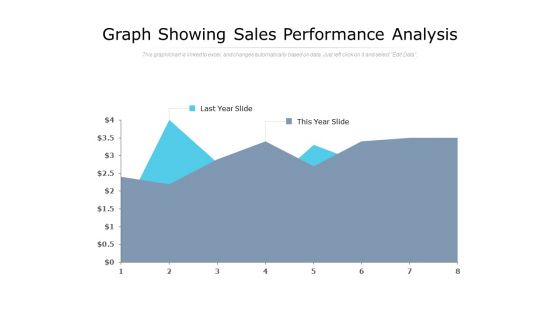
Graph Showing Sales Performance Analysis Ppt PowerPoint Presentation Professional Information
Presenting this set of slides with name graph showing sales performance analysis ppt powerpoint presentation professional information. The topics discussed in these slide is graph showing sales performance analysis. This is a completely editable PowerPoint presentation and is available for immediate download. Download now and impress your audience.
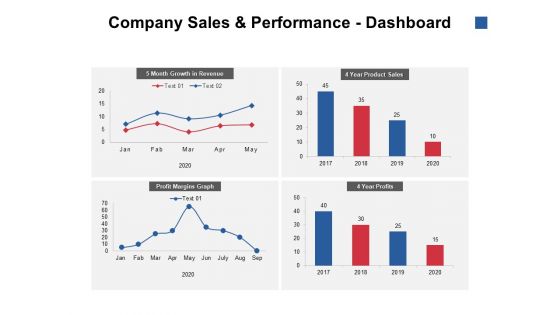
Company Sales And Performance Dashboard Ppt PowerPoint Presentation Inspiration Gallery
Presenting this set of slides with name company sales and performance dashboard ppt powerpoint presentation inspiration gallery. The topics discussed in these slides are month growth in revenue, product sales, profit margins graph . This is a completely editable PowerPoint presentation and is available for immediate download. Download now and impress your audience.
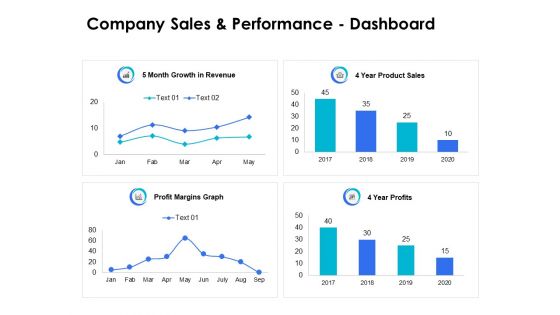
Company Sales And Performance Dashboard Ppt PowerPoint Presentation Inspiration Skills
Presenting this set of slides with name company sales and performance dashboard ppt powerpoint presentation inspiration skills. The topics discussed in these slides are growth revenue, product sales, profits. This is a completely editable PowerPoint presentation and is available for immediate download. Download now and impress your audience.
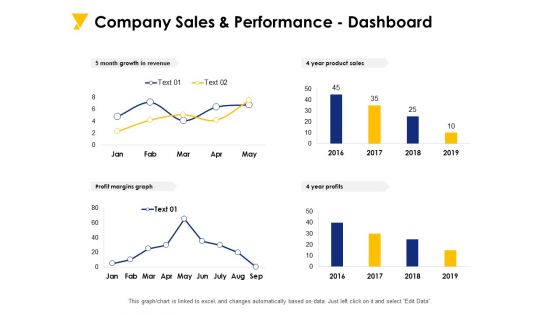
Company Sales And Performance Dashboard Ppt PowerPoint Presentation Model Ideas
Presenting this set of slides with name company sales and performance dashboard ppt powerpoint presentation model ideas. The topics discussed in these slides are 5 month growth in revenue, 4 year product sales, profit margins graph, 4 year profits . This is a completely editable PowerPoint presentation and is available for immediate download. Download now and impress your audience.
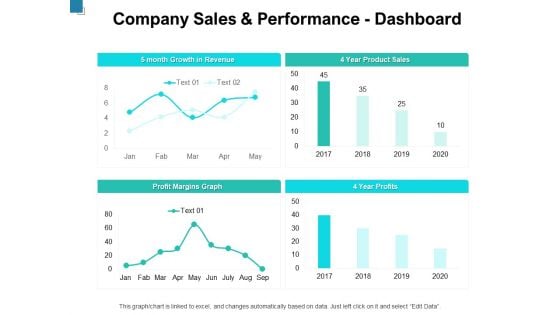
Company Sales And Performance Dashboard Ppt PowerPoint Presentation Slides Background
Presenting this set of slides with name company sales and performance dashboard ppt powerpoint presentation slides background. The topics discussed in these slides are 5 month growth in revenue, 4 year product sales, profit margins graph, 4 year profits. This is a completely editable PowerPoint presentation and is available for immediate download. Download now and impress your audience.
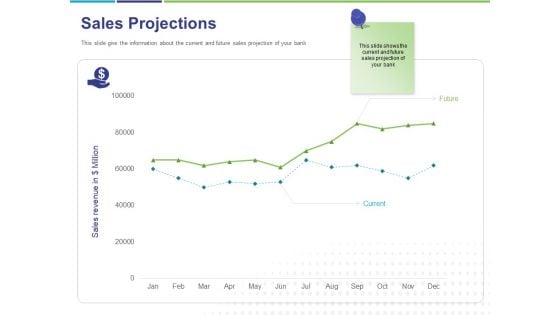
Commodity Up Selling Sales Projections Ppt Model Sample PDF
Presenting this set of slides with name commodity up selling sales projections ppt model sample pdf. The topics discussed in these slides are sales revenue. This is a completely editable PowerPoint presentation and is available for immediate download. Download now and impress your audience.
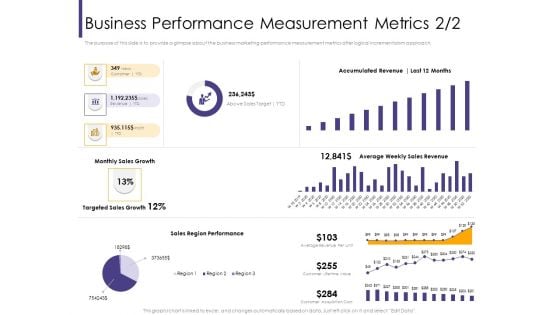
Progressive Business Performance Measurement Metrics Sales Ppt Pictures Guidelines PDF
Presenting this set of slides with name progressive business performance measurement metrics sales ppt pictures guidelines pdf. The topics discussed in these slides are sales, growth, targeted, revenue, performance. This is a completely editable PowerPoint presentation and is available for immediate download. Download now and impress your audience.
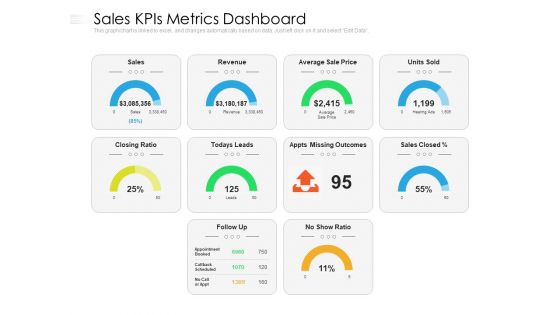
Sales Kpis Metrics Dashboard Ppt PowerPoint Presentation Gallery Demonstration PDF
Presenting this set of slides with name sales kpis metrics dashboard ppt powerpoint presentation gallery demonstration pdf. The topics discussed in these slides are sales, revenue, price. This is a completely editable PowerPoint presentation and is available for immediate download. Download now and impress your audience.
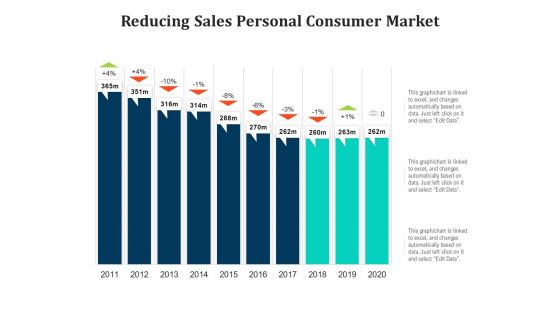
Reducing Sales Personal Consumer Market Ppt PowerPoint Presentation Portfolio
Pitch your topic with ease and precision using this reducing sales personal consumer market ppt powerpoint presentation portfolio. This layout presents information on reducing sales personal consumer market, 2011 to 2020. It is also available for immediate download and adjustment. So, changes can be made in the color, design, graphics or any other component to create a unique layout.
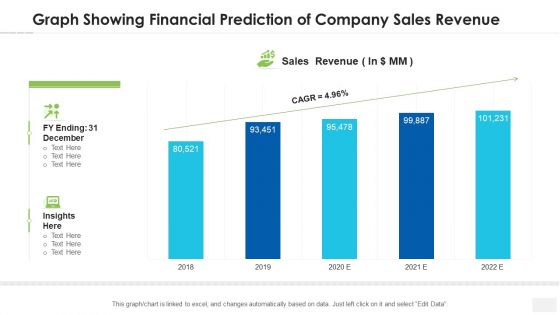
Graph Showing Financial Prediction Of Company Sales Revenue Topics PDF
Pitch your topic with ease and precision using this graph showing financial prediction of company sales revenue topics pdf. This layout presents information on graph showing financial prediction of company sales revenue. It is also available for immediate download and adjustment. So, changes can be made in the color, design, graphics or any other component to create a unique layout.
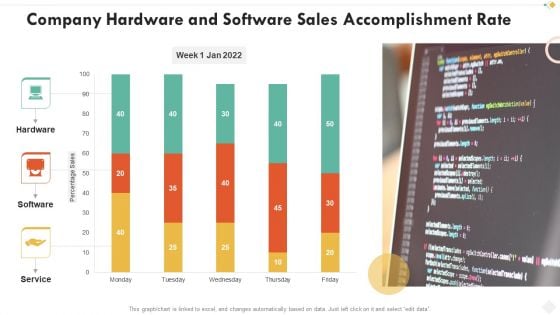
Company Hardware And Software Sales Accomplishment Rate Rules PDF
Pitch your topic with ease and precision using this company hardware and software sales accomplishment rate rules pdf. This layout presents information on company hardware and software sales accomplishment rate. It is also available for immediate download and adjustment. So, changes can be made in the color, design, graphics or any other component to create a unique layout.
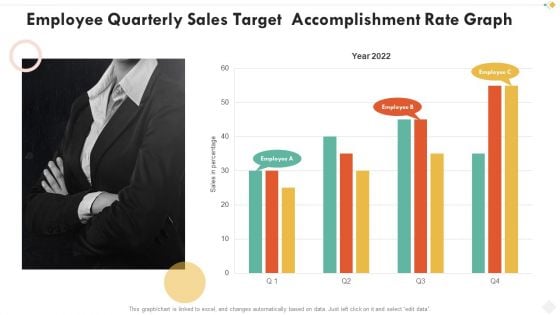
Employee Quarterly Sales Target Accomplishment Rate Graph Demonstration PDF
Pitch your topic with ease and precision using this employee quarterly sales target accomplishment rate graph demonstration pdf. This layout presents information on employee quarterly sales target accomplishment rate graph. It is also available for immediate download and adjustment. So, changes can be made in the color, design, graphics or any other component to create a unique layout.
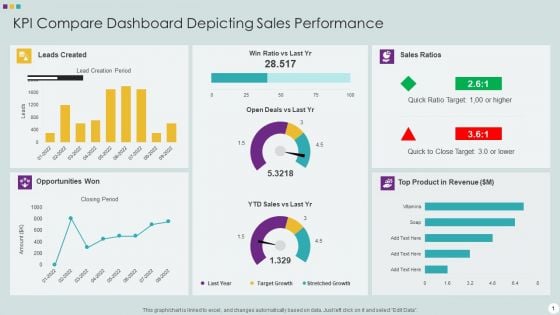
KPI Compare Dashboard Depicting Sales Performance Summary PDF
Pitch your topic with ease and precision using this KPI Compare Dashboard Depicting Sales Performance Summary PDF This layout presents information on KPI Compare Dashboard Depicting Sales Performance It is also available for immediate download and adjustment. So, changes can be made in the color, design, graphics or any other component to create a unique layout.
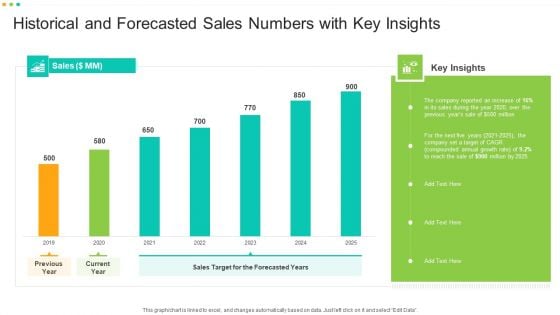
Historical And Forecasted Sales Numbers With Key Insights Information PDF
Pitch your topic with ease and precision using this Historical And Forecasted Sales Numbers With Key Insights Information PDF. This layout presents information on Historical And Forecasted Sales Numbers With Key Insights. It is also available for immediate download and adjustment. So, changes can be made in the color, design, graphics or any other component to create a unique layout.
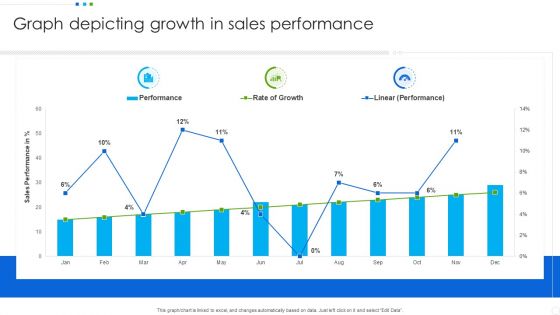
Graph Depicting Growth In Sales Performance Professional PDF
Pitch your topic with ease and precision using this Graph Depicting Growth In Sales Performance Professional PDF. This layout presents information on Graph Depicting, Sales Performance. It is also available for immediate download and adjustment. So, changes can be made in the color, design, graphics or any other component to create a unique layout.
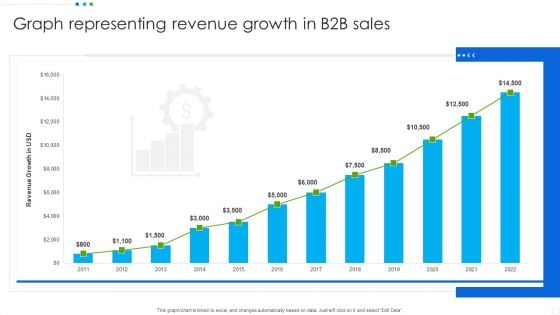
Graph Representing Revenue Growth In B2b Sales Background PDF
Pitch your topic with ease and precision using this Graph Representing Revenue Growth In B2b Sales Background PDF. This layout presents information on Graph Representing, Revenue Growth, Sales. It is also available for immediate download and adjustment. So, changes can be made in the color, design, graphics or any other component to create a unique layout.
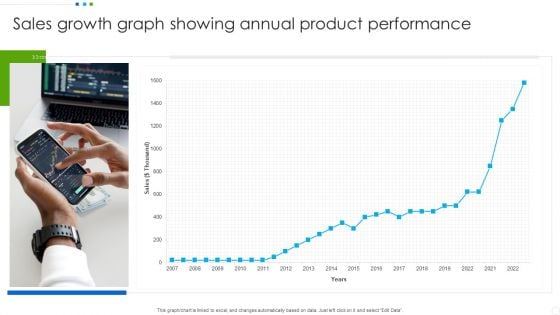
Sales Growth Graph Showing Annual Product Performance Slides PDF
Pitch your topic with ease and precision using this Sales Growth Graph Showing Annual Product Performance Slides PDF. This layout presents information on Sales Growth, Product Performance. It is also available for immediate download and adjustment. So, changes can be made in the color, design, graphics or any other component to create a unique layout.
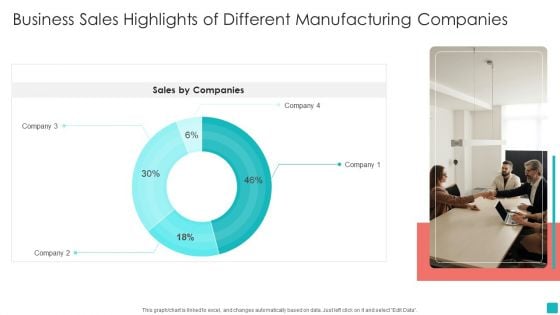
Business Sales Highlights Of Different Manufacturing Companies Demonstration PDF
Pitch your topic with ease and precision using this Business Sales Highlights Of Different Manufacturing Companies Demonstration PDF. This layout presents information on Business Sales Highlights, Different Manufacturing Companies. It is also available for immediate download and adjustment. So, changes can be made in the color, design, graphics or any other component to create a unique layout.
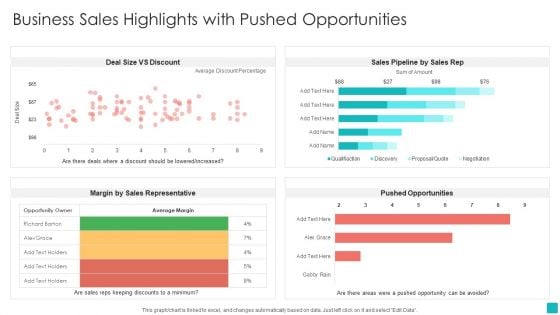
Business Sales Highlights With Pushed Opportunities Infographics PDF
Pitch your topic with ease and precision using this Business Sales Highlights With Pushed Opportunities Infographics PDF. This layout presents information on Business Sales Highlights, Pushed Opportunities. It is also available for immediate download and adjustment. So, changes can be made in the color, design, graphics or any other component to create a unique layout.
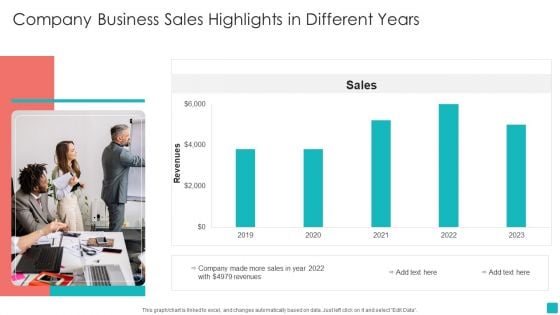
Company Business Sales Highlights In Different Years Clipart PDF
Pitch your topic with ease and precision using this Company Business Sales Highlights In Different Years Clipart PDF. This layout presents information on Company Business Sales Highlights, Revenues. It is also available for immediate download and adjustment. So, changes can be made in the color, design, graphics or any other component to create a unique layout.
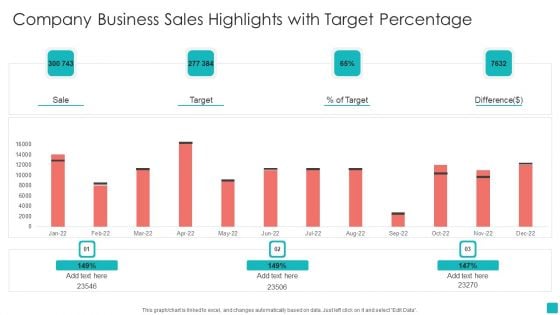
Company Business Sales Highlights With Target Percentage Background PDF
Pitch your topic with ease and precision using this Company Business Sales Highlights With Target Percentage Background PDF. This layout presents information on Company Business Sales Highlights, Target Percentage. It is also available for immediate download and adjustment. So, changes can be made in the color, design, graphics or any other component to create a unique layout.
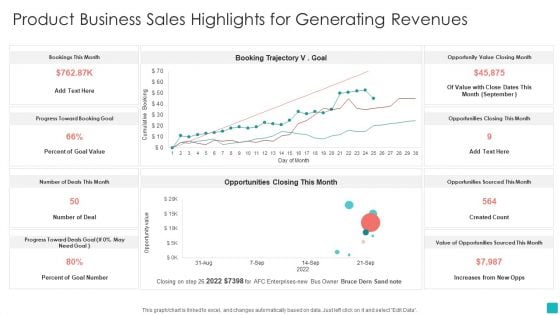
Product Business Sales Highlights For Generating Revenues Demonstration PDF
Pitch your topic with ease and precision using this Product Business Sales Highlights For Generating Revenues Demonstration PDF. This layout presents information on Product Business Sales Highlights, Generating Revenues. It is also available for immediate download and adjustment. So, changes can be made in the color, design, graphics or any other component to create a unique layout.
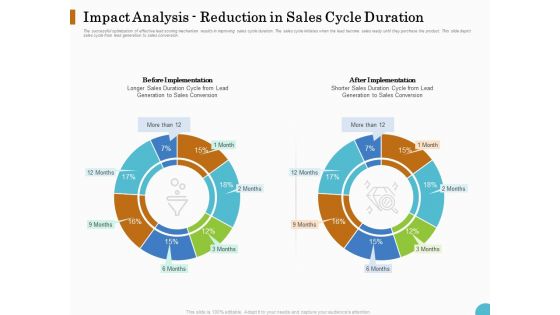
Lead Ranking Sales Methodology Model Impact Analysis Reduction In Sales Cycle Duration Ppt PowerPoint Presentation Slides Layout PDF
Presenting this set of slides with name lead ranking sales methodology model impact analysis reduction in sales cycle duration ppt powerpoint presentation slides layout pdf. The topics discussed in these slides are before implementation, after implementation, sales conversion, lead generation. This is a completely editable PowerPoint presentation and is available for immediate download. Download now and impress your audience.
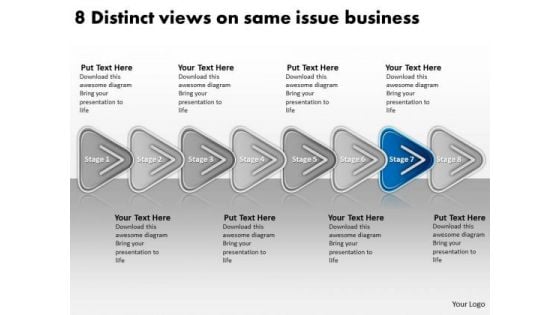
Same Issue New Business PowerPoint Presentation Chiropractic Plan Templates
We present our same issue new business powerpoint presentation chiropractic plan templates.Present our Flow charts PowerPoint Templates because it demonstrates to your audience how the best and most refined ideas pass through. Use our Process and Flows PowerPoint Templates because you are the star of your enlightened team. Use our Business PowerPoint Templates because you can Lead your flock steadily to greater heights. Look around at the vast potential of achievement around you. Present our Marketing PowerPoint Templates because The marketplace is the merger of your dreams and your ability. Download and present our Arrows PowerPoint Templates because it builds on your foundation or prepares for change ahead to enhance the future.Use these PowerPoint slides for presentations relating to Analyst, arrows, bar, blue, business, chart,decrease, diagram, down, economic, fall, figures, finance, financial, flow, forecast, graph, illustration, investment, line, loss, lost, marketing, measure, misfortune, prediction, report, results, sales, statistics. The prominent colors used in the PowerPoint template are White, Black, Blue. The feedback we get is that our same issue new business powerpoint presentation chiropractic plan templates are visually appealing. The feedback we get is that our diagram PowerPoint templates and PPT Slides are aesthetically designed to attract attention. We guarantee that they will grab all the eyeballs you need. People tell us our same issue new business powerpoint presentation chiropractic plan templates are Bright. We assure you our decrease PowerPoint templates and PPT Slides are Sparkling. We assure you our same issue new business powerpoint presentation chiropractic plan templates are aesthetically designed to attract attention. We guarantee that they will grab all the eyeballs you need. The feedback we get is that our chart PowerPoint templates and PPT Slides are Dazzling. Customise your Same Issue New Business PowerPoint Presentation Chiropractic Plan Templates as per your choice. Discover that they are amenable and adaptive.
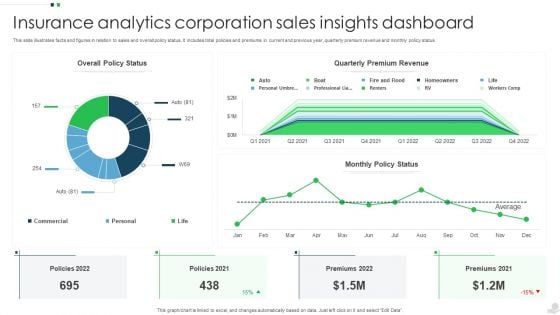
Insurance Analytics Corporation Sales Insights Dashboard Structure PDF
This slide illustrates facts and figures in relation to sales and overall policy status. It includes total policies and premiums in current and previous year, quarterly premium revenue and monthly policy status. Pitch your topic with ease and precision using this Insurance Analytics Corporation Sales Insights Dashboard Structure PDF. This layout presents information on Quarterly Premium Revenue, Sales Insights Dashboard, Insurance Analytics Corporation. It is also available for immediate download and adjustment. So, changes can be made in the color, design, graphics or any other component to create a unique layout.
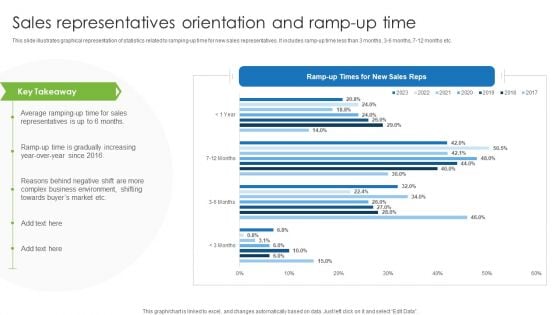
Sales Representatives Orientation And Ramp Up Time Summary PDF
This slide illustrates graphical representation of statistics related to ramping up time for new sales representatives. It includes ramp up time less than 3 months, 3 6 months, 7 12 months etc. Pitch your topic with ease and precision using this Sales Representatives Orientation And Ramp Up Time Summary PDF. This layout presents information on Sales Representatives Orientation, Ramp Up Time. It is also available for immediate download and adjustment. So, changes can be made in the color, design, graphics or any other component to create a unique layout.
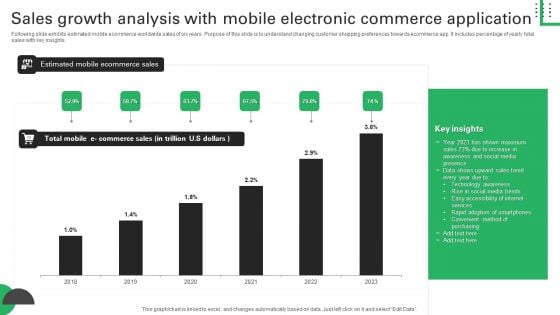
Sales Growth Analysis With Mobile Electronic Commerce Application Structure PDF
Following slide exhibits estimated mobile ecommerce worldwide sales of six years. Purpose of this slide is to understand changing customer shopping preferences towards ecommerce app. It includes percentage of yearly total sales with key insights. Pitch your topic with ease and precision using this Sales Growth Analysis With Mobile Electronic Commerce Application Structure PDF. This layout presents information on Shown Maximum, Awareness Social Media, Accessibility Internet. It is also available for immediate download and adjustment. So, changes can be made in the color, design, graphics or any other component to create a unique layout.
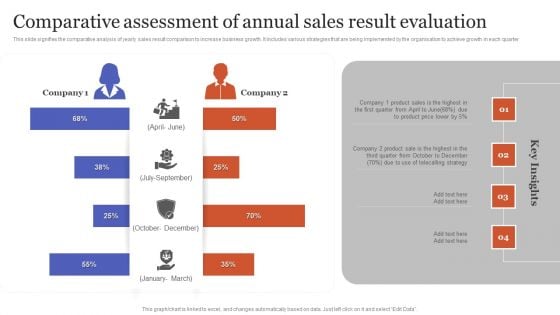
Comparative Assessment Of Annual Sales Result Evaluation Elements PDF
This slide signifies the comparative analysis of yearly sales result comparison to increase business growth. It includes various strategies that are being implemented by the organisation to achieve growth in each quarter Pitch your topic with ease and precision using this Comparative Assessment Of Annual Sales Result Evaluation Elements PDF. This layout presents information on Telecalling Strategy, Product Sales, Product Lower. It is also available for immediate download and adjustment. So, changes can be made in the color, design, graphics or any other component to create a unique layout.
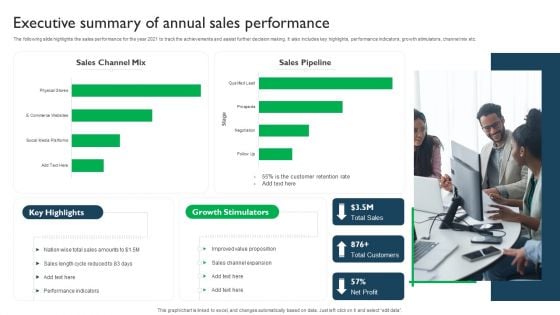
Executive Summary Of Annual Sales Performance Topics PDF
The following slide highlights the sales performance for the year 2021 to track the achievements and assist further decision making. It also includes key highlights, performance indicators, growth stimulators, channel mix etc. Pitch your topic with ease and precision using this Executive Summary Of Annual Sales Performance Topics PDF. This layout presents information on Growth Stimulators, Sales, Value Proposition. It is also available for immediate download and adjustment. So, changes can be made in the color, design, graphics or any other component to create a unique layout.
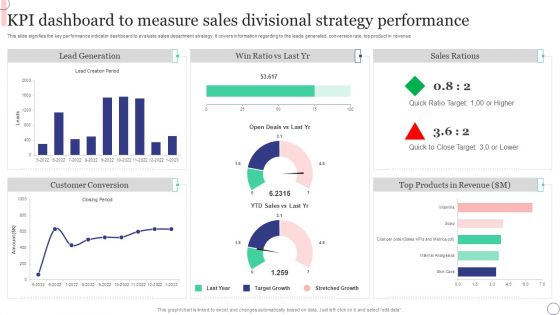
KPI Dashboard To Measure Sales Divisional Strategy Performance Microsoft PDF
This slide signifies the key performance indicator dashboard to evaluate sales department strategy. It covers information regarding to the leads generated, conversion rate, top product in revenue. Pitch your topic with ease and precision using this KPI Dashboard To Measure Sales Divisional Strategy Performance Microsoft PDF. This layout presents information on Sales Rations, Lead Generation, Customer Conversion. It is also available for immediate download and adjustment. So, changes can be made in the color, design, graphics or any other component to create a unique layout.
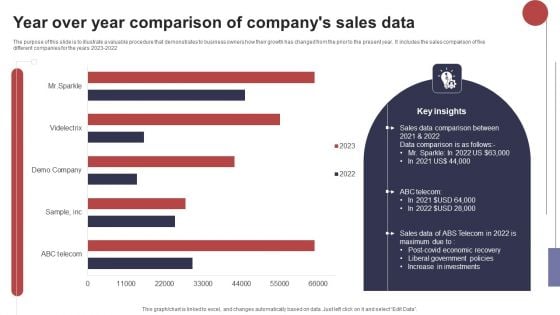
Year Over Year Comparison Of Companys Sales Data Microsoft PDF
The purpose of this slide is to illustrate a valuable procedure that demonstrates to business owners how their growth has changed from the prior to the present year. It includes the sales comparison of five different companies for the years 2023 2022. Pitch your topic with ease and precision using this Year Over Year Comparison Of Companys Sales Data Microsoft PDF. This layout presents information on Sales Data Comparison, Liberal Government, Increase Investments. It is also available for immediate download and adjustment. So, changes can be made in the color, design, graphics or any other component to create a unique layout.
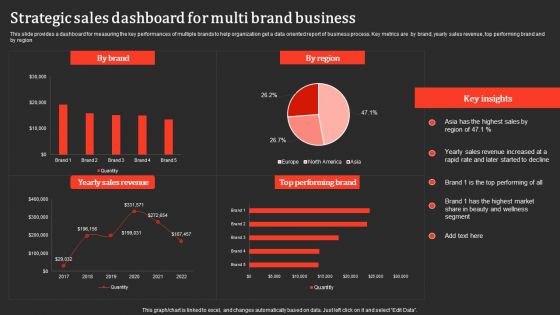
Strategic Sales Dashboard For Multi Brand Business Professional PDF
This slide provides a dashboard for measuring the key performances of multiple brands to help organization get a data oriented report of business process. Key metrics are by brand, yearly sales revenue, top performing brand and by region. Pitch your topic with ease and precision using this Strategic Sales Dashboard For Multi Brand Business Professional PDF. This layout presents information on Yearly Sales Revenue, Performing Brand. It is also available for immediate download and adjustment. So, changes can be made in the color, design, graphics or any other component to create a unique layout.
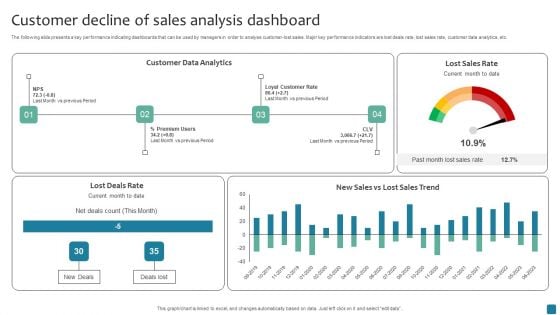
Customer Decline Of Sales Analysis Dashboard Rules PDF
The following slide presents a key performance indicating dashboards that can be used by managers in order to analyse customer-lost sales. Major key performance indicators are lost deals rate, lost sales rate, customer data analytics, etc. Pitch your topic with ease and precision using this Customer Decline Of Sales Analysis Dashboard Rules PDF. This layout presents information on Customer Data Analytics. It is also available for immediate download and adjustment. So, changes can be made in the color, design, graphics or any other component to create a unique layout.
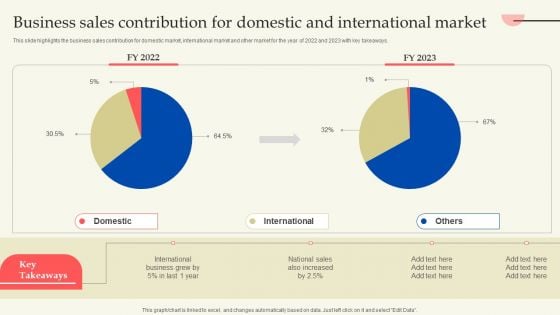
Business Sales Contribution For Domestic And International Market Portrait PDF
This slide highlights the business sales contribution for domestic market, international market and other market for the year of 2022 and 2023 with key takeaways. Presenting this PowerPoint presentation, titled Business Sales Contribution For Domestic And International Market Portrait PDF, with topics curated by our researchers after extensive research. This editable presentation is available for immediate download and provides attractive features when used. Download now and captivate your audience. Presenting this Business Sales Contribution For Domestic And International Market Portrait PDF. Our researchers have carefully researched and created these slides with all aspects taken into consideration. This is a completely customizable Business Sales Contribution For Domestic And International Market Portrait PDF that is available for immediate downloading. Download now and make an impact on your audience. Highlight the attractive features available with our PPTs.
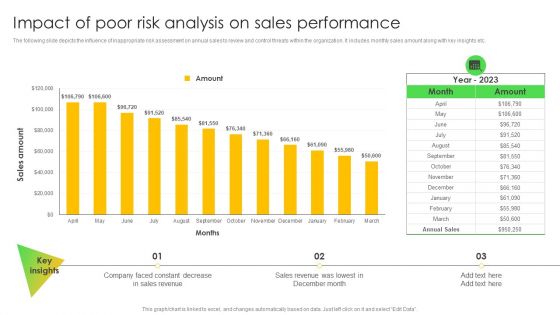
Impact Of Poor Risk Analysis On Sales Performance Information PDF
The following slide depicts the influence of inappropriate risk assessment on annual sales to review and control threats within the organization. It includes monthly sales amount along with key insights etc. Do you have an important presentation coming up Are you looking for something that will make your presentation stand out from the rest Look no further than Impact Of Poor Risk Analysis On Sales Performance Information PDF. With our professional designs, you can trust that your presentation will pop and make delivering it a smooth process. And with Slidegeeks, you can trust that your presentation will be unique and memorable. So why wait Grab Impact Of Poor Risk Analysis On Sales Performance Information PDF today and make your presentation stand out from the rest.
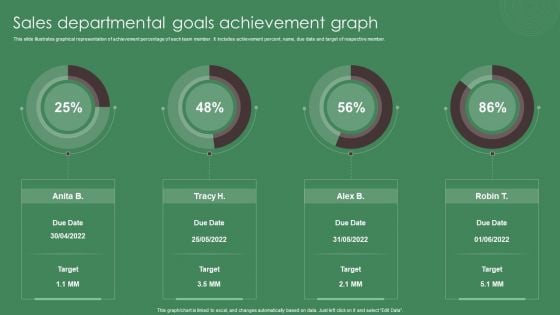
Sales Departmental Goals Achievement Graph Ppt Inspiration Slide Download PDF
This slide illustrates graphical representation of achievement percentage of each team member. It includes achievement percent, name, due date and target of respective member. Pitch your topic with ease and precision using this Sales Departmental Goals Achievement Graph Ppt Inspiration Slide Download PDF. This layout presents information on Sales Departmental, Goals, Achievement Graph. It is also available for immediate download and adjustment. So, changes can be made in the color, design, graphics or any other component to create a unique layout.
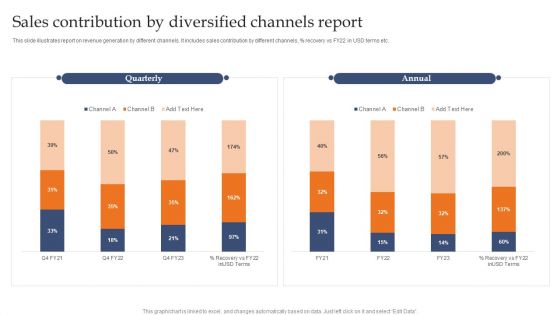
Sales Contribution By Diversified Channels Report Demonstration PDF
This slide illustrates report on revenue generation by different channels. It includes sales contribution by different channels, precent recovery vs FY22 in USD terms etc.Pitch your topic with ease and precision using this Sales Contribution By Diversified Channels Report Demonstration PDF. This layout presents information on Quarterly, Annual, Channel. It is also available for immediate download and adjustment. So, changes can be made in the color, design, graphics or any other component to create a unique layout.

Weekly Sales Performance KPI Dashboard For Revenue Generation Brochure PDF
The following slide exhibits dashboard to maintain revenue and management under control. It presents information related to profits, cross selling, costs, etc. Pitch your topic with ease and precision using this Weekly Sales Performance KPI Dashboard For Revenue Generation Brochure PDF. This layout presents information on Total Sales, Revenue, Profit, Cost. It is also available for immediate download and adjustment. So, changes can be made in the color, design, graphics or any other component to create a unique layout.
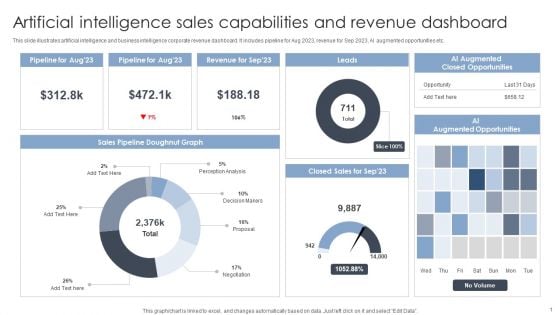
Artificial Intelligence Sales Capabilities And Revenue Dashboard Portrait PDF
This slide illustrates artificial intelligence and business intelligence corporate revenue dashboard. It includes pipeline for Aug 2023, revenue for Sep 2023, AI augmented opportunities etc. Pitch your topic with ease and precision using this Artificial Intelligence Sales Capabilities And Revenue Dashboard Portrait PDF. This layout presents information on Sales Capabilities, Revenue Dashboard. It is also available for immediate download and adjustment. So, changes can be made in the color, design, graphics or any other component to create a unique layout.
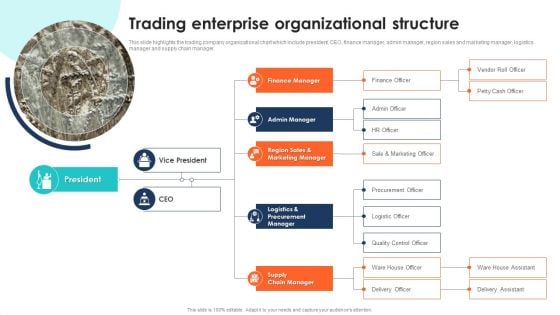
Export Management Company Profile Trading Enterprise Organizational Structure Mockup PDF
This slide highlights the trading company organizational chart which include president, CEO, finance manager, admin manager, region sales and marketing manager, logistics manager and supply chain manager. This is a Export Management Company Profile Trading Enterprise Organizational Structure Mockup PDF template with various stages. Focus and dispense information on four stages using this creative set, that comes with editable features. It contains large content boxes to add your information on topics like Marketing, Financee, Admin Manager, Supply Chain. You can also showcase facts, figures, and other relevant content using this PPT layout. Grab it now.
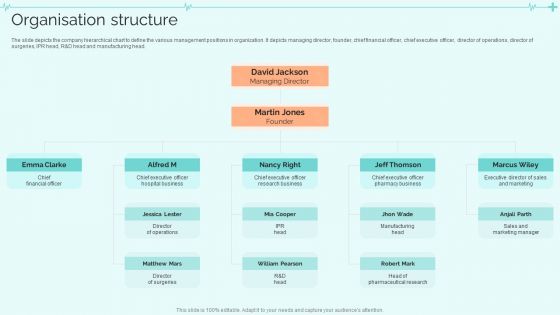
Clinical Services Company Profile Organisation Structure Designs PDF
The slide depicts the company hierarchical chart to define the various management positions in organization. It depicts managing director, founder, chief financial officer, chief executive officer, director of operations, director of surgeries, IPR head, R and D head and manufacturing head. Presenting Clinical Services Company Profile Organisation Structure Designs PDF to provide visual cues and insights. Share and navigate important information on four stages that need your due attention. This template can be used to pitch topics like Chief Executive Officer, Hospital Business, Sales And Marketing Manager. In addtion, this PPT design contains high resolution images, graphics, etc, that are easily editable and available for immediate download.
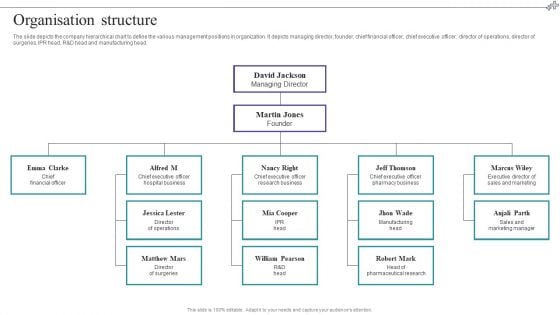
Medical Care Company Overview Organisation Structure Clipart PDF
The slide depicts the company hierarchical chart to define the various management positions in organization. It depicts managing director, founder, chief financial officer, chief executive officer, director of operations, director of surgeries, IPR head, R and D head and manufacturing head. This is a Medical Care Company Overview Organisation Structure Clipart PDF template with various stages. Focus and dispense information on four stages using this creative set, that comes with editable features. It contains large content boxes to add your information on topics like Chief Executive Officer, Research Business, Sales And Marketing. You can also showcase facts, figures, and other relevant content using this PPT layout. Grab it now.
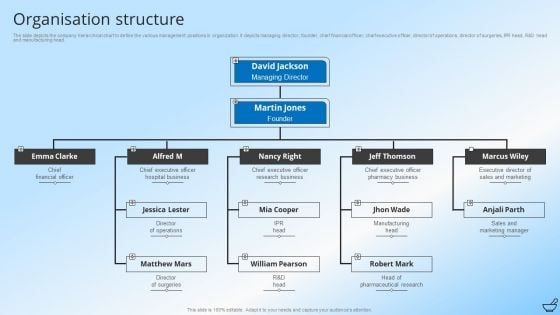
Pharmaceutical And Clinical Research Summary Organisation Structure Infographics PDF
The slide depicts the company hierarchical chart to define the various management positions in organization. It depicts managing director, founder, chief financial officer, chief executive officer, director of operations, director of surgeries, IPR head, R and D head and manufacturing head. This is a Pharmaceutical And Clinical Research Summary Organisation Structure Infographics PDF template with various stages. Focus and dispense information on four stages using this creative set, that comes with editable features. It contains large content boxes to add your information on topics like Sales And Marketing Manager, Manufacturing Head Chief, Financial Officer. You can also showcase facts, figures, and other relevant content using this PPT layout. Grab it now.

Arrows PowerPoint Parallel Executing Sequential Program Templates
We present our arrows powerpoint parallel executing sequential program templates.Download our Arrows PowerPoint Templates because our PowerPoint Templates and Slides will give your ideas the shape. Download and present our Process and Flows PowerPoint Templates because It can Conjure up grand ideas with our magical PowerPoint Templates and Slides. Leave everyone awestruck by the end of your presentation. Download our Flow Charts PowerPoint Templates because Our PowerPoint Templates and Slides are the chords of your song. String them along and provide the lilt to your views. Use our Marketing PowerPoint Templates because Our PowerPoint Templates and Slides come in all colours, shades and hues. They help highlight every nuance of your views. Download our Success PowerPoint Templates because Our PowerPoint Templates and Slides will let your words and thoughts hit bullseye everytime.Use these PowerPoint slides for presentations relating to Abstract, achievement, aim, arrow, blue, business, career, chart, competition, concept, development, direction, education, financial, graph, group, growth, higher, investment, leader, moving, onwards, profit, progress, sales, success, target, team, upwards, vector. The prominent colors used in the PowerPoint template are Green, Gray, White. People tell us our arrows powerpoint parallel executing sequential program templates will generate and maintain the level of interest you desire. They will create the impression you want to imprint on your audience. Presenters tell us our chart PowerPoint templates and PPT Slides are readymade to fit into any presentation structure. Customers tell us our arrows powerpoint parallel executing sequential program templates will impress their bosses and teams. Customers tell us our competition PowerPoint templates and PPT Slides will make the presenter successul in his career/life. Professionals tell us our arrows powerpoint parallel executing sequential program templates have awesome images to get your point across. Use our competition PowerPoint templates and PPT Slides are the best it can get when it comes to presenting. Examine the facts in all their combinations. Run the comb through with our Arrows PowerPoint Parallel Executing Sequential Program Templates.


 Continue with Email

 Home
Home


