Web Analytics
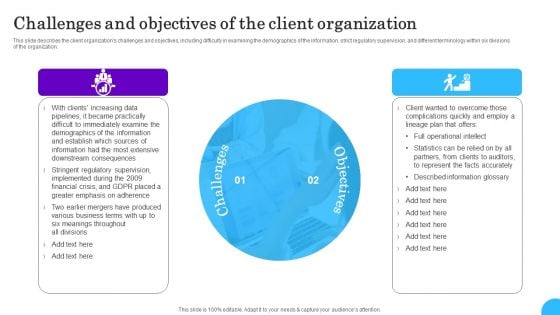
Comprehensive Analysis Of Different Data Lineage Classification Challenges And Objectives Client Themes PDF
This slide describes the client organizations challenges and objectives, including difficulty in examining the demographics of the information, strict regulatory supervision, and different terminology within six divisions of the organization. Get a simple yet stunning designed Comprehensive Analysis Of Different Data Lineage Classification Challenges And Objectives Client Themes PDF. It is the best one to establish the tone in your meetings. It is an excellent way to make your presentations highly effective. So, download this PPT today from Slidegeeks and see the positive impacts. Our easy to edit Comprehensive Analysis Of Different Data Lineage Classification Challenges And Objectives Client Themes PDF can be your go to option for all upcoming conferences and meetings. So, what are you waiting for Grab this template today.
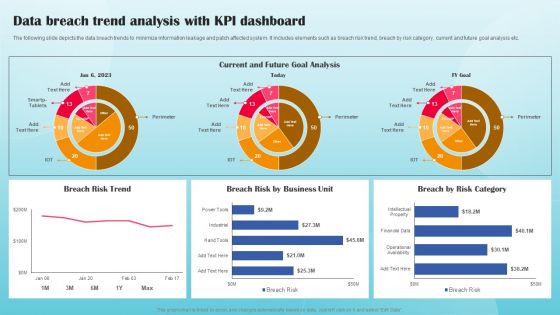
Data Breach Trend Analysis With KPI Dashboard Ppt PowerPoint Presentation File Portfolio PDF
The following slide depicts the data breach trends to minimize information leakage and patch affected system. It includes elements such as breach risk trend, breach by risk category, current and future goal analysis etc. This modern and well arranged Data Breach Trend Analysis With KPI Dashboard Ppt PowerPoint Presentation File Portfolio PDF provides lots of creative possibilities. It is very simple to customize and edit with the Powerpoint Software. Just drag and drop your pictures into the shapes. All facets of this template can be edited with Powerpoint no extra software is necessary. Add your own material, put your images in the places assigned for them, adjust the colors, and then you can show your slides to the world, with an animated slide included.
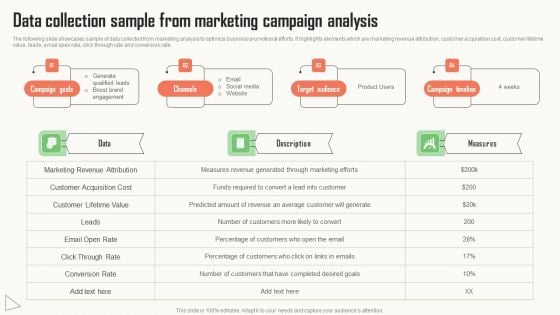
Strategic Market Insight Implementation Guide Data Collection Sample From Marketing Campaign Analysis Formats PDF
The following slide showcases sample of data collected from marketing analysis to optimize business promotional efforts. It highlights elements which are marketing revenue attribution, customer acquisition cost, customer lifetime value, leads, email open rate, click through rate and conversion rate. Present like a pro with Strategic Market Insight Implementation Guide Data Collection Sample From Marketing Campaign Analysis Formats PDF Create beautiful presentations together with your team, using our easy to use presentation slides. Share your ideas in real time and make changes on the fly by downloading our templates. So whether you are in the office, on the go, or in a remote location, you can stay in sync with your team and present your ideas with confidence. With Slidegeeks presentation got a whole lot easier. Grab these presentations today.
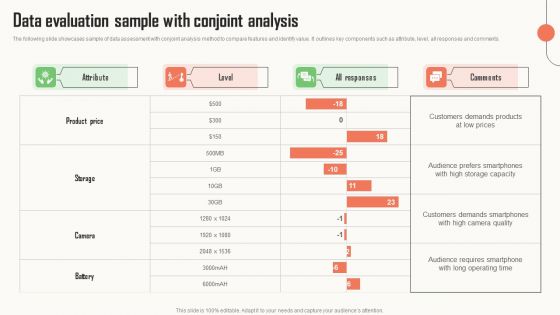
Strategic Market Insight Implementation Guide Data Evaluation Sample With Conjoint Analysis Background PDF
The following slide showcases sample of data assessment with conjoint analysis method to compare features and identify value. It outlines key components such as attribute, level, all responses and comments. Slidegeeks is here to make your presentations a breeze with Strategic Market Insight Implementation Guide Data Evaluation Sample With Conjoint Analysis Background PDF With our easy to use and customizable templates, you can focus on delivering your ideas rather than worrying about formatting. With a variety of designs to choose from, you are sure to find one that suits your needs. And with animations and unique photos, illustrations, and fonts, you can make your presentation pop. So whether you are giving a sales pitch or presenting to the board, make sure to check out Slidegeeks first.
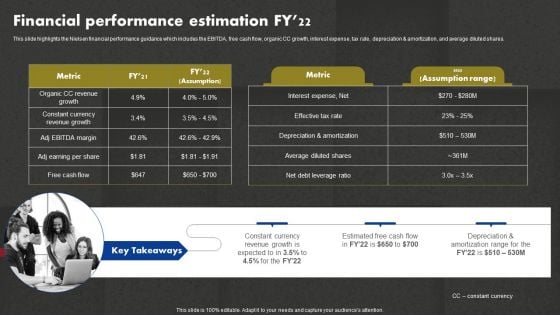
Data And Customer Analysis Company Outline Financial Performance Estimation FY22 Pictures PDF
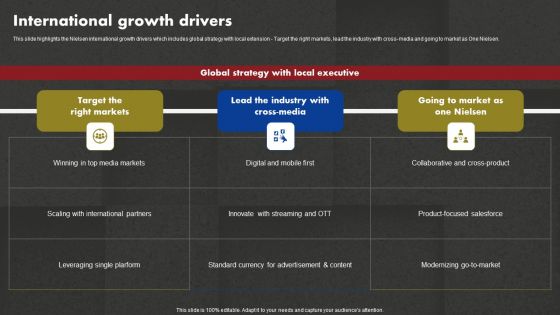
Data And Customer Analysis Company Outline International Growth Drivers Download PDF
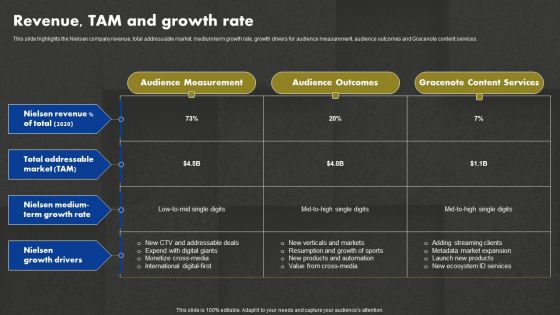
Data And Customer Analysis Company Outline Revenue TAM And Growth Rate Infographics PDF
Data Analysis Reporting Tools Ppt PowerPoint Presentation Professional Layout Cpb Pdf
Presenting this set of slides with name data analysis reporting tools ppt powerpoint presentation professional layout cpb pdf. This is an editable Powerpoint four stages graphic that deals with topics like cyber security detection response to help convey your message better graphically. This product is a premium product available for immediate download and is 100 percent editable in Powerpoint. Download this now and use it in your presentations to impress your audience.
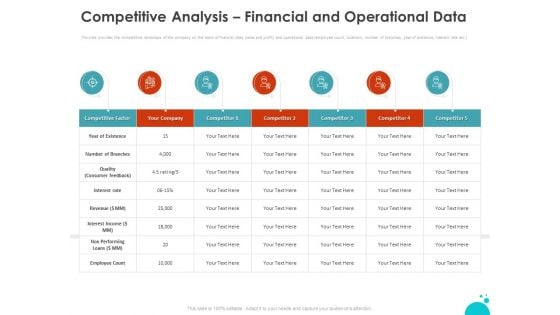
Investment Pitch For Aftermarket Competitive Analysis Financial And Operational Data Ppt PowerPoint Presentation File Structure PDF
Presenting this set of slides with name investment pitch for aftermarket competitive analysis financial and operational data ppt powerpoint presentation file structure pdf. The topics discussed in these slides are competitive factor, competitor, existence, quality consumer feedback, interest rate, revenue, interest income, non performing loans, employee count. This is a completely editable PowerPoint presentation and is available for immediate download. Download now and impress your audience.

Introducing CRM Framework Within Organization CRM Data Analysis Period Ppt Ideas Themes PDF
Presenting this set of slides with name introducing crm framework within organization crm data analysis period ppt ideas themes pdf. The topics discussed in these slides are entities by rep, completed activities, biz notes month, phone calls last 3 months, activity last 3 months, sales last 3 months, profit last 3 months. This is a completely editable PowerPoint presentation and is available for immediate download. Download now and impress your audience.
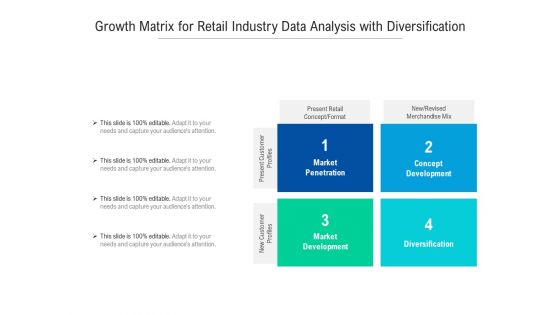
Growth Matrix For Retail Industry Data Analysis With Diversification Ppt Powerpoint Presentation Pictures Microsoft Pdf
Presenting growth matrix for retail industry data analysis with diversification ppt powerpoint presentation pictures microsoft pdf to dispense important information. This template comprises four stages. It also presents valuable insights into the topics including market penetration, concept development, diversification, market development, present retail concept format, present customer profiles, new customer profiles. This is a completely customizable PowerPoint theme that can be put to use immediately. So, download it and address the topic impactfully.

International Retail Data Analysis Industry Key Ppt Powerpoint Presentation Portfolio Infographics Pdf
Pitch your topic with ease and precision using this international retail data analysis industry key ppt powerpoint presentation portfolio infographics pdf. This layout presents information on national retail sales in usd billion, per capita gdp, population in million, country. It is also available for immediate download and adjustment. So, changes can be made in the color, design, graphics or any other component to create a unique layout.
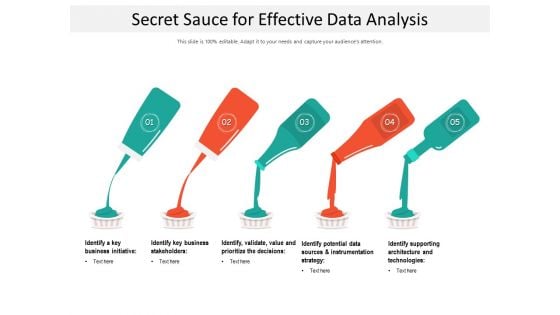
Secret Sauce For Effective Data Analysis Ppt PowerPoint Presentation Gallery Graphics Example PDF
Pitch your topic with ease and precision using this secret sauce for effective data analysis ppt powerpoint presentation gallery graphics example pdf. This layout presents information on sources and instrumentation, strategy, business initiative, prioritize the decision, identify supporting, architecture and technologies. It is also available for immediate download and adjustment. So, changes can be made in the color, design, graphics or any other component to create a unique layout.
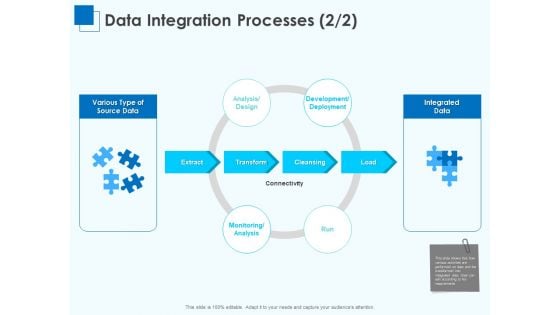
Corporate Intelligence Business Analysis Data Integration Processes Design Ppt Slides Visual Aids PDF
Presenting corporate intelligence business analysis data integration processes design ppt slides visual aids pdf to provide visual cues and insights. Share and navigate important information on four stages that need your due attention. This template can be used to pitch topics like extract, transform, cleansing, load. In addition, this PPT design contains high-resolution images, graphics, etc, that are easily editable and available for immediate download.
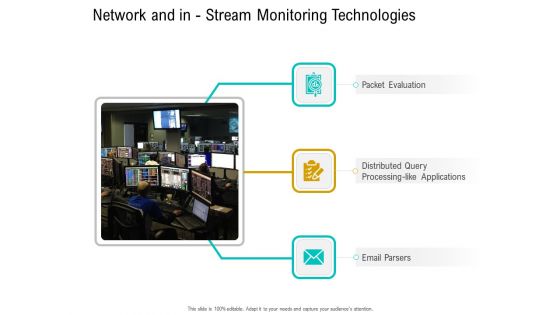
Business Data Analysis Network And In Stream Monitoring Technologies Portrait PDF
This is a business data analysis network and in stream monitoring technologies portrait pdf template with various stages. Focus and dispense information on three stages using this creative set, that comes with editable features. It contains large content boxes to add your information on topics like packet evaluation, distributed query processing like applications, email parsers . You can also showcase facts, figures, and other relevant content using this PPT layout. Grab it now.
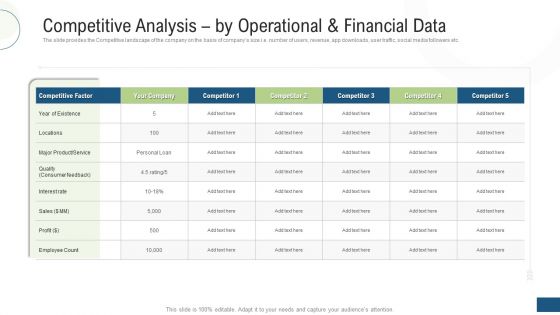
Competitive Analysis By Operational And Financial Data Ppt Outline Graphics Example PDF
The slide provides the Competitive landscape of the company on the basis of companys size i.e. number of users, revenue, app downloads, user traffic, social media followers etc. Deliver an awe inspiring pitch with this creative competitive analysis by operational and financial data ppt outline graphics example pdf bundle. Topics like competitive factor, product service, profit, competitor can be discussed with this completely editable template. It is available for immediate download depending on the needs and requirements of the user.
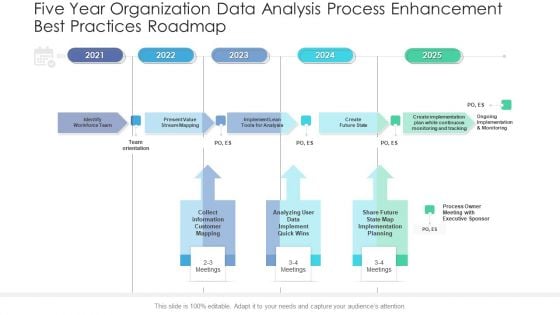
Five Year Organization Data Analysis Process Enhancement Best Practices Roadmap Rules
Presenting our innovatively structured five year organization data analysis process enhancement best practices roadmap rules Template. Showcase your roadmap process in different formats like PDF, PNG, and JPG by clicking the download button below. This PPT design is available in both Standard Screen and Widescreen aspect ratios. It can also be easily personalized and presented with modified font size, font type, color, and shapes to measure your progress in a clear way.
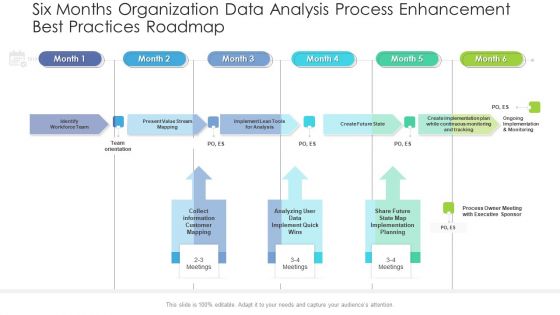
Six Months Organization Data Analysis Process Enhancement Best Practices Roadmap Inspiration
Presenting our innovatively structured six months organization data analysis process enhancement best practices roadmap inspiration Template. Showcase your roadmap process in different formats like PDF, PNG, and JPG by clicking the download button below. This PPT design is available in both Standard Screen and Widescreen aspect ratios. It can also be easily personalized and presented with modified font size, font type, color, and shapes to measure your progress in a clear way.
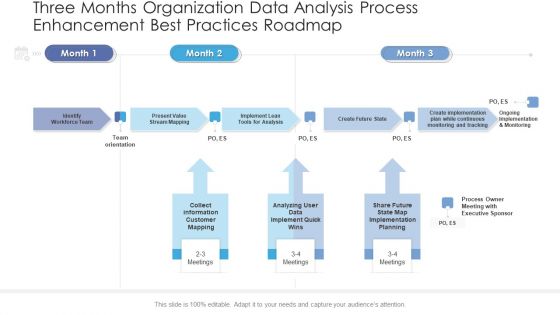
Three Months Organization Data Analysis Process Enhancement Best Practices Roadmap Portrait
Presenting our innovatively structured three months organization data analysis process enhancement best practices roadmap portrait Template. Showcase your roadmap process in different formats like PDF, PNG, and JPG by clicking the download button below. This PPT design is available in both Standard Screen and Widescreen aspect ratios. It can also be easily personalized and presented with modified font size, font type, color, and shapes to measure your progress in a clear way.
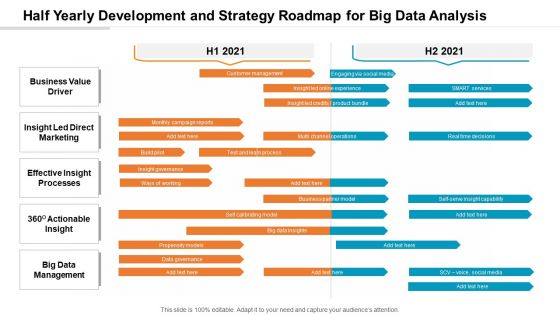
Half Yearly Development And Strategy Roadmap For Big Data Analysis Ideas
Presenting our innovatively-structured half yearly development and strategy roadmap for big data analysis ideas Template. Showcase your roadmap process in different formats like PDF, PNG, and JPG by clicking the download button below. This PPT design is available in both Standard Screen and Widescreen aspect ratios. It can also be easily personalized and presented with modified font size, font type, color, and shapes to measure your progress in a clear way.
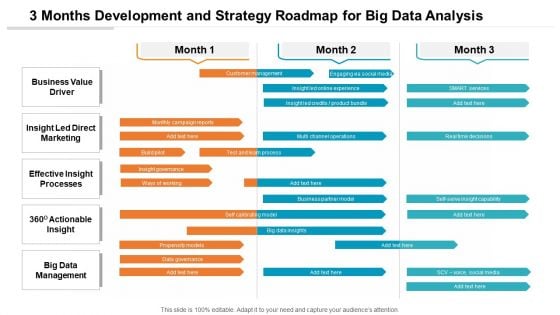
3 Months Development And Strategy Roadmap For Big Data Analysis Background
Presenting our innovatively-structured 3 months development and strategy roadmap for big data analysis background Template. Showcase your roadmap process in different formats like PDF, PNG, and JPG by clicking the download button below. This PPT design is available in both Standard Screen and Widescreen aspect ratios. It can also be easily personalized and presented with modified font size, font type, color, and shapes to measure your progress in a clear way.
3 Months Strategy Roadmap For Data Analysis Integration To Business Icons
Introducing our 3 months strategy roadmap for data analysis integration to business icons. This PPT presentation is Google Slides compatible, therefore, you can share it easily with the collaborators for measuring the progress. Also, the presentation is available in both standard screen and widescreen aspect ratios. So edit the template design by modifying the font size, font type, color, and shapes as per your requirements. As this PPT design is fully editable it can be presented in PDF, JPG and PNG formats.
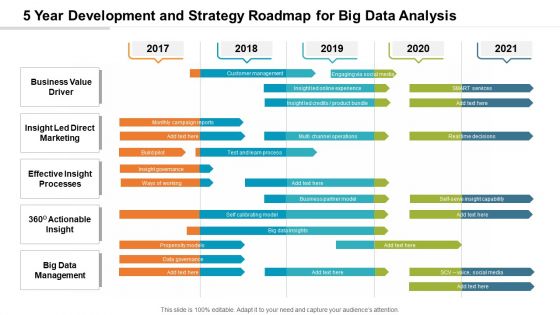
5 Year Development And Strategy Roadmap For Big Data Analysis Elements
Presenting our innovatively-structured 5 year development and strategy roadmap for big data analysis elements Template. Showcase your roadmap process in different formats like PDF, PNG, and JPG by clicking the download button below. This PPT design is available in both Standard Screen and Widescreen aspect ratios. It can also be easily personalized and presented with modified font size, font type, color, and shapes to measure your progress in a clear way.
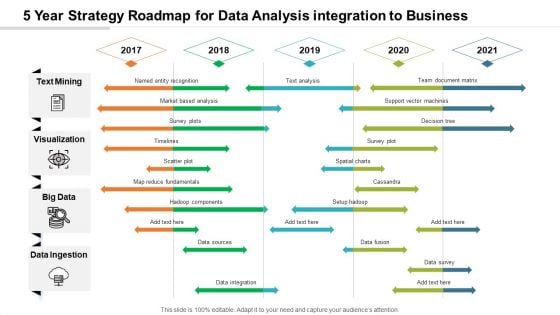
5 Year Strategy Roadmap For Data Analysis Integration To Business Pictures
Introducing our 5 year strategy roadmap for data analysis integration to business pictures. This PPT presentation is Google Slides compatible, therefore, you can share it easily with the collaborators for measuring the progress. Also, the presentation is available in both standard screen and widescreen aspect ratios. So edit the template design by modifying the font size, font type, color, and shapes as per your requirements. As this PPT design is fully editable it can be presented in PDF, JPG and PNG formats.
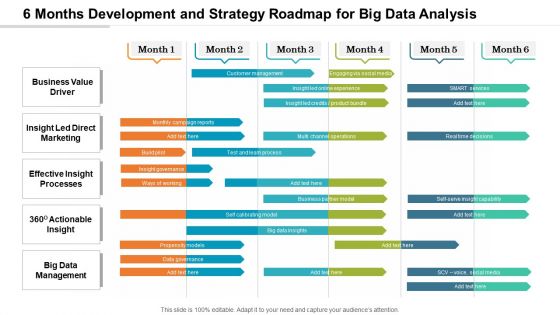
6 Months Development And Strategy Roadmap For Big Data Analysis Graphics
Presenting our innovatively-structured 6 months development and strategy roadmap for big data analysis graphics Template. Showcase your roadmap process in different formats like PDF, PNG, and JPG by clicking the download button below. This PPT design is available in both Standard Screen and Widescreen aspect ratios. It can also be easily personalized and presented with modified font size, font type, color, and shapes to measure your progress in a clear way.
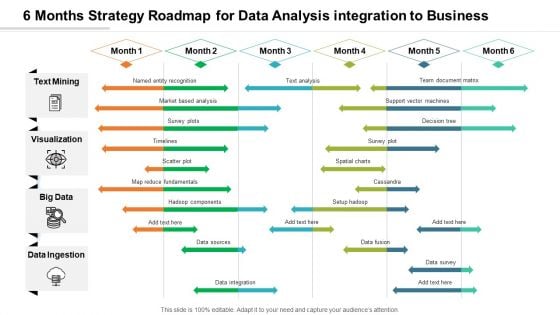
6 Months Strategy Roadmap For Data Analysis Integration To Business Diagrams
Introducing our 6 months strategy roadmap for data analysis integration to business diagrams. This PPT presentation is Google Slides compatible, therefore, you can share it easily with the collaborators for measuring the progress. Also, the presentation is available in both standard screen and widescreen aspect ratios. So edit the template design by modifying the font size, font type, color, and shapes as per your requirements. As this PPT design is fully editable it can be presented in PDF, JPG and PNG formats.
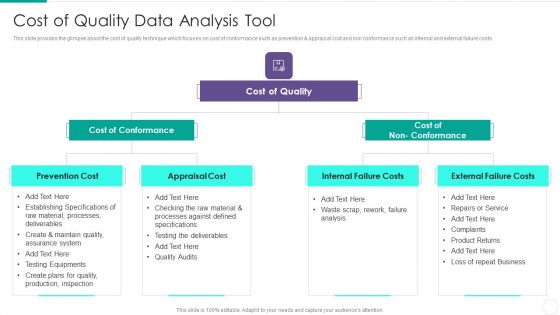
Quantitative Risk Assessment Cost Of Quality Data Analysis Tool Graphics PDF
Presenting Quantitative Risk Assessment Cost Of Quality Data Analysis Tool Graphics PDF to provide visual cues and insights. Share and navigate important information on three stages that need your due attention. This template can be used to pitch topics like Cost Of Conformance, Cost Of Quality, Internal Failure Costs, External Failure Costs, Appraisal Cost. In addtion, this PPT design contains high resolution images, graphics, etc, that are easily editable and available for immediate download.
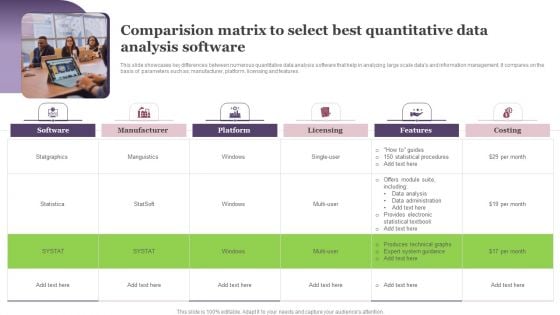
Comparision Matrix To Select Best Quantitative Data Analysis Software Download PDF
Persuade your audience using this Comparision Matrix To Select Best Quantitative Data Analysis Software Download PDF. This PPT design covers six stages, thus making it a great tool to use. It also caters to a variety of topics including Manufacturer, Platform, Licensing, Features, Costing. Download this PPT design now to present a convincing pitch that not only emphasizes the topic but also showcases your presentation skills.
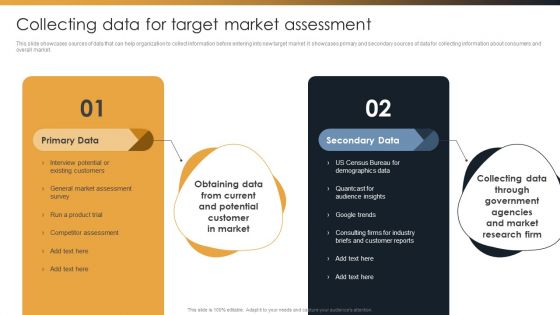
Target Customer Analysis Collecting Data For Target Market Assessment Summary PDF
Slidegeeks is one of the best resources for PowerPoint templates. You can download easily and regulate Target Customer Analysis Collecting Data For Target Market Assessment Summary PDF for your personal presentations from our wonderful collection. A few clicks is all it takes to discover and get the most relevant and appropriate templates. Use our Templates to add a unique zing and appeal to your presentation and meetings. All the slides are easy to edit and you can use them even for advertisement purposes.
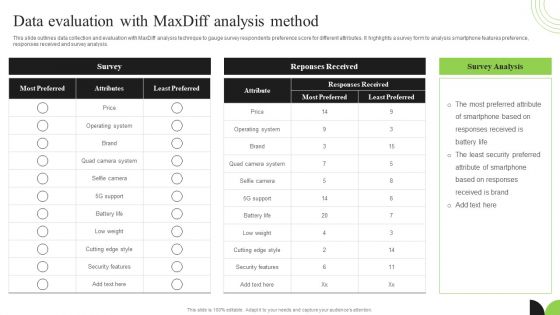
Guidebook For Executing Business Market Intelligence Data Evaluation With Maxdiff Analysis Method Designs PDF
Make sure to capture your audiences attention in your business displays with our gratis customizable Guidebook For Executing Business Market Intelligence Data Evaluation With Maxdiff Analysis Method Designs PDF. These are great for business strategies, office conferences, capital raising or task suggestions. If you desire to acquire more customers for your tech business and ensure they stay satisfied, create your own sales presentation with these plain slides.
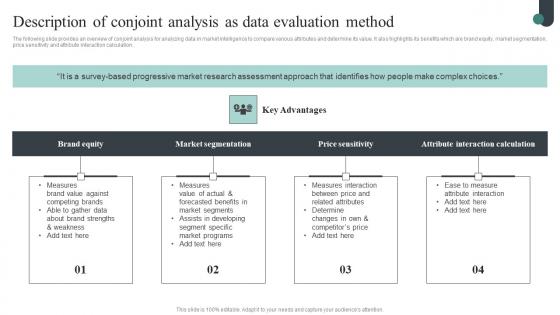
Competitive Intelligence Guide To Determine Market Description Of Conjoint Analysis As Data Designs Pdf
The following slide provides an overview of conjoint analysis for analyzing data in market intelligence to compare various attributes and determine its value. It also highlights its benefits which are brand equity, market segmentation, price sensitivity and attribute interaction calculation. Present like a pro with Competitive Intelligence Guide To Determine Market Description Of Conjoint Analysis As Data Designs Pdf Create beautiful presentations together with your team, using our easy-to-use presentation slides. Share your ideas in real-time and make changes on the fly by downloading our templates. So whether you are in the office, on the go, or in a remote location, you can stay in sync with your team and present your ideas with confidence. With Slidegeeks presentation got a whole lot easier. Grab these presentations today. The following slide provides an overview of conjoint analysis for analyzing data in market intelligence to compare various attributes and determine its value. It also highlights its benefits which are brand equity, market segmentation, price sensitivity and attribute interaction calculation.
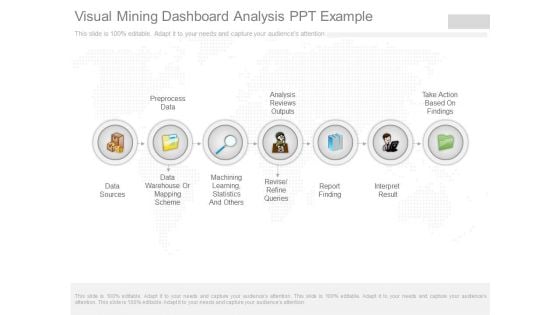
Visual Mining Dashboard Analysis Ppt Example
This is a visual mining dashboard analysis ppt example. This is a seven stage process. The stages in this process are data sources, preprocess data, data warehouse or mapping scheme, machining learning, statistics and others, analysis reviews outputs, revise refine queries, report finding, interpret result, take action based on findings.
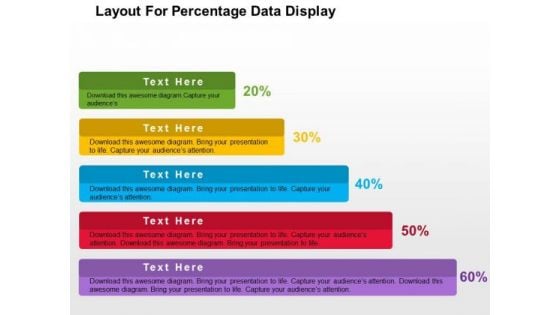
Layout For Precentage Data Display PowerPoint Template
Growth analysis for business can be defined with this business diagram. This slide depicts text boxes in increasing flow. Present your views using this innovative slide and be assured of leaving a lasting impression
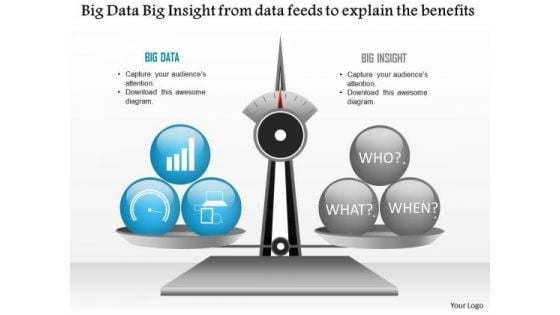
Business Diagram Big Data Big Insight From Data Feeds To Explain The Benefits Ppt Slide
Explain the benefits of big data analysis and data feeds with this technology diagram. This slide contains the graphic of scale with big data and big insight. Use this slide your data information and measurement related presentations.
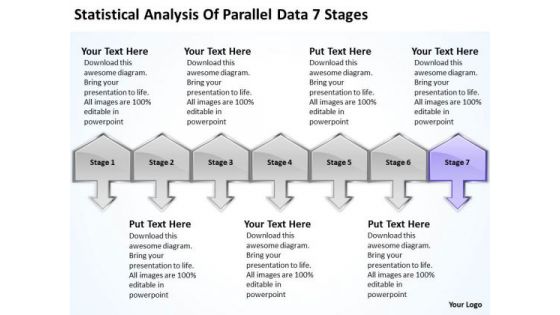
Statistical Analysis Of Parallel Data 7 Stages Ppt Help With Business Plan PowerPoint Slides
We present our statistical analysis of parallel data 7 stages ppt help with business plan PowerPoint Slides.Download and present our Communication PowerPoint Templates because You have gained great respect for your brilliant ideas. Use our PowerPoint Templates and Slides to strengthen and enhance your reputation. Present our Business PowerPoint Templates because you have developed a vision of where you want to be a few years from now. Use our Arrows PowerPoint Templates because this business powerpoint template helps expound on the logic of your detailed thought process to take your company forward. Download our Success PowerPoint Templates because iT outlines the entire thought process for the benefit of others. Tell it to the world with your characteristic aplomb. Use our Symbol PowerPoint Templates because this template helps you to bring your audiences to the table.Use these PowerPoint slides for presentations relating to 3d, Achievement, Action, Aim, Arrows, Black, Business, Color, Communication, Competition, Concept, Connection, Creative, Design, Different, Direction, Element, First, Forward, Graph, Graphic, Group, Growth, Higher, Icon, Illustration, Image, Isolated, Leader, Leadership, Line, Menu, Motion, Orange, Progress, Series, Seven, Sign, Slew, Solution, Success, Swerve, Symbol, Team, Teamwork, Turn, Up. The prominent colors used in the PowerPoint template are Purple, Gray, Black. Customers tell us our statistical analysis of parallel data 7 stages ppt help with business plan PowerPoint Slides will generate and maintain the level of interest you desire. They will create the impression you want to imprint on your audience. Use our Arrows PowerPoint templates and PPT Slides are Magnificent. PowerPoint presentation experts tell us our statistical analysis of parallel data 7 stages ppt help with business plan PowerPoint Slides will help them to explain complicated concepts. People tell us our Action PowerPoint templates and PPT Slides will make the presenter successul in his career/life. We assure you our statistical analysis of parallel data 7 stages ppt help with business plan PowerPoint Slides are Precious. People tell us our Aim PowerPoint templates and PPT Slides are Pleasant. Many a popular belief turn out fallacious. Establish the factual position with our Statistical Analysis Of Parallel Data 7 Stages Ppt Help With Business Plan PowerPoint Slides.
Qualitative Data Process Sample Diagram Example
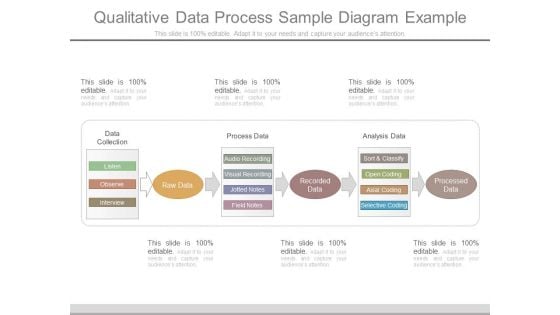
This is a qualitative data process sample diagram example. This is a three stage process. The stages in this process are data collection, process data, analysis data, listen, observe, interview, audio recording, visual recording, jotted notes, field notes, sort and classify, open coding, axial coding, selective coding, processed data.
Data Science Process Flow Diagram Ppt Presentation
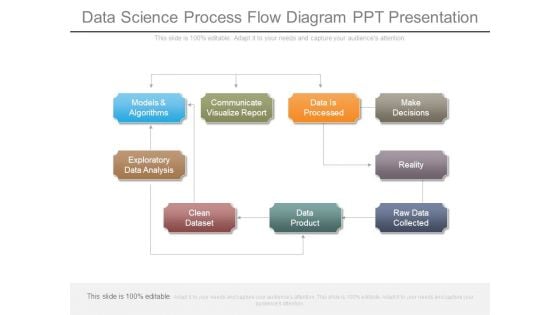
This is a data science process flow diagram ppt presentation. This is a nine stage process. The stages in this process are models and algorithms, communicate visualize report, data is processed, make decisions, exploratory data analysis, clean dataset, data product, raw data collected, reality.
Annual Financial Data Insights Dashboard Icon Introduction PDF
Showcasing this set of slides titled Annual Financial Data Insights Dashboard Icon Introduction PDF. The topics addressed in these templates are Annual Financial, Data Insights, Dashboard. All the content presented in this PPT design is completely editable. Download it and make adjustments in color, background, font etc. as per your unique business setting.
Marketers Guide To Data Analysis And Optimization Ppt PowerPoint Presentation Complete Deck With Slides
With well-researched insights and carefully constructed design, this Marketers Guide To Data Analysis And Optimization Ppt PowerPoint Presentation Complete Deck With Slides is all that you need for your next business meeting with clients and win them over. Add your data to graphs, charts, and tables that are already ready to display it with stunning visuals and help your audience recall your work. With this PPT Complete Deck, you will be able to display your knowledge of the subject as well as your skills as a communicator. Share your ideas and make an impact on the audience with this PowerPoint Layout and ensure that you are known as a presentation professional. Download this PPT Template Bundle to create the most interesting presentation anyone has ever seen.
Ecommerce Data Driven Marketing Performance Analysis Dashboard Ppt Visual Aids Styles PDF
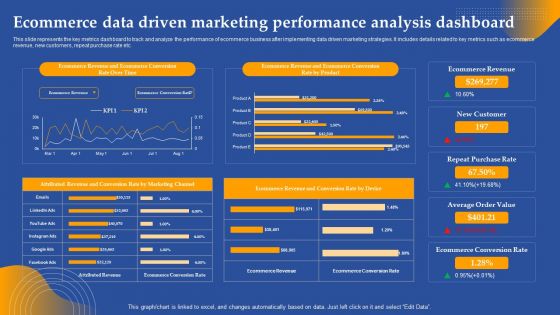
This slide represents the key metrics dashboard to track and analyze the performance of ecommerce business after implementing data driven marketing strategies. It includes details related to key metrics such as ecommerce revenue, new customers, repeat purchase rate etc. Slidegeeks has constructed Ecommerce Data Driven Marketing Performance Analysis Dashboard Ppt Visual Aids Styles PDF after conducting extensive research and examination. These presentation templates are constantly being generated and modified based on user preferences and critiques from editors. Here, you will find the most attractive templates for a range of purposes while taking into account ratings and remarks from users regarding the content. This is an excellent jumping off point to explore our content and will give new users an insight into our top notch PowerPoint Templates.
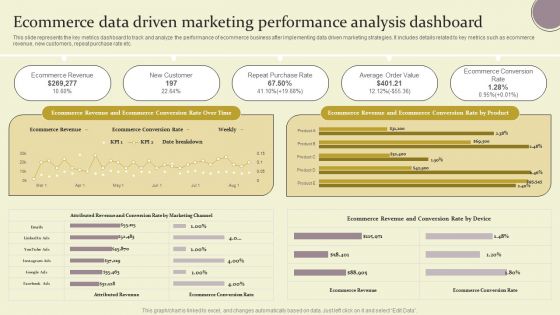
Ecommerce Data Driven Marketing Performance Analysis Dashboard Ppt Pictures Demonstration PDF
This slide represents the key metrics dashboard to track and analyze the performance of ecommerce business after implementing data driven marketing strategies. It includes details related to key metrics such as ecommerce revenue, new customers, repeat purchase rate etc. Slidegeeks has constructed Ecommerce Data Driven Marketing Performance Analysis Dashboard Ppt Pictures Demonstration PDF after conducting extensive research and examination. These presentation templates are constantly being generated and modified based on user preferences and critiques from editors. Here, you will find the most attractive templates for a range of purposes while taking into account ratings and remarks from users regarding the content. This is an excellent jumping off point to explore our content and will give new users an insight into our top notch PowerPoint Templates.
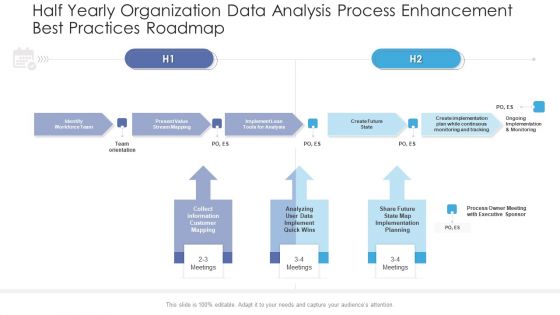
Half Yearly Organization Data Analysis Process Enhancement Best Practices Roadmap Portrait
Presenting the half yearly organization data analysis process enhancement best practices roadmap portrait. The template includes a roadmap that can be used to initiate a strategic plan. Not only this, the PowerPoint slideshow is completely editable and you can effortlessly modify the font size, font type, and shapes according to your needs. This PPT slide can be easily reached in standard screen and widescreen aspect ratios. The set is also available in various formats like PDF, PNG, and JPG. So download and use it multiple times as per your knowledge.
Advanced Service Data Analysis Ppt PowerPoint Presentation Complete Deck With Slides
This complete deck covers various topics and highlights important concepts. It has PPT slides which cater to your business needs. This complete deck presentation emphasizes advanced service data analysis ppt powerpoint presentation complete deck with slides and has templates with professional background images and relevant content. This deck consists of total of fortynine slides. Our designers have created customizable templates, keeping your convenience in mind. You can edit the colour, text and font size with ease. Not just this, you can also add or delete the content if needed. Get access to this fully editable complete presentation by clicking the download button below.
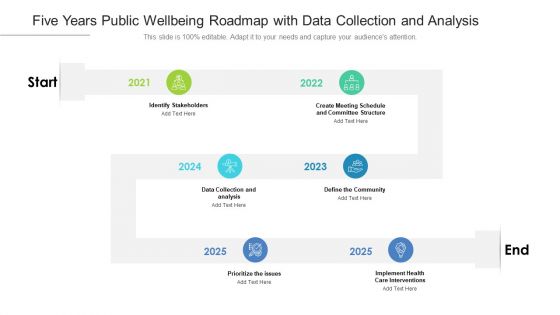
Five Years Public Wellbeing Roadmap With Data Collection And Analysis Topics
Presenting the five years public wellbeing roadmap with data collection and analysis topics. The template includes a roadmap that can be used to initiate a strategic plan. Not only this, the PowerPoint slideshow is completely editable and you can effortlessly modify the font size, font type, and shapes according to your needs. This PPT slide can be easily reached in standard screen and widescreen aspect ratios. The set is also available in various formats like PDF, PNG, and JPG. So download and use it multiple times as per your knowledge.
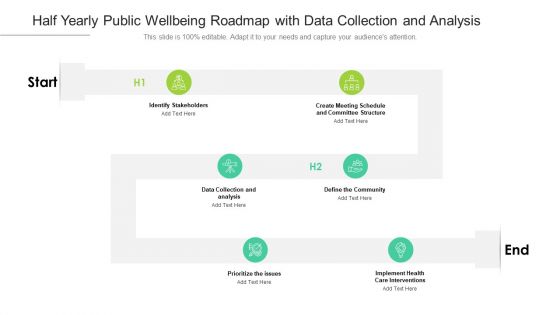
Half Yearly Public Wellbeing Roadmap With Data Collection And Analysis Graphics
Presenting the half yearly public wellbeing roadmap with data collection and analysis graphics. The template includes a roadmap that can be used to initiate a strategic plan. Not only this, the PowerPoint slideshow is completely editable and you can effortlessly modify the font size, font type, and shapes according to your needs. This PPT slide can be easily reached in standard screen and widescreen aspect ratios. The set is also available in various formats like PDF, PNG, and JPG. So download and use it multiple times as per your knowledge.
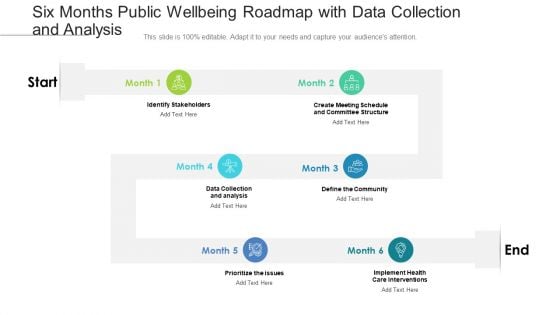
Six Months Public Wellbeing Roadmap With Data Collection And Analysis Clipart
Presenting the six months public wellbeing roadmap with data collection and analysis clipart. The template includes a roadmap that can be used to initiate a strategic plan. Not only this, the PowerPoint slideshow is completely editable and you can effortlessly modify the font size, font type, and shapes according to your needs. This PPT slide can be easily reached in standard screen and widescreen aspect ratios. The set is also available in various formats like PDF, PNG, and JPG. So download and use it multiple times as per your knowledge.
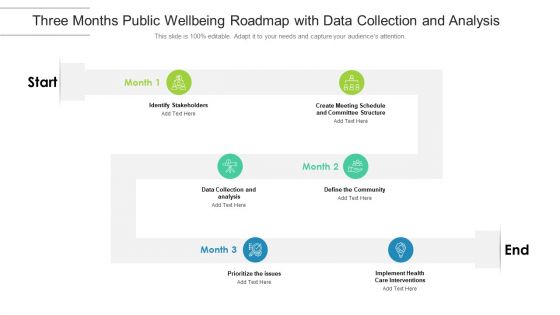
Three Months Public Wellbeing Roadmap With Data Collection And Analysis Guidelines
Presenting the three months public wellbeing roadmap with data collection and analysis guidelines. The template includes a roadmap that can be used to initiate a strategic plan. Not only this, the PowerPoint slideshow is completely editable and you can effortlessly modify the font size, font type, and shapes according to your needs. This PPT slide can be easily reached in standard screen and widescreen aspect ratios. The set is also available in various formats like PDF, PNG, and JPG. So download and use it multiple times as per your knowledge.
Business Operation Modeling Approaches Cost Of Quality Data Analysis Tool Icons PDF
This slide provides the glimpse about the cost of quality technique which focuses on cost of conformance such as prevention and appraisal cost and non conformance such as internal and external failure costs.This is a business operation modeling approaches cost of quality data analysis tool icons pdf template with various stages. Focus and dispense information on two stages using this creative set, that comes with editable features. It contains large content boxes to add your information on topics like cost of quality, cost of conformance, external failure costs You can also showcase facts, figures, and other relevant content using this PPT layout. Grab it now.
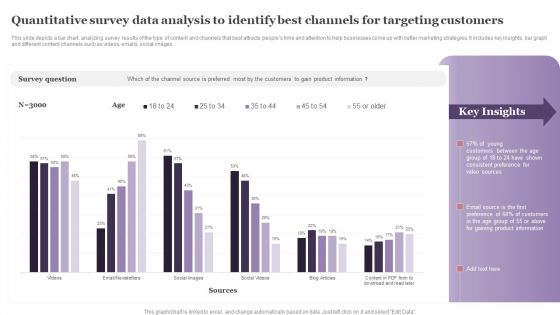
Quantitative Survey Data Analysis To Identify Best Channels For Targeting Customers Formats PDF
This slide depicts a bar chart, analyzing survey results of the type of content and channels that best attracts peoples time and attention to help businesses come up with better marketing strategies. It includes key insights, bar graph and different content channels such as videos, emails, social images. Pitch your topic with ease and precision using this Quantitative Survey Data Analysis To Identify Best Channels For Targeting Customers Formats PDF. This layout presents information on Survey Question, Young Customers, Consistent Preference. It is also available for immediate download and adjustment. So, changes can be made in the color, design, graphics or any other component to create a unique layout.
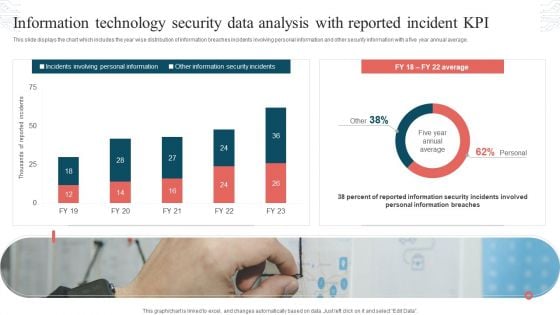
Information Technology Security Data Analysis With Reported Incident KPI Download PDF
This slide displays the chart which includes the year wise distribution of information breaches incidents involving personal information and other security information with a five year annual average. Showcasing this set of slides titled Information Technology Security Data Analysis With Reported Incident KPI Download PDF. The topics addressed in these templates are Incidents Involving, Personal Information, Other Information, Security Incidents. All the content presented in this PPT design is completely editable. Download it and make adjustments in color, background, font etc. as per your unique business setting.
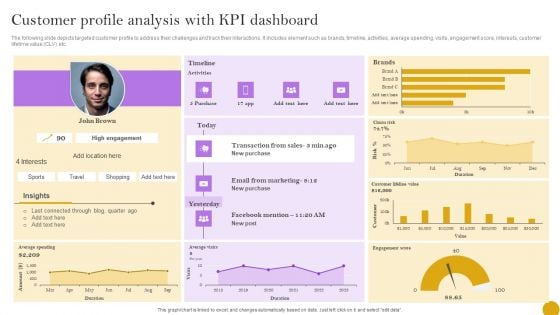
Comprehensive Customer Data Platform Guide Optimizing Promotional Initiatives Customer Profile Analysis KPI Dashboard Pictures PDF
The following slide depicts targeted customer profile to address their challenges and track their interactions. It includes element such as brands, timeline, activities, average spending, visits, engagement score, interests, customer lifetime value CLV etc. The best PPT templates are a great way to save time, energy, and resources. Slidegeeks have 100 percent editable powerpoint slides making them incredibly versatile. With these quality presentation templates, you can create a captivating and memorable presentation by combining visually appealing slides and effectively communicating your message. Download Comprehensive Customer Data Platform Guide Optimizing Promotional Initiatives Customer Profile Analysis KPI Dashboard Pictures PDF from Slidegeeks and deliver a wonderful presentation.
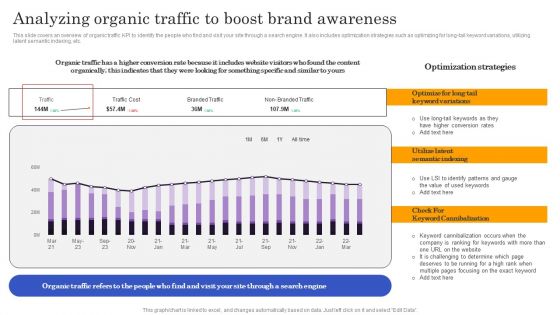
Marketers Guide To Data Analysis Optimization Analyzing Organic Traffic To Boost Brand Awareness Download PDF
This slide covers an overview of organic traffic KPI to identify the people who find and visit your site through a search engine. It also includes optimization strategies such as optimizing for long-tail keyword variations, utilizing latent semantic indexing, etc. If your project calls for a presentation, then Slidegeeks is your go to partner because we have professionally designed, easy to edit templates that are perfect for any presentation. After downloading, you can easily edit Marketers Guide To Data Analysis Optimization Analyzing Organic Traffic To Boost Brand Awareness Download PDF and make the changes accordingly. You can rearrange slides or fill them with different images. Check out all the handy templates
Marketers Guide To Data Analysis Optimization Tracking Unsubscribe Rate For Improving Email Content Infographics PDF
This slide covers an overview of the unsubscribe rate to identify the percentage of recipients that opt out of the mailing list. It also includes strategies to reduce unsubscribe rates, such as creating an optimized list, using automation, etc. From laying roadmaps to briefing everything in detail, our templates are perfect for you. You can set the stage with your presentation slides. All you have to do is download these easy to edit and customizable templates. Marketers Guide To Data Analysis Optimization Tracking Unsubscribe Rate For Improving Email Content Infographics PDF will help you deliver an outstanding performance that everyone would remember and praise you for. Do download this presentation today.
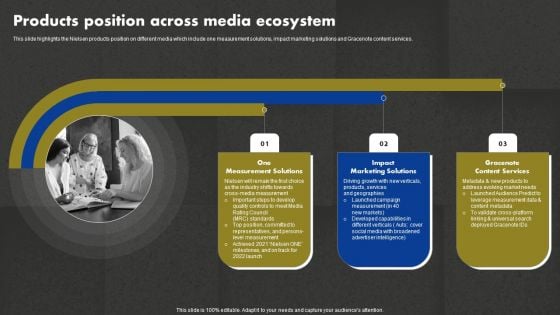
Data And Customer Analysis Company Outline Products Position Across Media Ecosystem Rules PDF
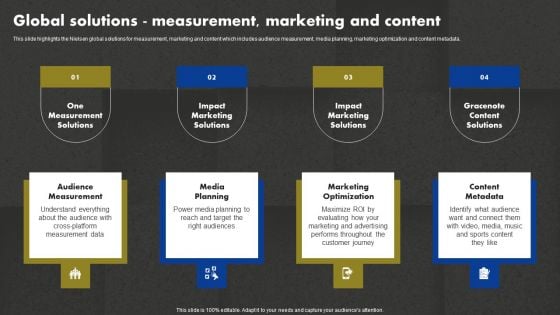
Data And Customer Analysis Company Outline Global Solutions Measurement Marketing Information PDF

Data And Customer Analysis Company Outline Diversified And Growing Business Elements PDF
This slide highlights the Nielsen diversified and growing business which includes solutions revenue share, customer base and revenue by geography, contracted revenue and years of experience. Find a pre designed and impeccable Data And Customer Analysis Company Outline Diversified And Growing Business Elements PDF. The templates can ace your presentation without additional effort. You can download these easy to edit presentation templates to make your presentation stand out from others. So, what are you waiting for Download the template from Slidegeeks today and give a unique touch to your presentation.
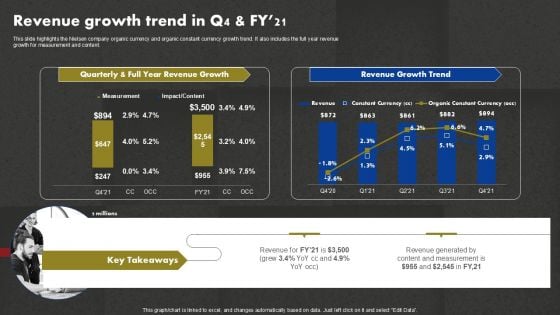
Data And Customer Analysis Company Outline Revenue Growth Trend In Q4 And Fy21 Template PDF
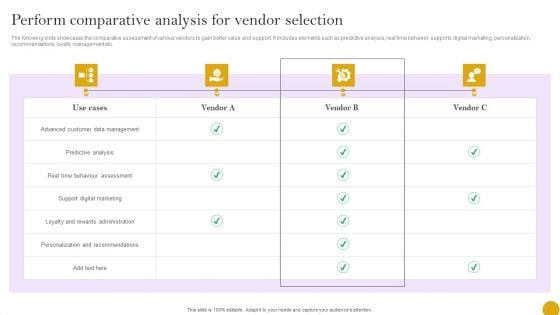
Comprehensive Customer Data Platform Guide Optimizing Promotional Initiatives Perform Comparative Analysis Vendor Background PDF
The following slide showcases the comparative assessment of various vendors to gain better value and support. It includes elements such as predictive analysis, real time behavior, supports digital marketing, personalization, recommendations, loyalty management etc. Slidegeeks is one of the best resources for PowerPoint templates. You can download easily and regulate Comprehensive Customer Data Platform Guide Optimizing Promotional Initiatives Perform Comparative Analysis Vendor Background PDF for your personal presentations from our wonderful collection. A few clicks is all it takes to discover and get the most relevant and appropriate templates. Use our Templates to add a unique zing and appeal to your presentation and meetings. All the slides are easy to edit and you can use them even for advertisement purposes.
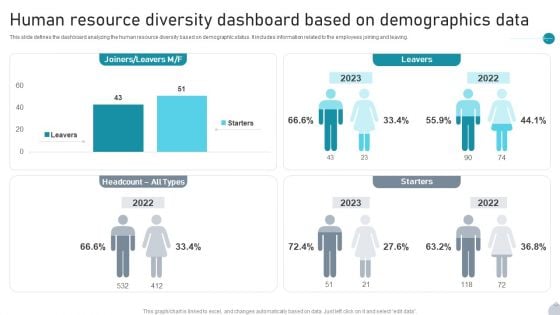
Human Resource Diversity Dashboard Based On Demographics Data Rules PDF
This slide defines the dashboard analyzing the human resource diversity based on demographic status. It includes information related to the employees joining and leaving. Pitch your topic with ease and precision using this Human Resource Diversity Dashboard Based On Demographics Data Rules PDF. This layout presents information on Starters, Leavers, Demographics Data It is also available for immediate download and adjustment. So, changes can be made in the color, design, graphics or any other component to create a unique layout.
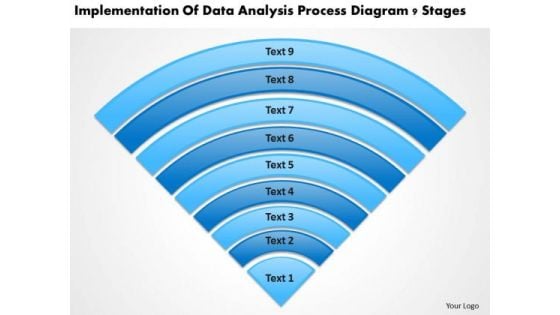
Data Analysis Process Diagram 9 Stages Help With Business Plan PowerPoint Slides
We present our data analysis process diagram 9 stages help with business plan PowerPoint Slides.Use our Computer PowerPoint Templates because Our PowerPoint Templates and Slides will let you Leave a lasting impression to your audiences. They possess an inherent longstanding recall factor. Use our Communication PowerPoint Templates because you can Break through with our PowerPoint Templates and Slides. Bring down the mental barriers of your audience. Use our Semicircles PowerPoint Templates because Our PowerPoint Templates and Slides will let your words and thoughts hit bullseye everytime. Present our Shapes PowerPoint Templates because Our PowerPoint Templates and Slides will let you meet your Deadlines. Use our Business PowerPoint Templates because Our PowerPoint Templates and Slides have the Brilliant backdrops. Guaranteed to illuminate the minds of your audience.Use these PowerPoint slides for presentations relating to Catalogue, chart, checking, choice, circle, swatch, computer, design, equipment, fan, gamma, guide, mix, object, paint, palette, pantone, paper, press, print, printout, process, profile, publishing, rainbow, round, scale, select, selection, semicircle, spectrum, system, template, typographic, typography, variation. The prominent colors used in the PowerPoint template are Blue, Gray, Black. Identify targets with our Data Analysis Process Diagram 9 Stages Help With Business Plan PowerPoint Slides. Download without worries with our money back guaranteee.


 Continue with Email

 Home
Home


