Wheel Diagram
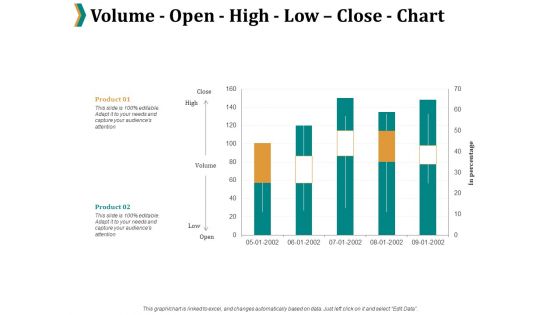
Volume Open High Low Close Chart Ppt PowerPoint Presentation Professional Maker
This is a volume open high low close chart ppt powerpoint presentation professional maker. This is a two stage process. The stages in this process are percentage, product, marketing.
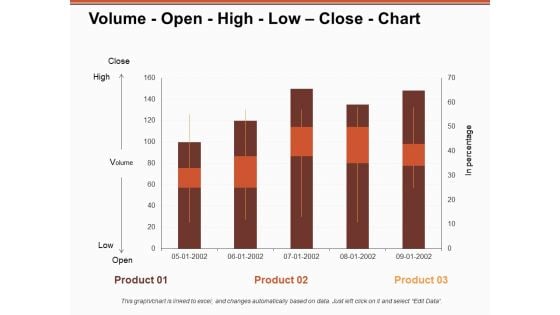
Volume Open High Low Close Chart Ppt PowerPoint Presentation Model Inspiration
This is a volume open high low close chart ppt powerpoint presentation model inspiration. This is a three stage process. The stages in this process are business, management, strategy, marketing, sales.
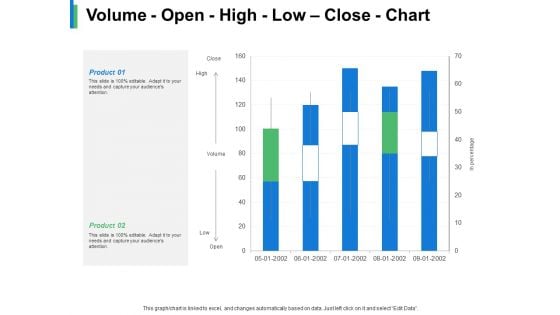
Volume Open High Low Close Chart Product Ppt PowerPoint Presentation Gallery Example
This is a volume open high low close chart product ppt powerpoint presentation gallery example. This is a two stage process. The stages in this process are business, management, strategy, marketing, sales.
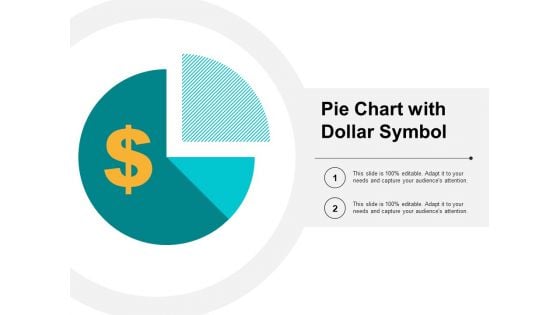
Pie Chart With Dollar Symbol Ppt PowerPoint Presentation Infographic Template Graphics Design
This is a pie chart with dollar symbol ppt powerpoint presentation infographic template graphics design. This is a two stage process. The stages in this process are sectioned circle, segmented circle, partitioned circle.
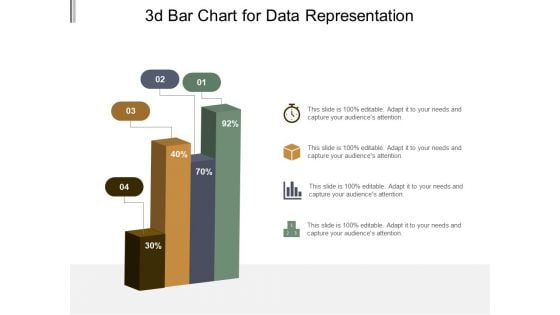
3D Bar Chart For Data Representation Ppt PowerPoint Presentation Model Graphic Tips
This is a 3d bar chart for data representation ppt powerpoint presentation model graphic tips. This is a four stage process. The stages in this process are art, colouring, paint brush.
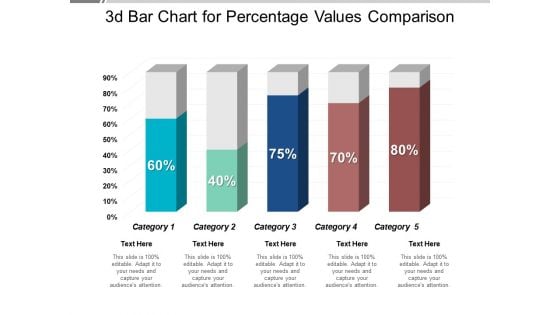
3D Bar Chart For Percentage Values Comparison Ppt PowerPoint Presentation Professional Visual Aids
This is a 3d bar chart for percentage values comparison ppt powerpoint presentation professional visual aids. This is a five stage process. The stages in this process are art, colouring, paint brush.
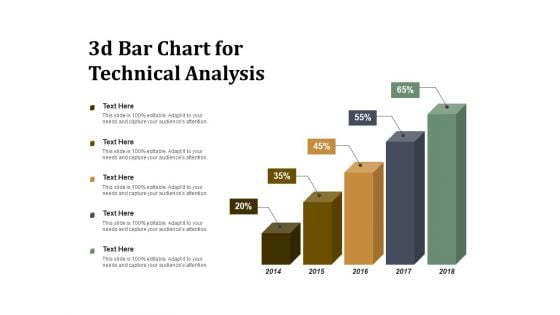
3D Bar Chart For Technical Analysis Ppt PowerPoint Presentation Summary Visuals
This is a 3d bar chart for technical analysis ppt powerpoint presentation summary visuals. This is a five stage process. The stages in this process are art, colouring, paint brush.
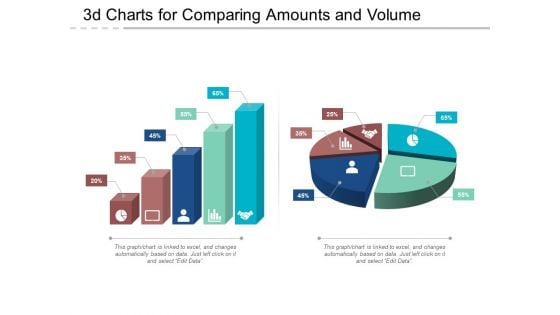
3D Charts For Comparing Amounts And Volume Ppt PowerPoint Presentation Show Deck
This is a 3d charts for comparing amounts and volume ppt powerpoint presentation show deck. This is a five stage process. The stages in this process are art, colouring, paint brush.
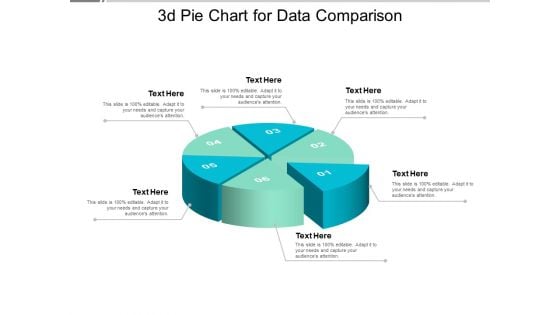
3D Pie Chart For Data Comparison Ppt PowerPoint Presentation Model Design Ideas
This is a 3d pie chart for data comparison ppt powerpoint presentation model design ideas. This is a six stage process. The stages in this process are art, colouring, paint brush.
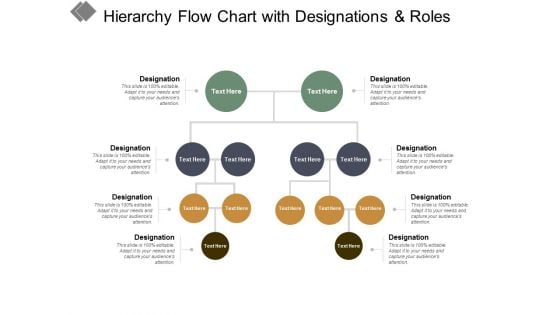
Hierarchy Flow Chart With Designations And Roles Ppt PowerPoint Presentation Styles Format Ideas
This is a hierarchy flow chart with designations and roles ppt powerpoint presentation styles format ideas. This is a four stage process. The stages in this process are business ownership, family business, owned business.
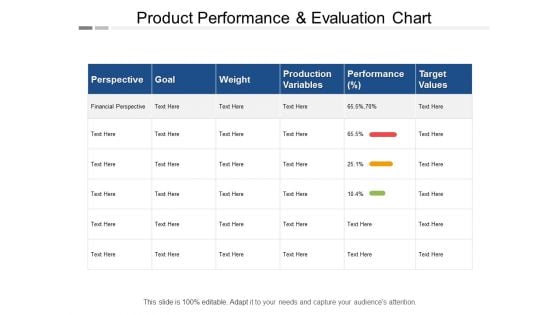
Product Performance And Evaluation Chart Ppt PowerPoint Presentation Pictures Slide Download
This is a product performance and evaluation chart ppt powerpoint presentation pictures slide download. This is a sex stage process. The stages in this process are production management, production performance, production improvement.
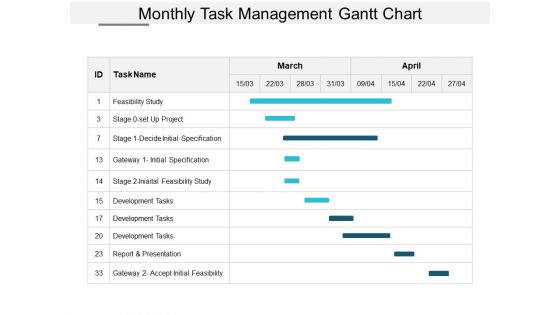
Monthly Task Management Gantt Chart Ppt Powerpoint Presentation Outline Example File
This is a monthly task management gantt chart ppt powerpoint presentation outline example file. This is a three stage process. The stages in this process are new product development, new product launch, introducing new product.
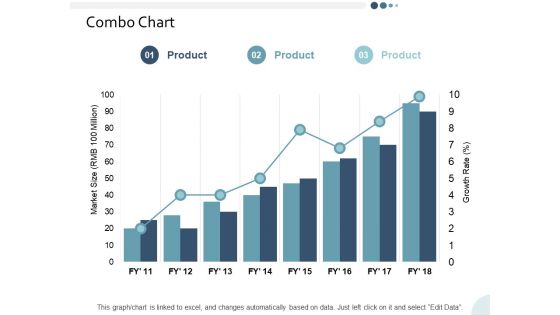
Combo Chart Yearly Operating Plan Ppt PowerPoint Presentation Infographic Template Skills
This is a combo chart yearly operating plan ppt powerpoint presentation infographic template skills. This is a three stage process. The stages in this process are business, management, strategy, analysis, marketing.
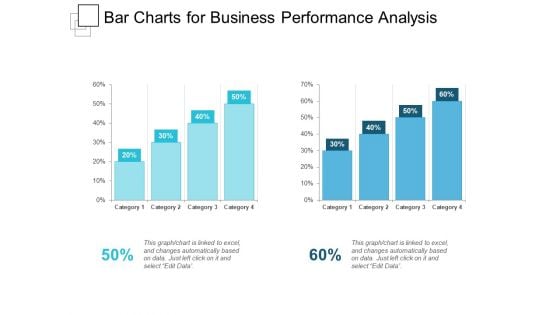
Bar Charts For Business Performance Analysis Ppt PowerPoint Presentation Show Slideshow
This is a bar charts for business performance analysis ppt powerpoint presentation show slideshow. This is a two stage process. The stages in this process are compare, comparison of two, competitive analysis.

Column Chart Employee Value Proposition Ppt PowerPoint Presentation Slides Graphics Design
This is a column chart employee value proposition ppt powerpoint presentation slides graphics design. This is a two stage process. The stages in this process are business, management, strategy, analysis, marketing.
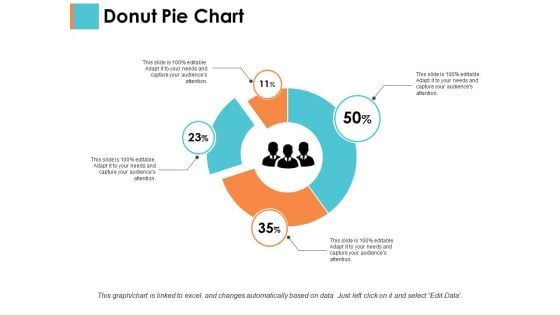
Donut Pie Chart Sample Budget Ppt Ppt PowerPoint Presentation Layouts Styles
This is a donut pie chart sample budget ppt ppt powerpoint presentation layouts styles. This is a four stage process. The stages in this process are business, management, strategy, analysis, marketing.
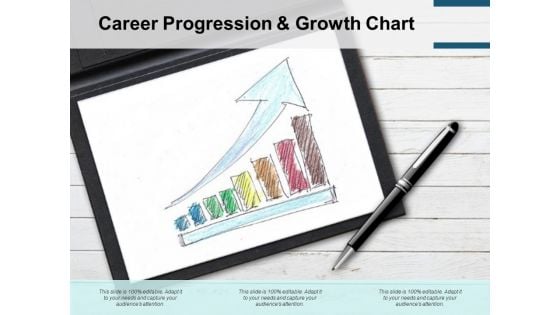
Career Progression And Growth Chart Ppt PowerPoint Presentation Professional Design Inspiration
This is a career progression and growth chart ppt powerpoint presentation professional design inspiration. This is a three stage process. The stages in this process are career progression, career aspiration, career promotion powerpoint presentation slides.
Experimental Control Pie Chart With Dollar Symbol Ppt Powerpoint Presentation Infographics Background Images
This is a experimental control pie chart with dollar symbol ppt powerpoint presentation infographics background images. This is a four stage process. The stages in this process are exploratory, experimental, investigational.
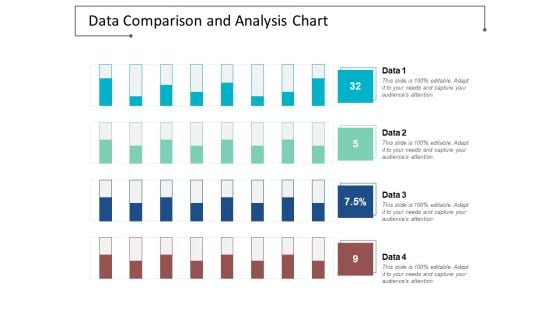
Data Comparison And Analysis Chart Ppt Powerpoint Presentation File Background Images
This is a data comparison and analysis chart ppt powerpoint presentation file background images. This is a four stage process. The stages in this process are data presentation, content presentation, information presentation.
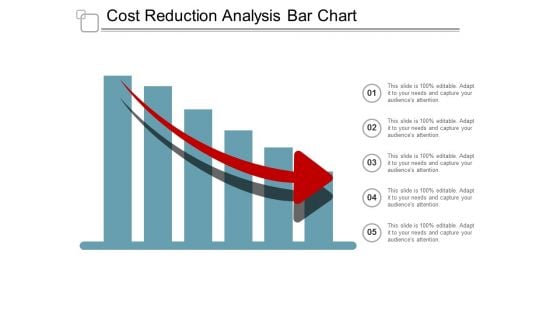
Cost Reduction Analysis Bar Chart Ppt Powerpoint Presentation File Graphics Design
This is a cost reduction analysis bar chart ppt powerpoint presentation file graphics design. This is a five stage process. The stages in this process are data analysis, data science, information science.
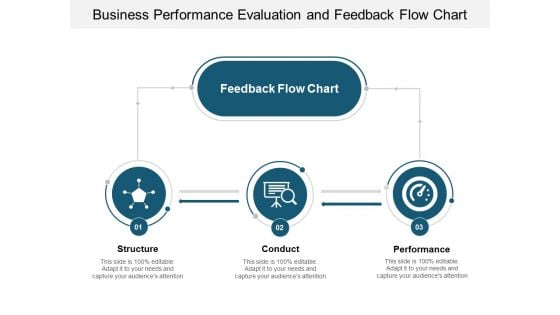
Business Performance Evaluation And Feedback Flow Chart Ppt Powerpoint Presentation Model Example Topics
This is a business performance evaluation and feedback flow chart ppt powerpoint presentation model example topics. This is a three stage process. The stages in this process are performance management, structure conduct performance, performance review and analysis.
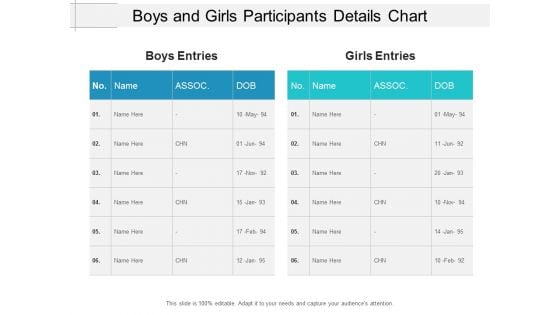
Boys And Girls Participants Details Chart Ppt Powerpoint Presentation Portfolio Layout Ideas
This is a boys and girls participants details chart ppt powerpoint presentation portfolio layout ideas. This is a two stage process. The stages in this process are list of participants, list of members, list of contributors.
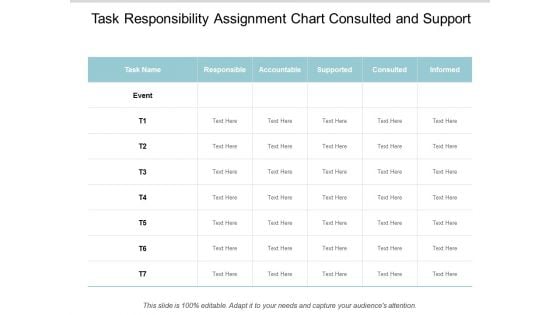
Task Responsibility Assignment Chart Consulted And Support Ppt Powerpoint Presentation Styles Background
This is a task responsibility assignment chart consulted and support ppt powerpoint presentation styles background. This is a seven stage process. The stages in this process are authority matrix, responsibility matrix, leadership matrix.
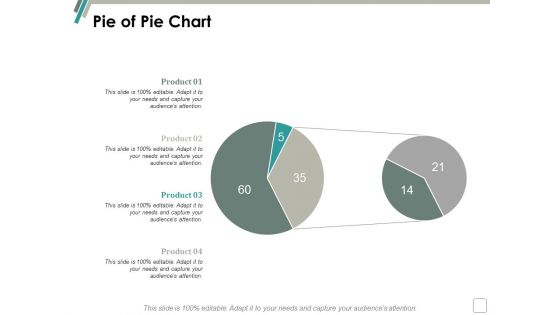
Pie Of Pie Chart Finance Ppt Powerpoint Presentation File Design Templates
This is a pie of pie chart finance ppt powerpoint presentation file design templates. This is a four stage process. The stages in this process are finance, marketing, management, investment, analysis.
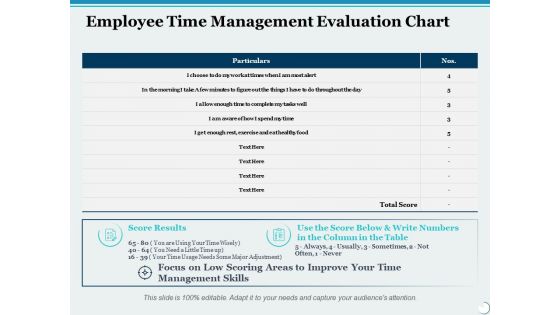
Employee Time Management Evaluation Chart Ppt PowerPoint Presentation File Graphic Images
This is a employee time management evaluation chart ppt powerpoint presentation file graphic images. This is a two stage process. The stages in this process are compare, business, management, marketing.
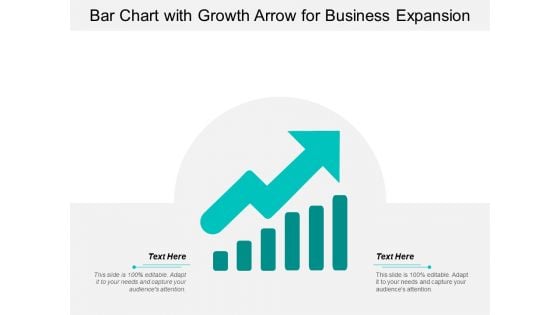
Bar Chart With Growth Arrow For Business Expansion Ppt Powerpoint Presentation File Vector
This is a bar chart with growth arrow for business expansion ppt powerpoint presentation file vector. This is a two stage process. The stages in this process are expanding, business development, business expansion.
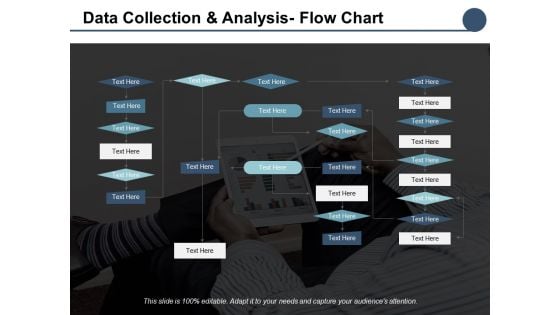
Data Collection And Analysis Flow Chart Ppt PowerPoint Presentation Outline Graphics
This is a data collection and analysis flow chart ppt powerpoint presentation outline graphics. This is a five stage process. The stages in this process are business, management, planning, strategy, marketing.

Bar Chart With Magnifying Glass For Financial Analysis Ppt Powerpoint Presentation Infographics Designs Download
This is a bar chart with magnifying glass for financial analysis ppt powerpoint presentation infographics designs download. This is a three stage process. The stages in this process are business metrics, business kpi, business dashboard.

Business Analysis Data Charts And Reports Ppt Powerpoint Presentation Ideas Portrait
This is a business analysis data charts and reports ppt powerpoint presentation ideas portrait. This is a three stage process. The stages in this process are business metrics, business kpi, business dashboard.
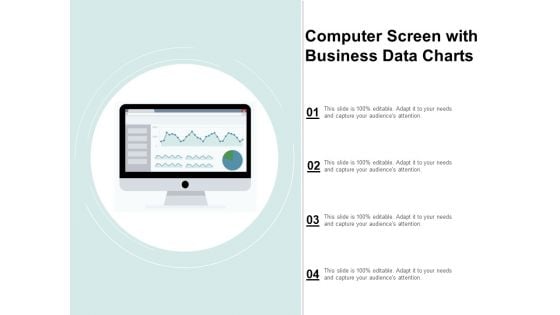
Computer Screen With Business Data Charts Ppt Powerpoint Presentation Show Vector
This is a computer screen with business data charts ppt powerpoint presentation show vector. This is a four stage process. The stages in this process are business metrics, business kpi, business dashboard.
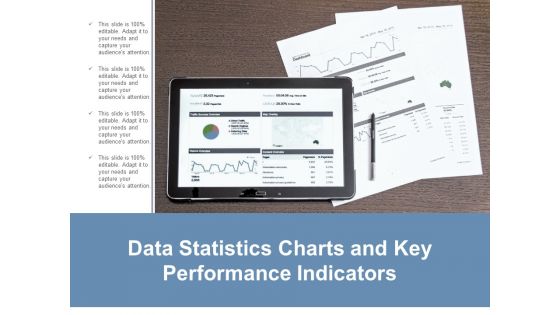
Data Statistics Charts And Key Performance Indicators Ppt Powerpoint Presentation Layouts Guide
This is a data statistics charts and key performance indicators ppt powerpoint presentation layouts guide. This is a four stage process. The stages in this process are business metrics, business kpi, business dashboard.
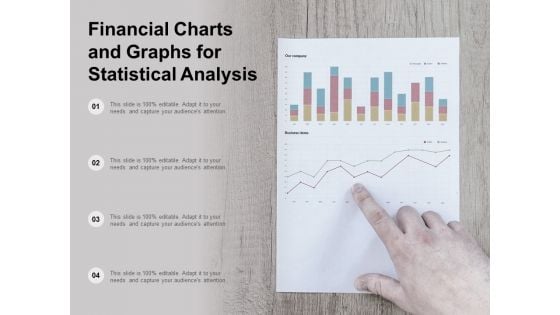
Financial Charts And Graphs For Statistical Analysis Ppt Powerpoint Presentation Show Layout
This is a financial charts and graphs for statistical analysis ppt powerpoint presentation show layout. This is a four stage process. The stages in this process are business metrics, business kpi, business dashboard.
Man Looking At Data Charts For Operation Kpi Evaluation Ppt Powerpoint Presentation Ideas Demonstration
This is a man looking at data charts for operation kpi evaluation ppt powerpoint presentation ideas demonstration. This is a four stage process. The stages in this process are business metrics, business kpi, business dashboard.
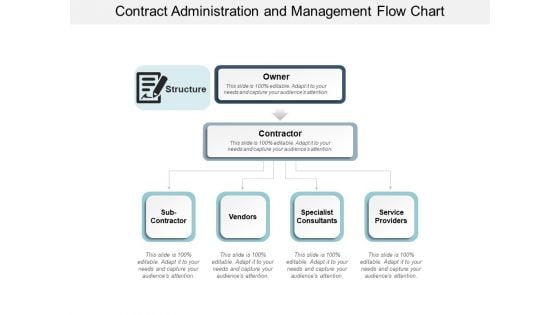
Contract Administration And Management Flow Chart Ppt Powerpoint Presentation File Backgrounds
This is a contract administration and management flow chart ppt powerpoint presentation file backgrounds. This is a four stage process. The stages in this process are contract structure, contract framework, contract model.
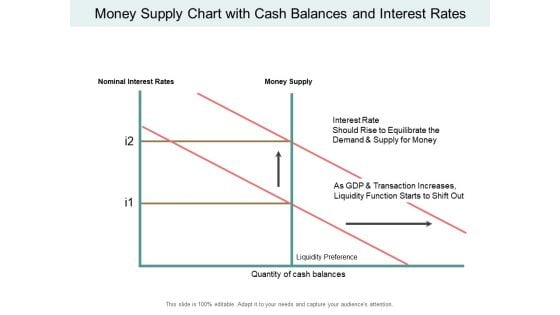
Money Supply Chart With Cash Balances And Interest Rates Ppt PowerPoint Presentation Inspiration Background Images
This is a money supply chart with cash balances and interest rates ppt powerpoint presentation inspiration background images. This is a two stage process. The stages in this process are liquidity, cash assets, solvency.
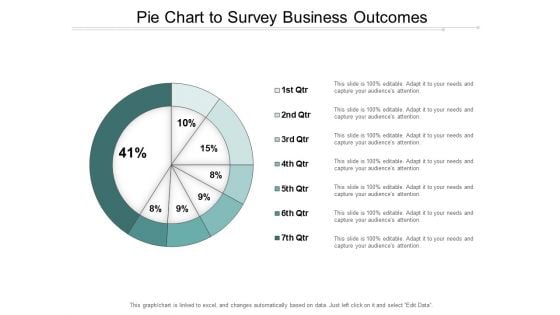
Pie Chart To Survey Business Outcomes Ppt Powerpoint Presentation Infographic Template Gridlines
This is a pie chart to survey business outcomes ppt powerpoint presentation infographic template gridlines. This is a seven stage process. The stages in this process are business outcomes, business results, business output.

Donut Chart Finance Marketing Ppt Powerpoint Presentation Infographics Skills Ppt Powerpoint Presentation File Skills
This is a donut chart finance marketing ppt powerpoint presentation infographics skills ppt powerpoint presentation file skills. This is a four stage process. The stages in this process are finance, marketing, management, investment, analysis.

Gantt Chart For Project Planning Ppt PowerPoint Presentation Slides Design Ideas
This is a gantt chart for project planning ppt powerpoint presentation slides design ideas. This is a three stage process. The stages in this process are project management software, project management tools, project management techniques.
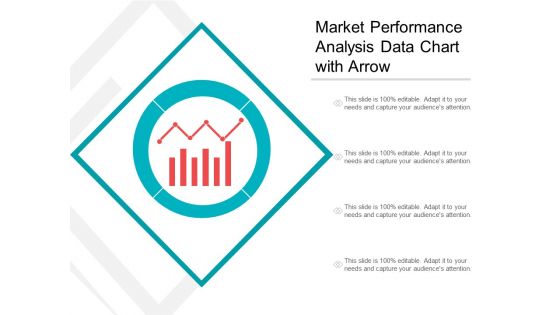
Market Performance Analysis Data Chart With Arrow Ppt PowerPoint Presentation Inspiration Graphics
This is a market performance analysis data chart with arrow ppt powerpoint presentation inspiration graphics. This is a four stage process. The stages in this process are marketing analytics, marketing performance, marketing discovery.
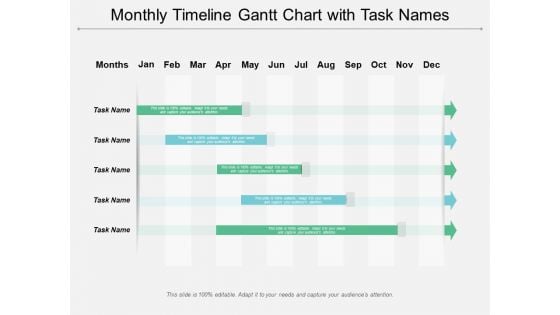
Monthly Timeline Gantt Chart With Task Names Ppt PowerPoint Presentation File Ideas
This is a monthly timeline gantt chart with task names ppt powerpoint presentation file ideas. This is a twelve stage process. The stages in this process are agenda, schedule, timetable.
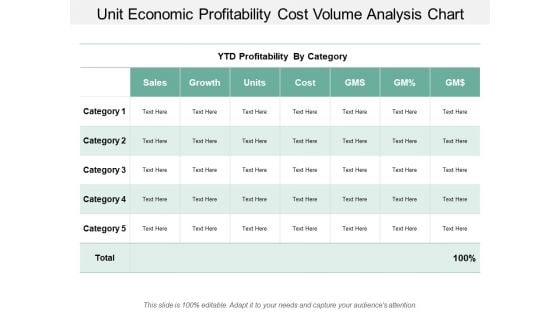
Unit Economic Profitability Cost Volume Analysis Chart Ppt PowerPoint Presentation Styles Graphics Design
This is a unit economic profitability cost volume analysis chart ppt powerpoint presentation styles graphics design. This is a five stage process. The stages in this process are business unit profitability, profitable organization, corporate unit profitability.
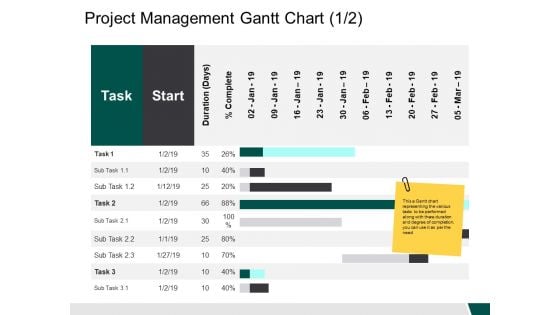
Project Management Gantt Chart Start Ppt PowerPoint Presentation Outline Example Introduction
This is a project management gantt chart start ppt powerpoint presentation outline example introduction. This is a two stage process. The stages in this process are business, management, strategy, analysis, marketing.

Project Management Gantt Chart Finance Ppt PowerPoint Presentation File Layout Ideas
This is a project management gantt chart finance ppt powerpoint presentation file layout ideas. This is a three stage process. The stages in this process are business, planning, strategy, marketing, management.
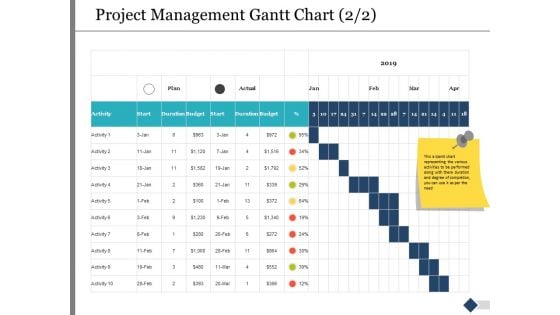
Project Management Gantt Chart Activity Ppt PowerPoint Presentation Model Background Designs
This is a project management gantt chart activity ppt powerpoint presentation model background designs. This is a three stage process. The stages in this process are marketing, business, management, compare.
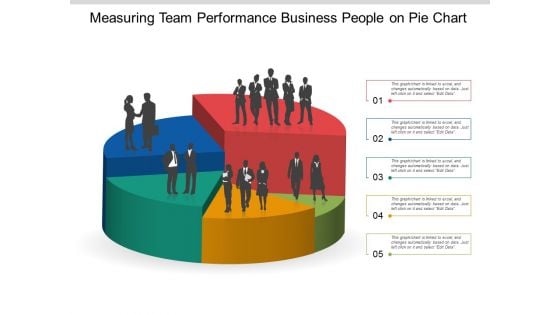
Measuring Team Performance Business People On Pie Chart Ppt Powerpoint Presentation Gallery Smartart
This is a measuring team performance business people on pie chart ppt powerpoint presentation gallery smartart. This is a five stage process. The stages in this process are team performance, member performance, group performance.
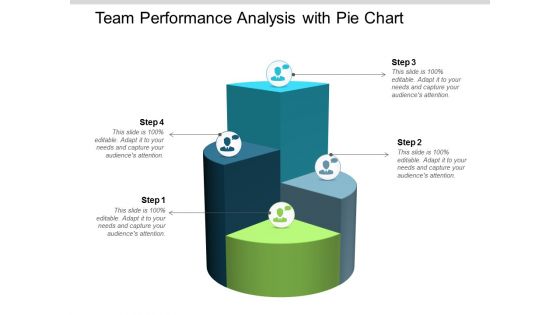
Team Performance Analysis With Pie Chart Ppt Powerpoint Presentation Infographic Template Slideshow
This is a team performance analysis with pie chart ppt powerpoint presentation infographic template slideshow. This is a four stage process. The stages in this process are team performance, member performance, group performance.
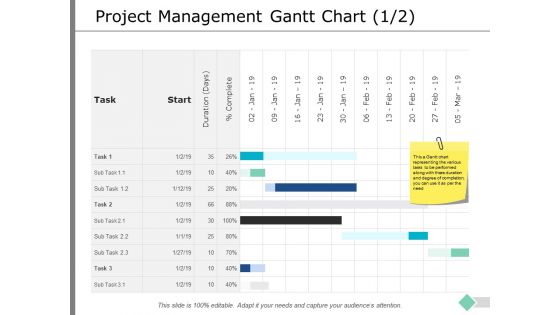
Project Management Gantt Chart Business Ppt PowerPoint Presentation Inspiration Layout Ideas
This is a project management gantt chart business ppt powerpoint presentation inspiration layout ideas. This is a nine stage process. The stages in this process are business, planning, strategy, marketing, management.
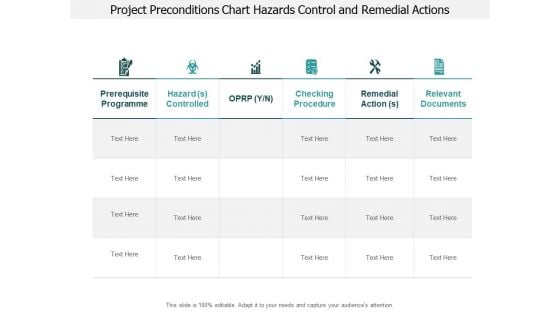
Project Preconditions Chart Hazards Control And Remedial Actions Ppt PowerPoint Presentation Pictures Show
This is a project preconditions chart hazards control and remedial actions ppt powerpoint presentation pictures show. This is a six stage process. The stages in this process are need, requirement, prerequisite.

Comparison Chart Return On Capital Employed Ppt PowerPoint Presentation Portfolio Templates
This is a comparison chart return on capital employed ppt powerpoint presentation portfolio templates. This is a two stage process. The stages in this process are accounting ratio, roce, return on capital employed.
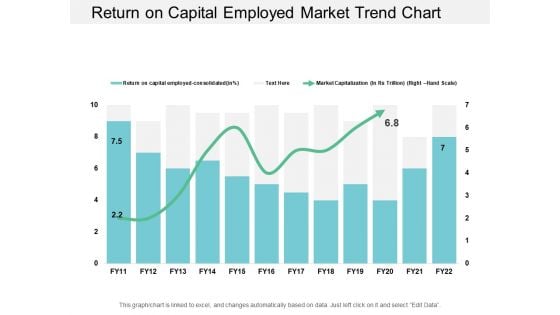
Return On Capital Employed Market Trend Chart Ppt PowerPoint Presentation Styles Examples
This is a return on capital employed market trend chart ppt powerpoint presentation styles examples. This is a two stage process. The stages in this process are accounting ratio, roce, return on capital employed.
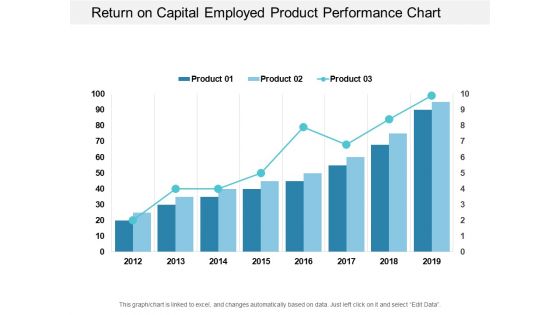
Return On Capital Employed Product Performance Chart Ppt PowerPoint Presentation Portfolio Visuals
This is a return on capital employed product performance chart ppt powerpoint presentation portfolio visuals. This is a three stage process. The stages in this process are accounting ratio, roce, return on capital employed.
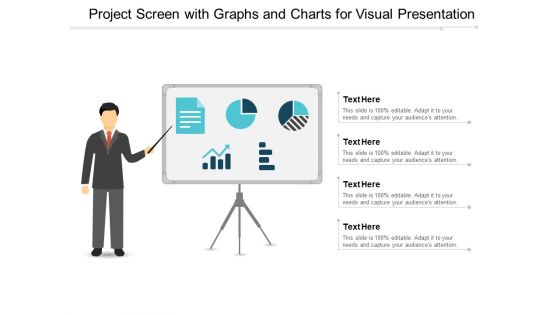
Project Screen With Graphs And Charts For Visual Presentation Ppt PowerPoint Presentation Gallery Design Inspiration
This is a project screen with graphs and charts for visual presentation ppt powerpoint presentation gallery design inspiration. This is a four stage process. The stages in this process are visual aids, communication, business.
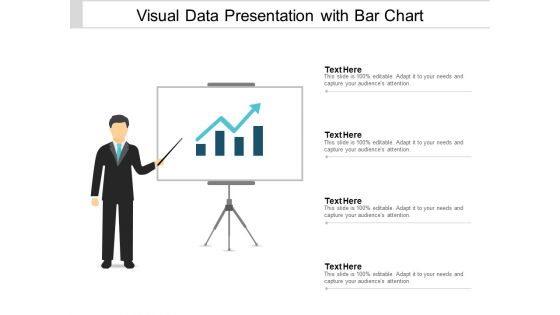
Visual Data Presentation With Bar Chart Ppt PowerPoint Presentation Portfolio Brochure
This is a visual data presentation with bar chart ppt powerpoint presentation portfolio brochure. This is a four stage process. The stages in this process are visual aids, communication, business.
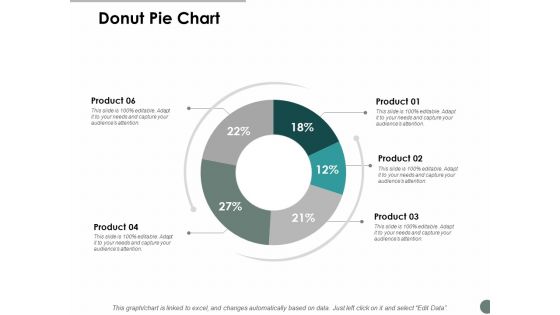
Donut Pie Chart Marketing Ppt Powerpoint Presentation Infographic Template Graphics Template
This is a donut pie chart marketing ppt powerpoint presentation infographic template graphics template. This is a six stage process. The stages in this process are finance, marketing, management, investment, analysis.
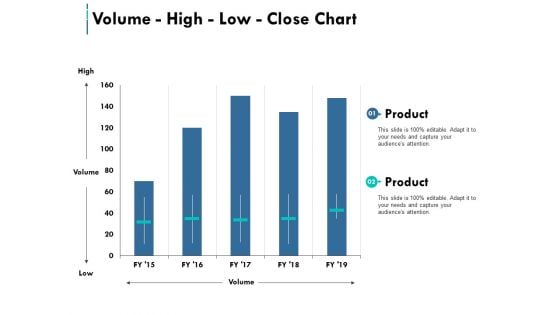
Volume High Low Close Chart Ppt PowerPoint Presentation Pictures Graphics Example
This is a volume high low close chart ppt powerpoint presentation pictures graphics example. This is a two stage process. The stages in this process are marketing, business, management.
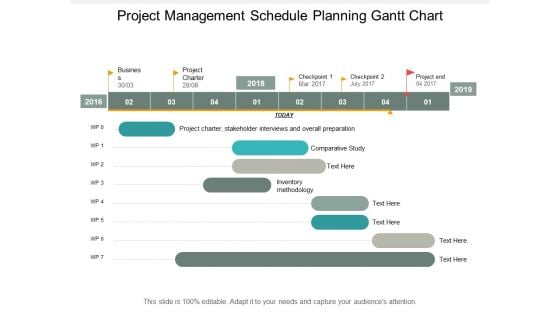
Project Management Schedule Planning Gantt Chart Ppt PowerPoint Presentation Outline Graphics Design
This is a project management schedule planning gantt chart ppt powerpoint presentation outline graphics design. This is a eight stage process. The stages in this process are work package timeline, work package roadmap, tasks package timelines.
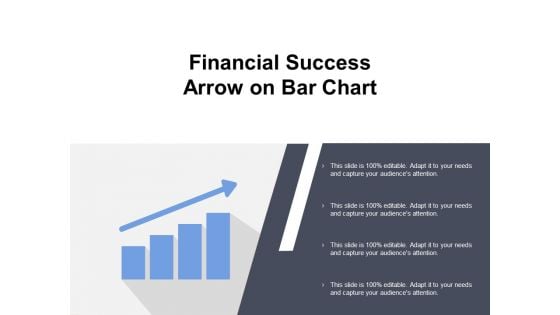
Financial Success Arrow On Bar Chart Ppt PowerPoint Presentation Ideas Display
This is a financial success arrow on bar chart ppt powerpoint presentation ideas display. This is a four stage process. The stages in this process are rising arrow, growing arrow, increasing arrow.
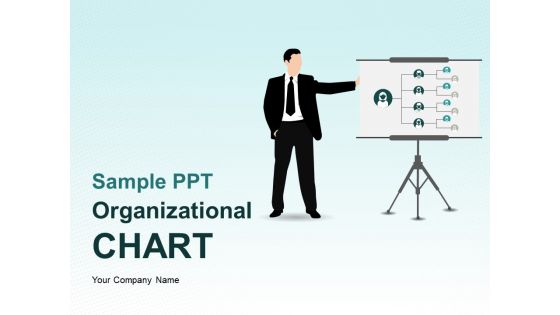
Sample PPT Organizational Chart Ppt PowerPoint Presentation Complete Deck With Slides
This is a sample ppt organizational chart ppt powerpoint presentation complete deck with slides. This is a one stage process. The stages in this process are business, management, planning, strategy, marketing.

Task Management Chart With Status Priority Due Date Ppt PowerPoint Presentation Slides Format Ideas Cpb
This is a task management chart with status priority due date ppt powerpoint presentation slides format ideas cpb. This is a six stage process. The stages in this process are key activities, key highlights, list of activities.
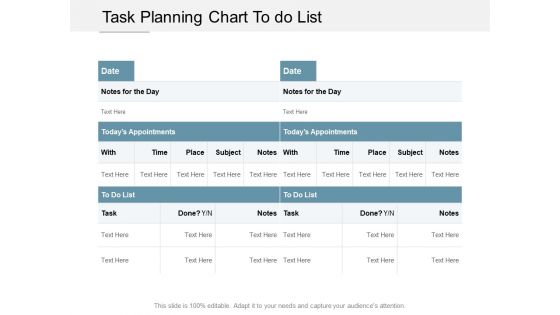
Task Planning Chart To Do List Ppt PowerPoint Presentation Infographics Picture Cpb
This is a task planning chart to do list ppt powerpoint presentation infographics picture cpb. This is a three stage process. The stages in this process are key activities, key highlights, list of activities.


 Continue with Email

 Home
Home


