Work Icon
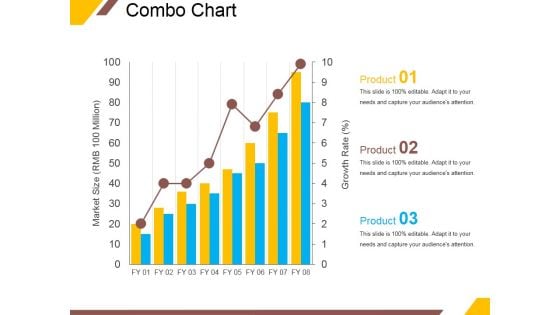
Combo Chart Ppt PowerPoint Presentation Professional Slide Download
This is a combo chart ppt powerpoint presentation professional slide download. This is a three stage process. The stages in this process are market size, growth rate, product, graph, growth.
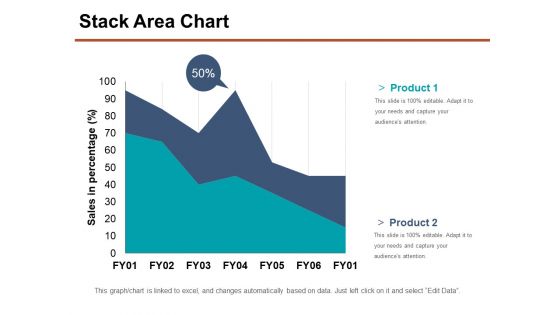
Stack Area Chart Ppt PowerPoint Presentation Show Samples
This is a stack area chart ppt powerpoint presentation show samples. This is a two stage process. The stages in this process are product, sales in percentage, business, marketing, percentage.
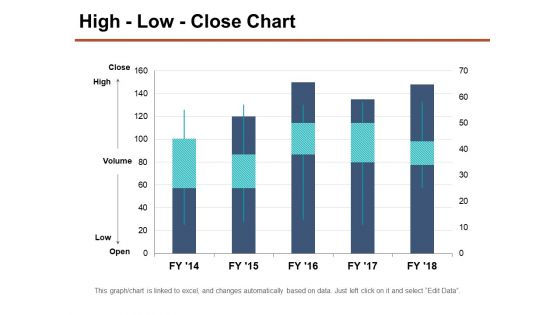
High Low Close Chart Ppt PowerPoint Presentation Layouts Objects
This is a high low close chart ppt powerpoint presentation layouts objects. This is a five stage process. The stages in this process are high, volume, low, business, marketing.
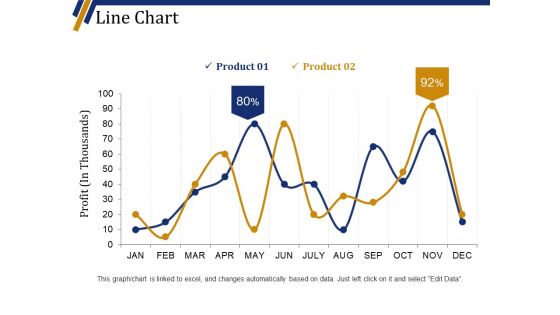
Line Chart Ppt PowerPoint Presentation Portfolio Background Designs
This is a line chart ppt powerpoint presentation portfolio background designs. This is a two stage process. The stages in this process are product, business, finance, marketing, profit in thousands.
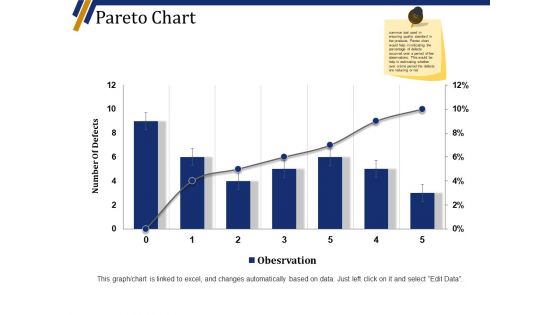
Pareto Chart Ppt PowerPoint Presentation File Infographic Template
This is a pareto chart ppt powerpoint presentation file infographic template. This is a six stage process. The stages in this process are number of defects, business, marketing, graph.
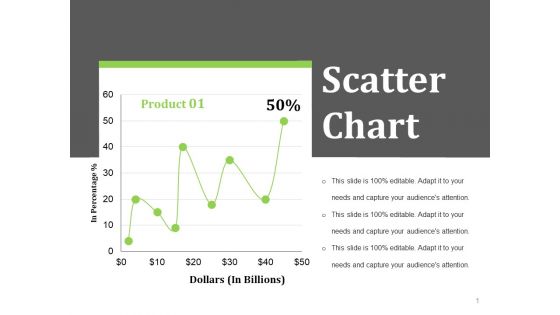
Scatter Chart Ppt PowerPoint Presentation Styles Layout Ideas
This is a scatter chart ppt powerpoint presentation styles layout ideas. This is a one stage process. The stages in this process are dollars in billions, in percentage, business, finance.
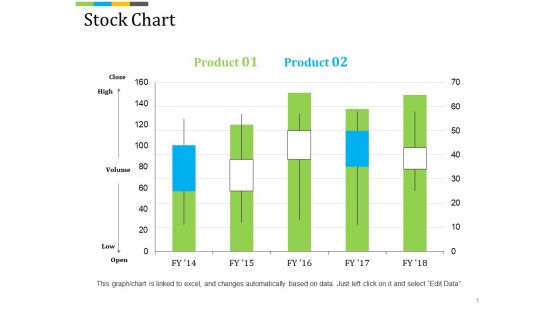
Stock Chart Ppt PowerPoint Presentation Professional Background Image
This is a stock chart ppt powerpoint presentation professional background image. This is a five stage process. The stages in this process are high, volume, low, finance, business, marketing.
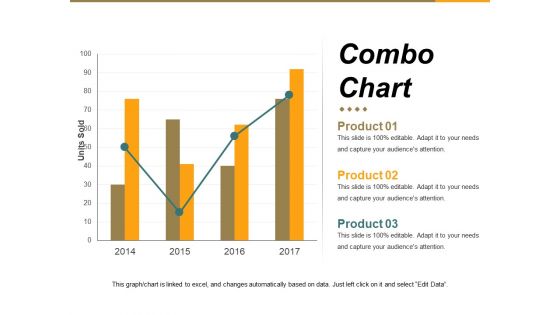
Combo Chart Ppt PowerPoint Presentation Infographics Example Introduction
This is a combo chart ppt powerpoint presentation infographics example introduction. This is a four stage process. The stages in this process are units sold, business, marketing, graph, growth.
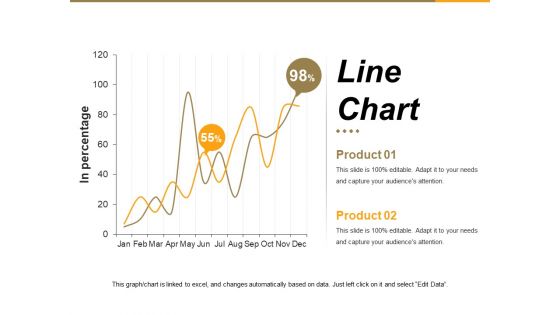
Line Chart Ppt PowerPoint Presentation Summary File Formats
This is a line chart ppt powerpoint presentation summary file formats. This is a two stage process. The stages in this process are in percentage, graph, business, marketing, growth.
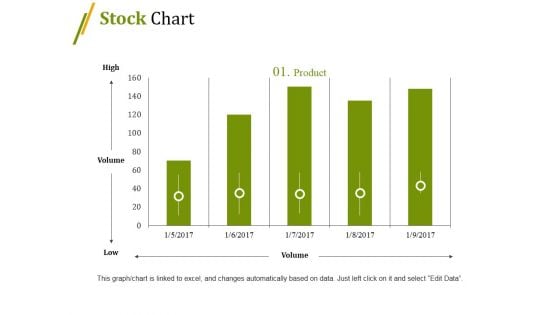
Stock Chart Ppt PowerPoint Presentation Summary File Formats
This is a stock chart ppt powerpoint presentation summary file formats. This is a five stage process. The stages in this process are high, volume, low, business, graph, finance.
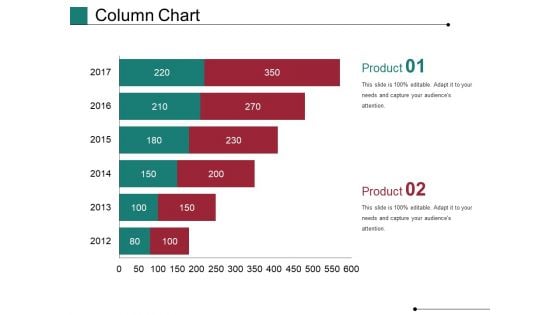
Column Chart Ppt PowerPoint Presentation Show Master Slide
This is a column chart ppt powerpoint presentation show master slide. This is a six stage process. The stages in this process are financial, years, business, marketing, finance, graph.
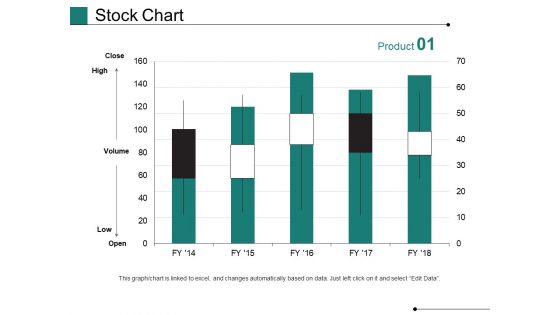
Stock Chart Ppt PowerPoint Presentation Pictures Graphics Design
This is a stock chart ppt powerpoint presentation pictures graphics design. This is a five stage process. The stages in this process are high, volume, low, business, marketing, graph.
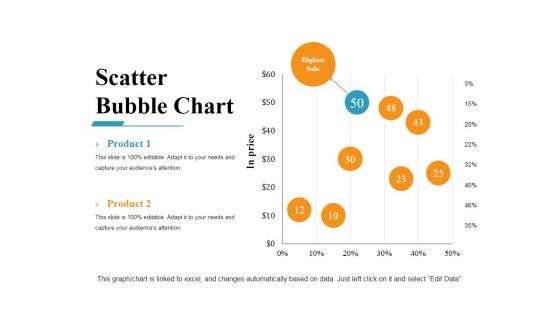
Scatter Bubble Chart Ppt PowerPoint Presentation Gallery Example Introduction
This is a scatter bubble chart ppt powerpoint presentation gallery example introduction. This is a eight stage process. The stages in this process are business, marketing, finance, bubble, scatter.
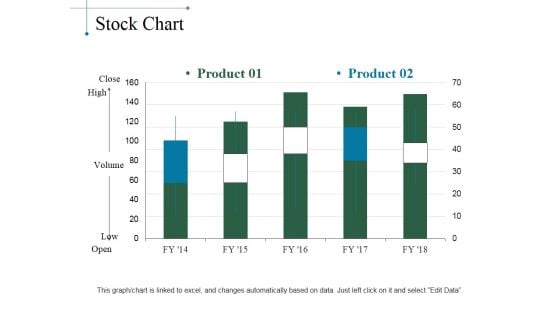
Stock Chart Ppt PowerPoint Presentation Layouts Designs Download
This is a stock chart ppt powerpoint presentation layouts designs download. This is a five stage process. The stages in this process are product, close, high, volume, low, open.
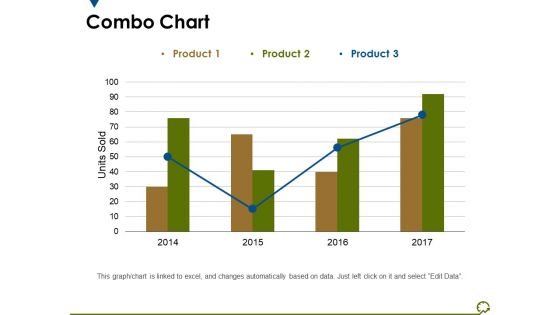
Combo Chart Ppt PowerPoint Presentation Outline Graphics Tutorials
This is a combo chart ppt powerpoint presentation outline graphics tutorials. This is a three stage process. The stages in this process are units sold, years, business, marketing, graph.

Line Chart Ppt PowerPoint Presentation Infographics Graphic Images
This is a line chart ppt powerpoint presentation infographics graphic images. This is a two stage process. The stages in this process are sales in percentage, financial years, growth, business, marketing.
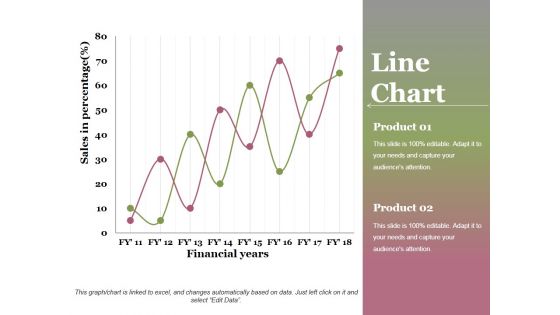
Line Chart Ppt PowerPoint Presentation Professional Graphics Design
This is a line chart ppt powerpoint presentation professional graphics design. This is a two stage process. The stages in this process are financial years, sales in percentage, product, growth, success.
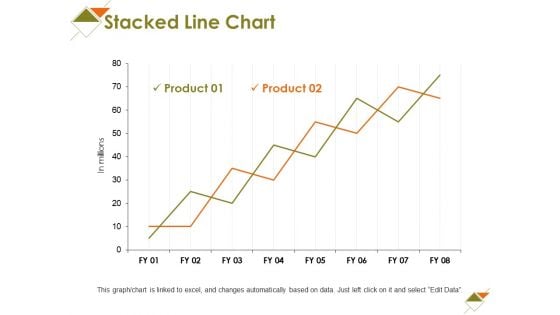
Stacked Line Chart Ppt PowerPoint Presentation File Display
This is a stacked line chart ppt powerpoint presentation file display. This is a two stage process. The stages in this process are business, marketing, graph, strategy, in millions.
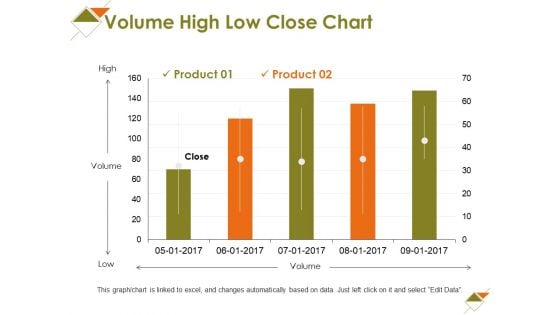
Volume High Low Close Chart Ppt PowerPoint Presentation Slides Styles
This is a volume high low close chart ppt powerpoint presentation slides styles. This is a two stage process. The stages in this process are high, volume, low, business, marketing.
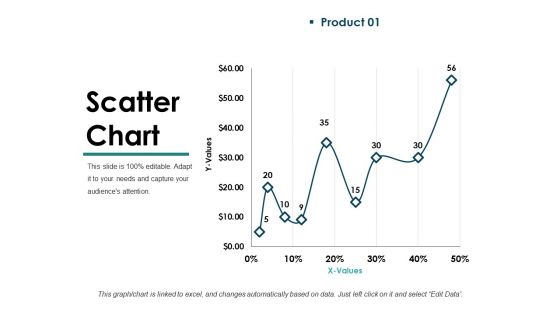
Scatter Chart Template 1 Ppt PowerPoint Presentation Inspiration Guidelines
This is a scatter chart template 1 ppt powerpoint presentation inspiration guidelines. This is a one stage process. The stages in this process are business, marketing, graph, values, growth.
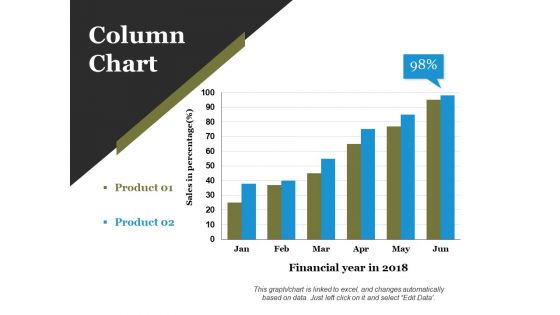
Column Chart Ppt PowerPoint Presentation Infographics Layout Ideas
This is a column chart ppt powerpoint presentation infographics layout ideas. This is a two stage process. The stages in this process are financial year in, business, marketing, growth, graph.
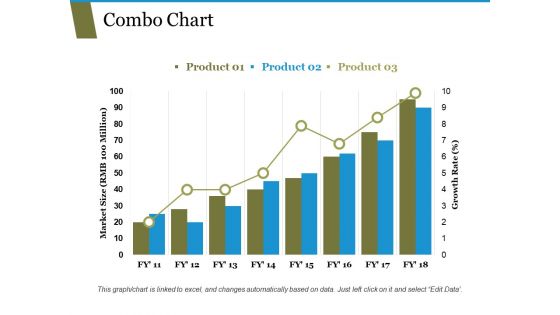
Combo Chart Ppt PowerPoint Presentation Ideas Infographic Template
This is a combo chart ppt powerpoint presentation ideas infographic template. This is a three stage process. The stages in this process are market size growth rate, graph, business, strategy.
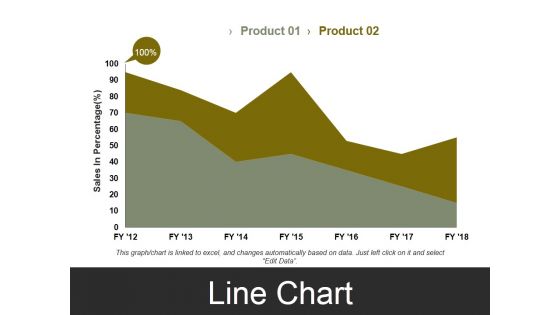
Line Chart Template 3 Ppt PowerPoint Presentation Styles Visual Aids
This is a line chart template 3 ppt powerpoint presentation styles visual aids. This is a two stage process. The stages in this process are sales in percentage, business, marketing, finance, graph.
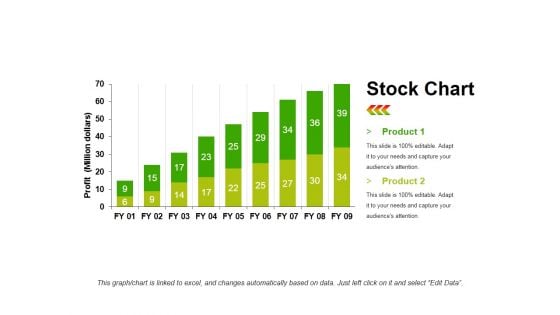
Stock Chart Template 1 Ppt PowerPoint Presentation Infographic Template Objects
This is a stock chart template 1 ppt powerpoint presentation infographic template objects. This is a two stage process. The stages in this process are product, profit, bar graph, growth, success.
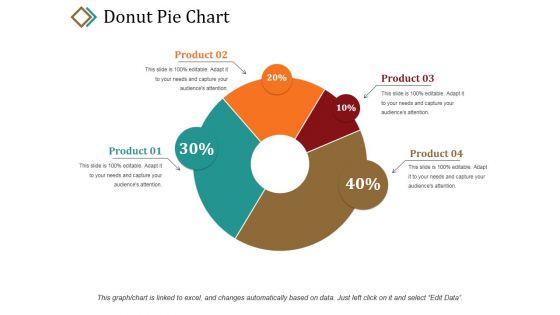
Donut Pie Chart Ppt PowerPoint Presentation Portfolio Graphic Tips
This is a donut pie chart ppt powerpoint presentation portfolio graphic tips. This is a four stage process. The stages in this process are product, percentage, business, marketing, donut.
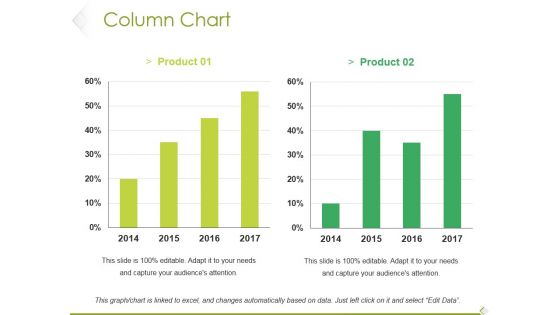
Column Chart Ppt PowerPoint Presentation Model Clipart Images
This is a column chart ppt powerpoint presentation model clipart images. This is a two stage process. The stages in this process are product, bar graph, growth, success, business.
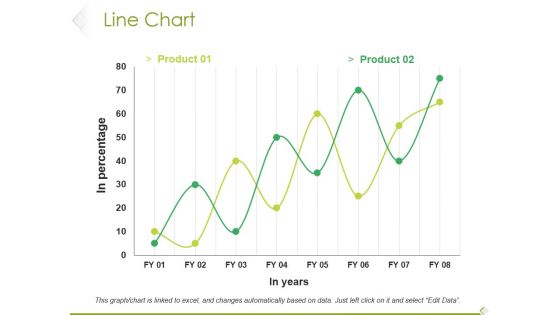
Line Chart Ppt PowerPoint Presentation File Example File
This is a line chart ppt powerpoint presentation file example file. This is a two stage process. The stages in this process are product, in percentage, in years, growth, success.
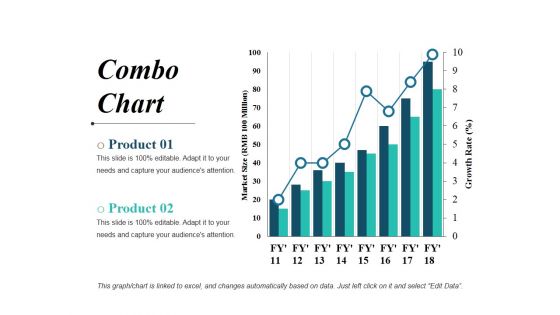
Combo Chart Ppt PowerPoint Presentation File Visual Aids
This is a combo chart ppt powerpoint presentation file visual aids. This is a two stage process. The stages in this process are bar graph, business, marketing, finance, planning.
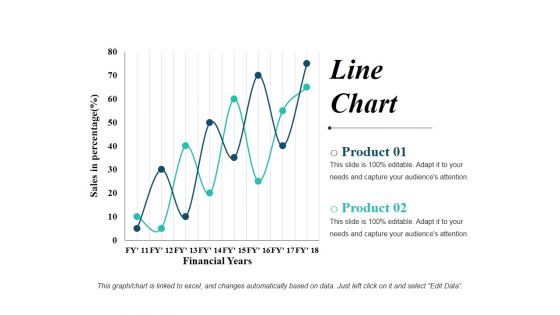
Line Chart Ppt PowerPoint Presentation Show Graphics Design
This is a line chart ppt powerpoint presentation show graphics design. This is a two stage process. The stages in this process are line graph, business, marketing, finance, planning.
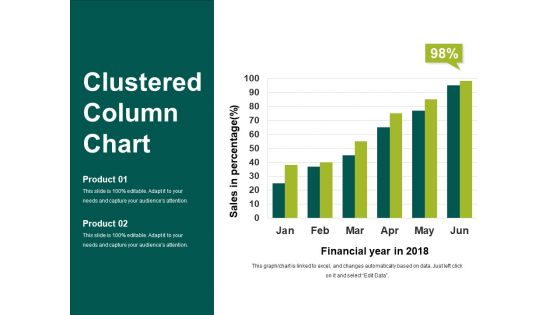
Clustered Column Chart Ppt PowerPoint Presentation Show Slideshow
This is a clustered column chart ppt powerpoint presentation show slideshow. This is a six stage process. The stages in this process are financial year in, sales in percentage, business, marketing, finance.
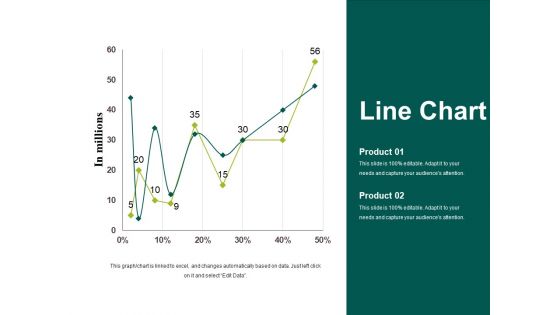
Line Chart Template 1 Ppt PowerPoint Presentation Styles Graphics Tutorials
This is a line chart template 1 ppt powerpoint presentation styles graphics tutorials. This is a two stage process. The stages in this process are in millions, business, marketing, strategy, graph.
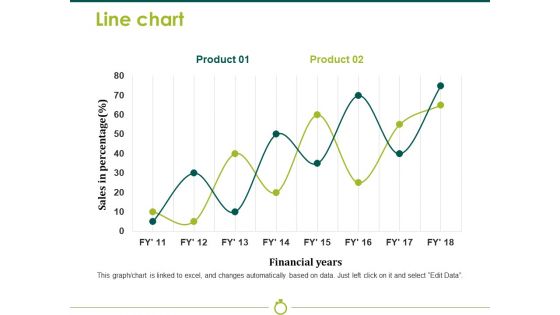
Line Chart Template 2 Ppt PowerPoint Presentation Model Background Image
This is a line chart template 2 ppt powerpoint presentation model background image. This is a two stage process. The stages in this process are sales in percentage, financial years, business, marketing, strategy, graph.
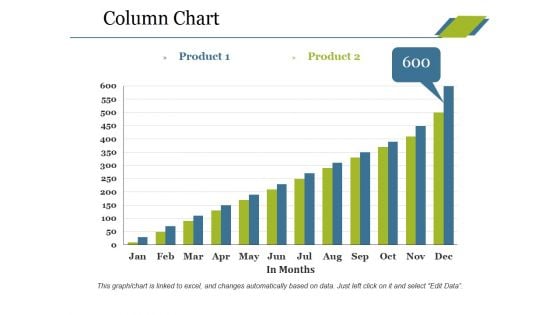
Column Chart Ppt PowerPoint Presentation Layouts Background Images
This is a column chart ppt powerpoint presentation layouts background images. This is a two stage process. The stages in this process are product, in months, graph, growth, success.
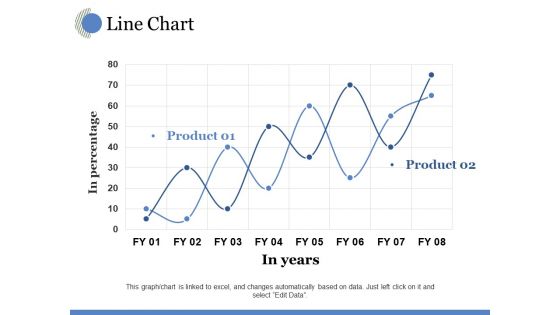
Line Chart Ppt PowerPoint Presentation Model Visual Aids
This is a line chart ppt powerpoint presentation model visual aids. This is a two stage process. The stages in this process are in years, in percentage, growth, business, marketing.

Line Chart Ppt PowerPoint Presentation Gallery Example Topics
This is a line chart ppt powerpoint presentation gallery example topics. This is a two stage process. The stages in this process are in millions, business, marketing, strategy, graph.
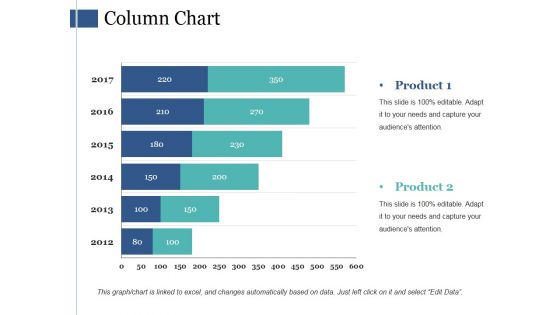
Column Chart Ppt PowerPoint Presentation Model Background Images
This is a column chart ppt powerpoint presentation model background images. This is a six stage process. The stages in this process are bar graph, marketing, finance, strategy, planning.
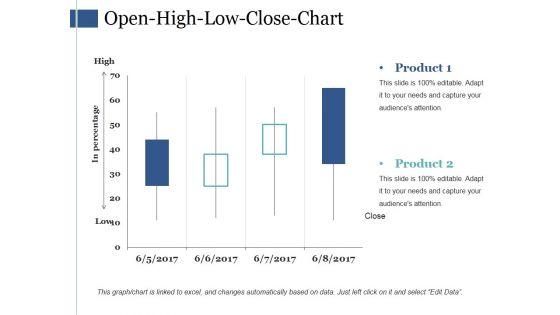
Open High Low Close Chart Ppt PowerPoint Presentation Styles Example
This is a open high low close chart ppt powerpoint presentation styles example. This is a four stage process. The stages in this process are business, marketing, finance, strategy, planning.
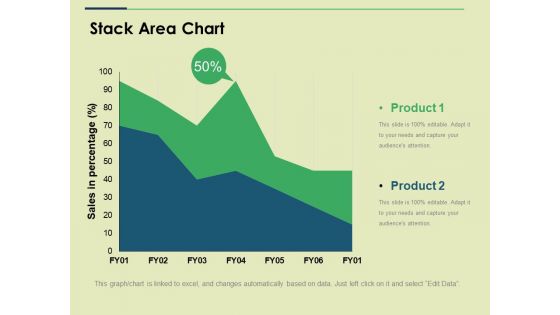
Stack Area Chart Ppt PowerPoint Presentation Show Slide
This is a stack area chart ppt powerpoint presentation show slide. This is a two stage process. The stages in this process are sales in percentage, business, marketing, strategy, graph.
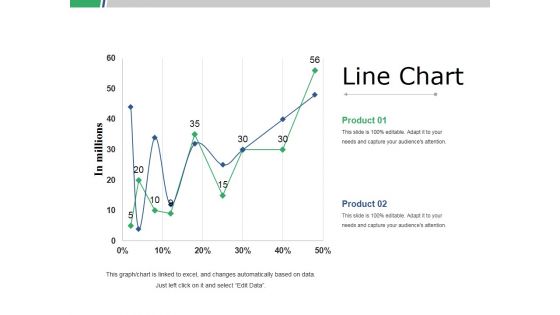
Line Chart Ppt PowerPoint Presentation Slides Graphics Template
This is a line chart ppt powerpoint presentation slides graphics template. This is a two stage process. The stages in this process are business, marketing, strategy, line graph, finance.
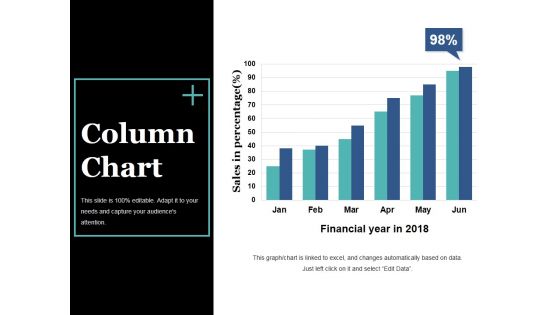
Column Chart Ppt PowerPoint Presentation Slides Visual Aids
This is a column chart ppt powerpoint presentation slides visual aids. This is a six stage process. The stages in this process are bar graph, growth, success, sales in percentage, financial year.
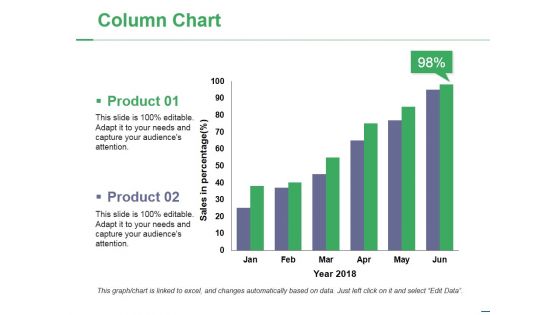
Column Chart Ppt PowerPoint Presentation Portfolio Slide Download
This is a column chart ppt powerpoint presentation portfolio slide download. This is a two stage process. The stages in this process are product, year, bar graph, success, business.
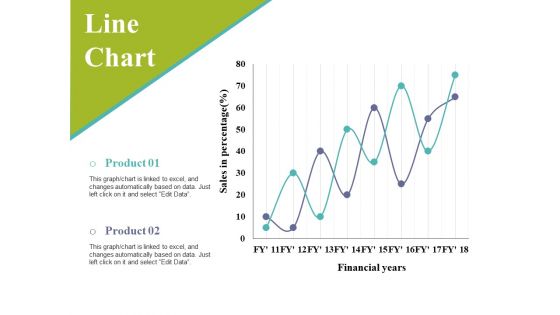
Line Chart Ppt PowerPoint Presentation Infographic Template Slides
This is a line chart ppt powerpoint presentation infographic template slides. This is a two stage process. The stages in this process are sales in percentage, financial years, business, marketing, graph.
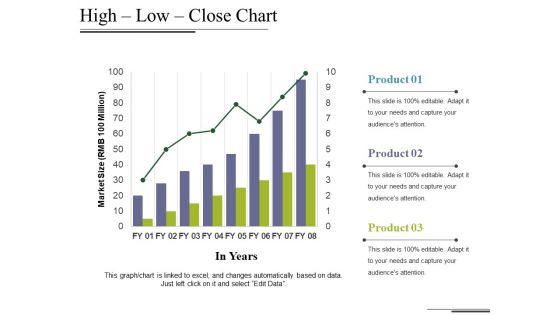
High Low Close Chart Ppt PowerPoint Presentation Styles Maker
This is a high low close chart ppt powerpoint presentation styles maker. This is a three stage process. The stages in this process are market size, in years, growth, business, marketing, graph.
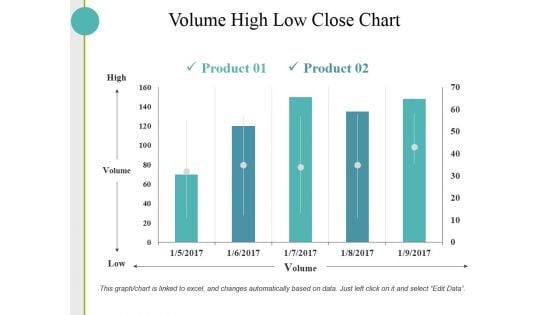
Volume High Low Close Chart Ppt PowerPoint Presentation Inspiration Skills
This is a volume high low close chart ppt powerpoint presentation inspiration skills. This is a two stage process. The stages in this process are high, volume, low, business.
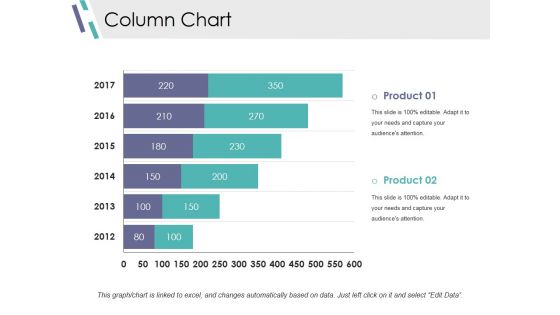
Column Chart Ppt PowerPoint Presentation Infographics Design Inspiration
This is a column chart ppt powerpoint presentation infographics design inspiration. This is a two stage process. The stages in this process are slide bar, marketing, strategy, finance, planning.
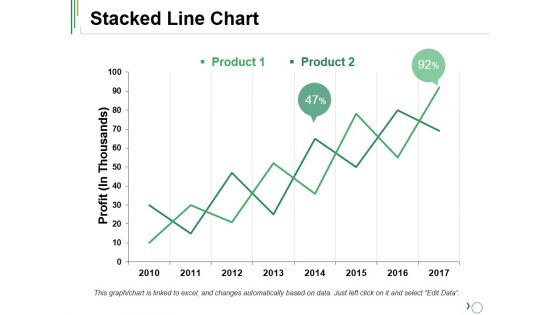
Stacked Line Chart Ppt PowerPoint Presentation Ideas Outfit
This is a stacked line chart ppt powerpoint presentation ideas outfit. This is a two stage process. The stages in this process are product, stacked line, profit, growth, success.
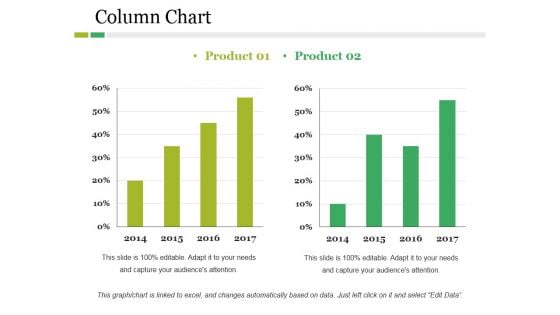
Column Chart Ppt PowerPoint Presentation Layouts Graphics Example
This is a column chart ppt powerpoint presentation layouts graphics example. This is a two stage process. The stages in this process are product, year, bar graph, business, finance.
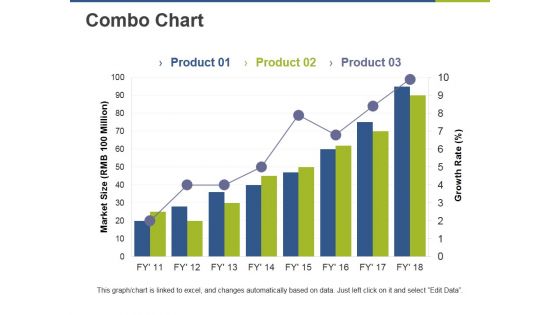
Combo Chart Ppt PowerPoint Presentation Pictures Graphic Images
This is a combo chart ppt powerpoint presentation pictures graphic images. This is a three stage process. The stages in this process are bar graph, growth, market size, growth rate, success.
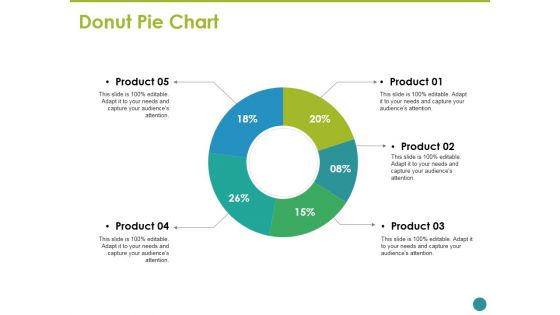
Donut Pie Chart Ppt PowerPoint Presentation Inspiration Graphic Images
This is a donut pie chart ppt powerpoint presentation inspiration graphic images. This is a five stage process. The stages in this process are business, marketing, strategy, planning, donut.
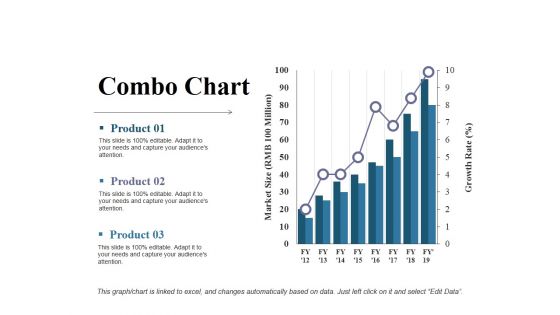
Combo Chart Ppt PowerPoint Presentation Styles Example Introduction
This is a combo chart ppt powerpoint presentation styles example introduction. This is a three stage process. The stages in this process are product, growth rate, market size, growth, success.
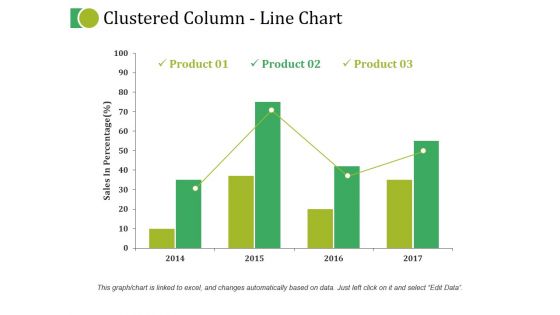
Clustered Column Line Chart Ppt PowerPoint Presentation Inspiration Graphics Pictures
This is a clustered column line chart ppt powerpoint presentation inspiration graphics pictures. This is a four stage process. The stages in this process are business, marketing, strategy, planning, finance.
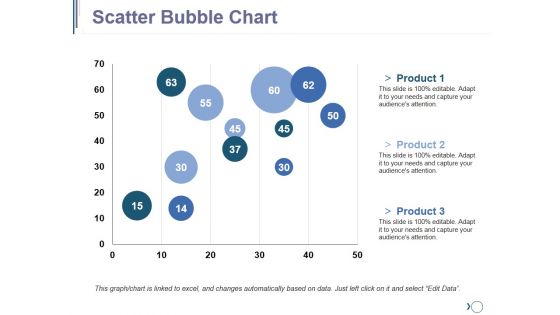
Scatter Bubble Chart Ppt PowerPoint Presentation Outline Graphics Pictures
This is a scatter bubble chart ppt powerpoint presentation outline graphics pictures. This is a three stage process. The stages in this process are finance, planning, business, marketing, strategy.

Column Chart Ppt PowerPoint Presentation Styles Graphics Design
This is a column chart ppt powerpoint presentation styles graphics design. This is a two stage process. The stages in this process are expenditure in, product, years, growth, success.
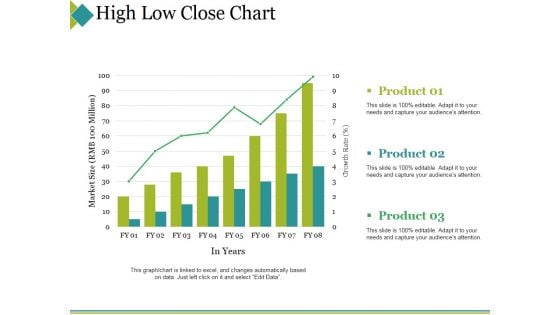
High Low Close Chart Ppt PowerPoint Presentation Portfolio Topics
This is a high low close chart ppt powerpoint presentation portfolio topics. This is a three stage process. The stages in this process are product, market size, in years, success, bar graph.

Column Chart Ppt PowerPoint Presentation Pictures Graphic Images
This is a column chart ppt powerpoint presentation pictures graphic images. This is a two stage process. The stages in this process are product, years, growth, success, bar graph.
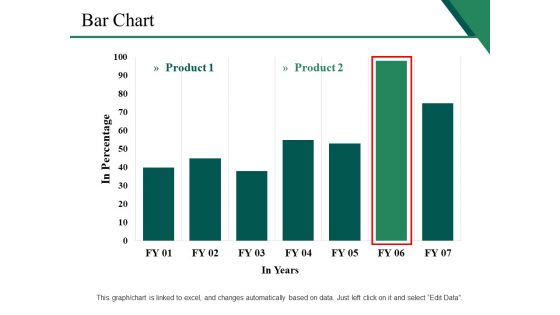
Bar Chart Ppt PowerPoint Presentation Inspiration Background Image
This is a bar chart ppt powerpoint presentation inspiration background image. This is a two stage process. The stages in this process are business, marketing, strategy, finance, in years, in percentage.
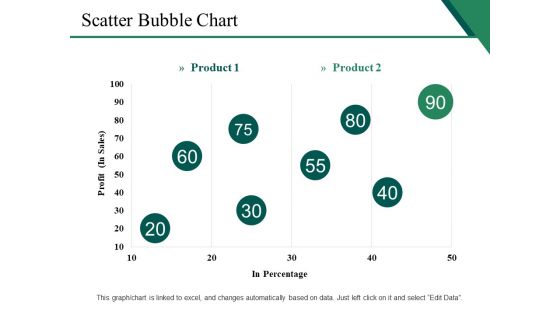
Scatter Bubble Chart Ppt PowerPoint Presentation Gallery Show
This is a scatter bubble chart ppt powerpoint presentation gallery show. This is a two stage process. The stages in this process are profit, in percentage, finance, marketing, business.
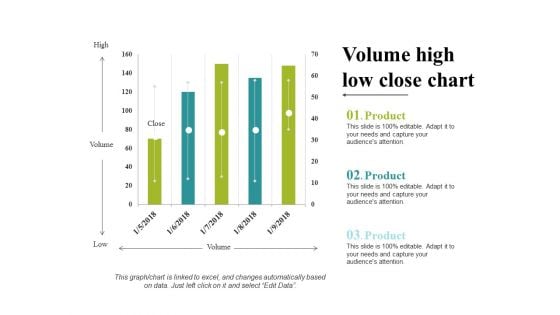
Volume High Low Close Chart Ppt PowerPoint Presentation Portfolio Clipart
This is a volume high low close chart ppt powerpoint presentation portfolio clipart. This is a five stage process. The stages in this process are business, marketing, strategy, planning, finance.
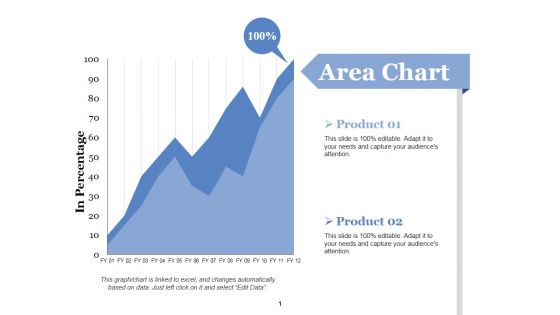
Area Chart Ppt PowerPoint Presentation Portfolio Graphics Design
This is a area chart ppt powerpoint presentation portfolio graphics design. This is a two stage process. The stages in this process are business, marketing, in percentage, graph, finance.
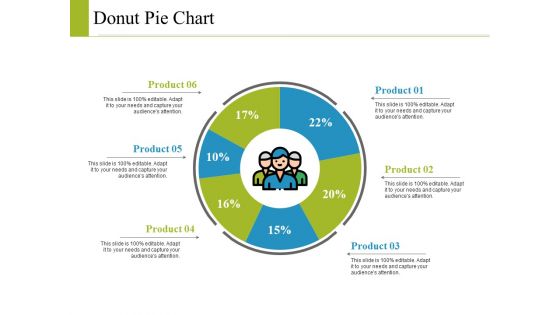
Donut Pie Chart Ppt PowerPoint Presentation Model Graphics Example
This is a donut pie chart ppt powerpoint presentation model graphics example. This is a six stage process. The stages in this process are business, marketing, strategy, planning, finance.
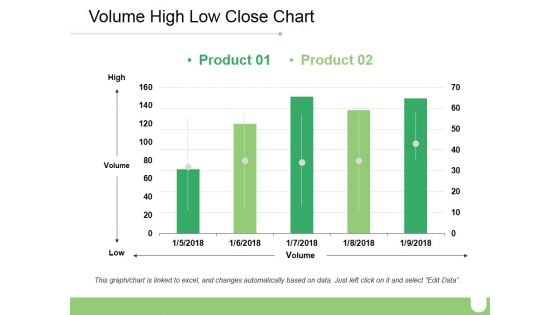
Volume High Low Close Chart Ppt PowerPoint Presentation Inspiration Brochure
This is a volume high low close chart ppt powerpoint presentation inspiration brochure. This is a two stage process. The stages in this process are business, high, volume, low, marketing.
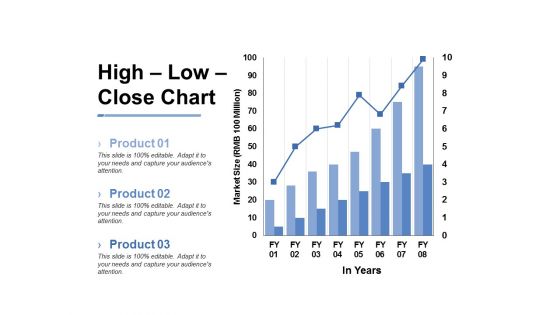
High Low Close Chart Ppt PowerPoint Presentation Inspiration Slide
This is a high low close chart ppt powerpoint presentation inspiration slide. This is a three stage process. The stages in this process are business, marketing, market size, in years, graph.
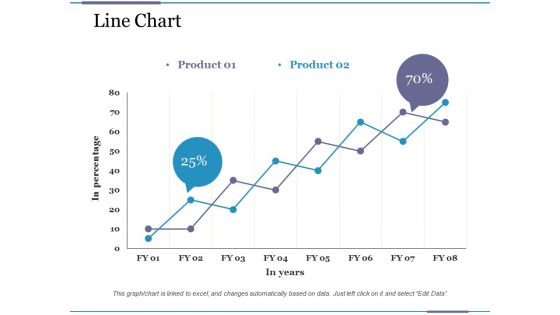
Line Chart Ppt PowerPoint Presentation Pictures File Formats
This is a line chart ppt powerpoint presentation pictures file formats. This is a two stage process. The stages in this process are business, financial, in percentage, in years, graph.
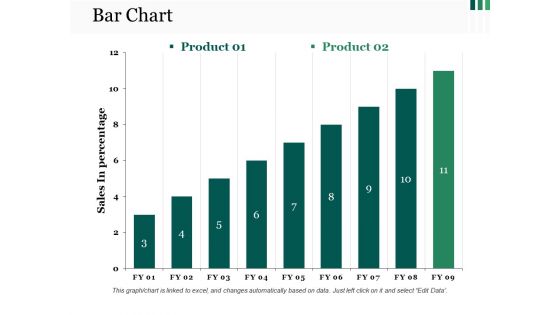
Bar Chart Ppt PowerPoint Presentation Show Format Ideas
This is a bar chart ppt powerpoint presentation show format ideas. This is a two stage process. The stages in this process are bar graph, growth, success, business, marketing.
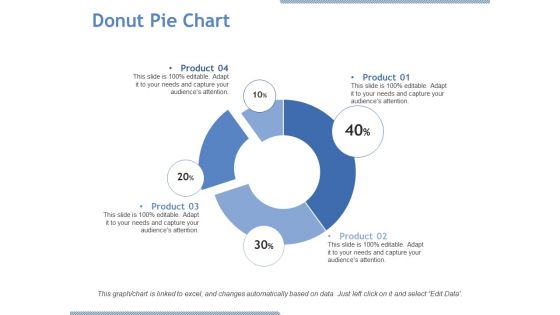
Donut Pie Chart Ppt PowerPoint Presentation Visual Aids Model
This is a donut pie chart ppt powerpoint presentation visual aids model. This is a four stage process. The stages in this process are product, percentage, finance, donut, business.
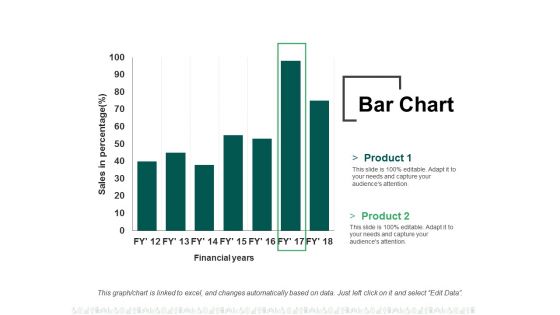
Bar Chart Ppt PowerPoint Presentation Summary File Formats
This is a bar chart ppt powerpoint presentation summary file formats. This is a two stage process. The stages in this process are business, finance, financial years, sales in percentage, graph.

Column Chart Ppt PowerPoint Presentation Layouts Graphic Images
This is a column chart ppt powerpoint presentation layouts graphic images. This is a two stage process. The stages in this process are business, finance, years, graph, expenditure in, marketing.
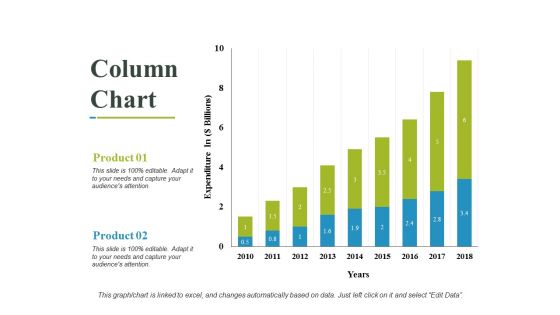
Column Chart Ppt PowerPoint Presentation Outline Design Ideas
This is a column chart ppt powerpoint presentation outline design ideas. This is a two stage process. The stages in this process are business, years, expenditure in, marketing, finance.
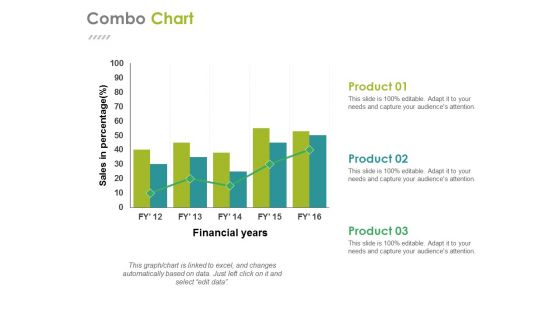
Combo Chart Ppt PowerPoint Presentation Gallery Design Ideas
This is a combo chart ppt powerpoint presentation gallery design ideas. This is a three stage process. The stages in this process are business, financial years, sales in percentage, finance, graph.
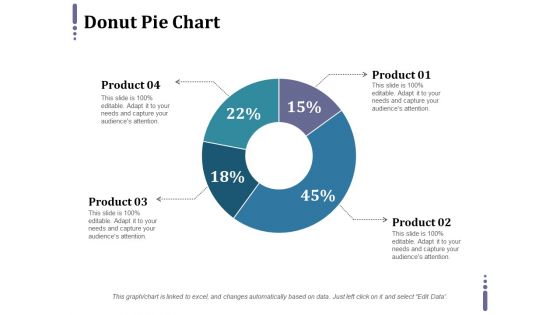
Donut Pie Chart Ppt PowerPoint Presentation Pictures Layout Ideas
This is a donut pie chart ppt powerpoint presentation pictures layout ideas. This is a four stage process. The stages in this process are percentage, finance, donut, business, product.
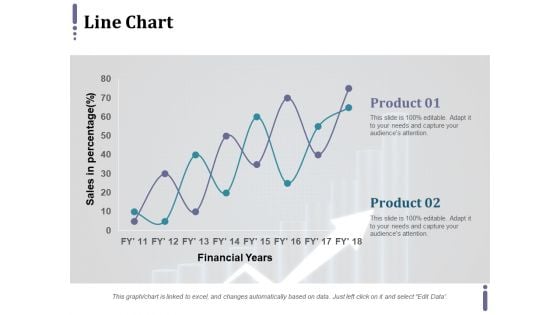
Line Chart Ppt PowerPoint Presentation Infographic Template Master Slide
This is a line chart ppt powerpoint presentation infographic template master slide. This is a two stage process. The stages in this process are product, financial years, sales in percentage.
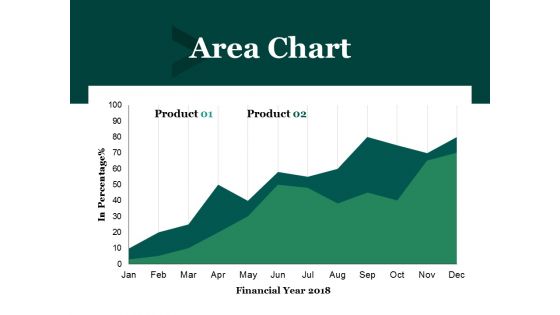
Area Chart Ppt PowerPoint Presentation Outline Graphics Pictures
This is a area chart ppt powerpoint presentation outline graphics pictures. This is a two stage process. The stages in this process are financial year, in percentage, business, marketing, finance.
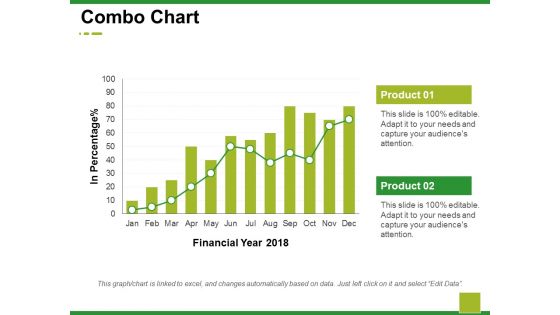
Combo Chart Ppt PowerPoint Presentation Summary Background Images
This is a combo chart ppt powerpoint presentation summary background images. This is a two stage process. The stages in this process are business, marketing, financial year, in percentage, graph.
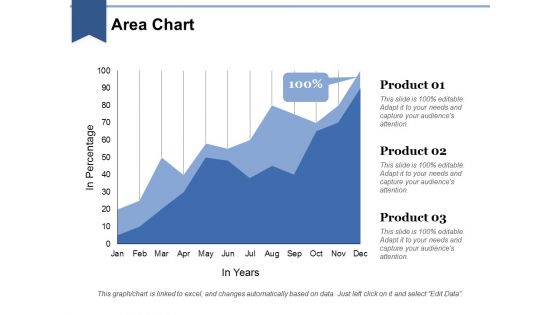
Area Chart Ppt PowerPoint Presentation Layouts Graphic Images
This is a area chart ppt powerpoint presentation layouts graphic images. This is a three stage process. The stages in this process are business, in years, marketing, in percentage, finance, graph.
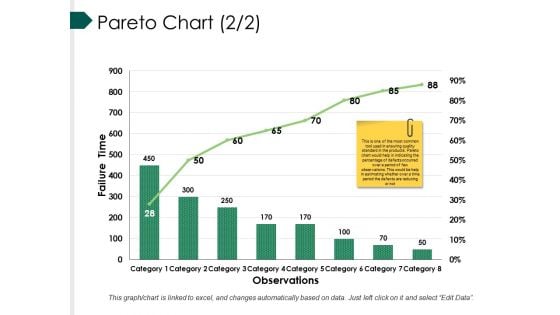
Pareto Chart Template Ppt PowerPoint Presentation Summary Graphic Images
This is a pareto chart template ppt powerpoint presentation summary graphic images. This is a eight stage process. The stages in this process are bar, marketing, strategy, finance, teamwork.
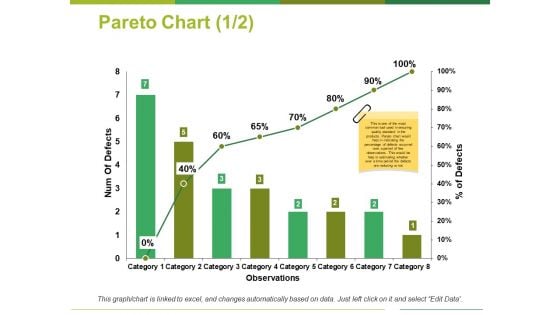
Pareto Chart Template 1 Ppt PowerPoint Presentation Outline Show
This is a pareto chart template 1 ppt powerpoint presentation outline show. This is a eight stage process. The stages in this process are num of defects, percentage of defects, observations, category.
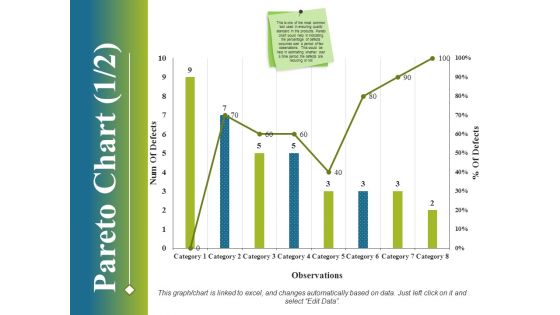
Pareto Chart Template 1 Ppt PowerPoint Presentation File Ideas
This is a pareto chart template 1 ppt powerpoint presentation file ideas. This is a eight stage process. The stages in this process are business, finance, marketing, strategy, analysis.

Regression Line Chart Ppt PowerPoint Presentation Visual Aids Summary
This is a regression line chart ppt powerpoint presentation visual aids summary. This is a two stage process. The stages in this process are linear periodization, linear growth, linear progression.
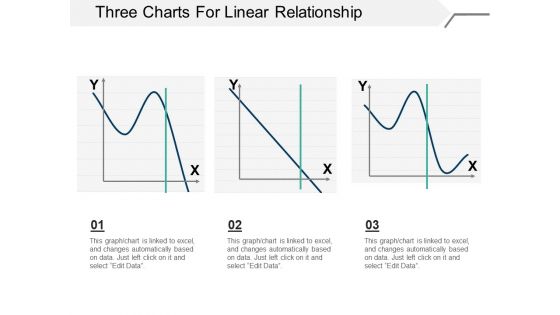
Three Charts For Linear Relationship Ppt PowerPoint Presentation Model Example
This is a three charts for linear relationship ppt powerpoint presentation model example. This is a three stage process. The stages in this process are linear periodization, linear growth, linear progression.
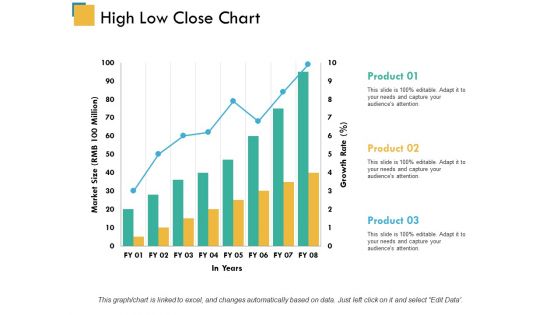
High Low Close Chart Ppt PowerPoint Presentation Model Inspiration
This is a high low close chart ppt powerpoint presentation model inspiration. This is a three stage process. The stages in this process are product, market size, in years.
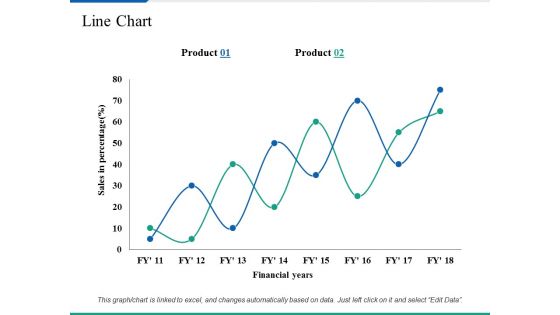
Line Chart Ppt PowerPoint Presentation Summary Clipart Images
This is a line chart ppt powerpoint presentation summary clipart images. This is a two stage process. The stages in this process are business, marketing, sales in percentage, financial years, strategy.
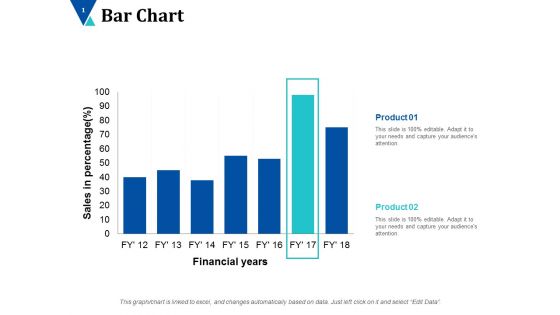
Bar Chart Finance Ppt PowerPoint Presentation Infographics Background Images
This is a bar chart finance ppt powerpoint presentation infographics background images. This is a seven stages process. The stages in this process are alpha testing, beta testing, full scale show.
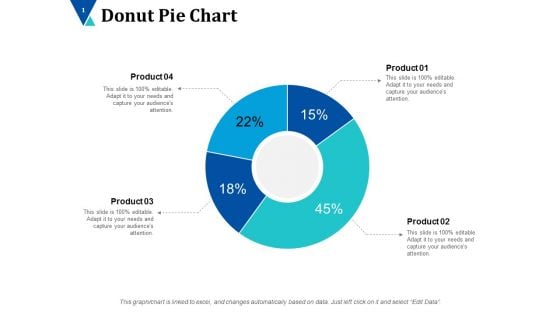
Donut Pie Chart Ppt PowerPoint Presentation Inspiration Designs Download
This is a donut pie chart ppt powerpoint presentation inspiration designs download. This is a four stage process. The stages in this process are donut, business, planning, marketing, finance.
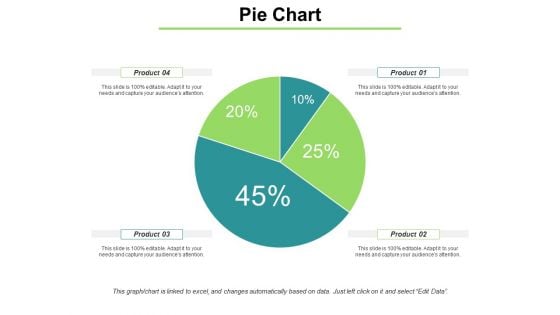
Pie Chart With Distrubation Ppt PowerPoint Presentation Model Ideas
This is a pie chart with distrubation ppt powerpoint presentation model ideas. This is a four stage process. The stages in this process are pie, finance, marketing, strategy, planning.
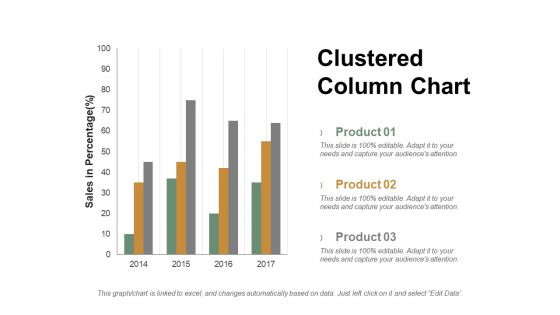
Clustered Column Chart Ppt PowerPoint Presentation Professional Ideas
This is a clustered column chart ppt powerpoint presentation professional ideas. This is a three stage process. The stages in this process are product, sales in percentage, column, years.
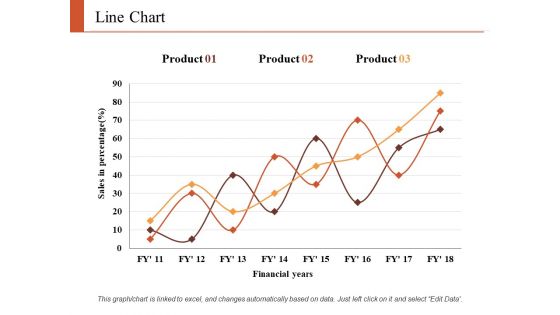
Line Chart Finance Ppt PowerPoint Presentation Infographic Template Graphics Tutorials
This is a line chart finance ppt powerpoint presentation infographic template graphics tutorials. This is a three stage process. The stages in this process are finance, marketing, analysis, business, investment.
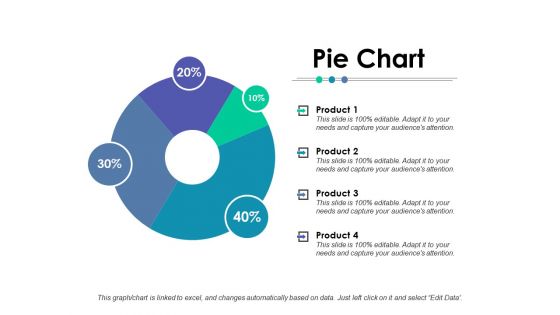
Pie Chart Finance Ppt PowerPoint Presentation Styles File Formats
This is a pie chart finance ppt powerpoint presentation styles file formats. This is a four stage process. The stages in this process are finance, analysis, business, investment, marketing.
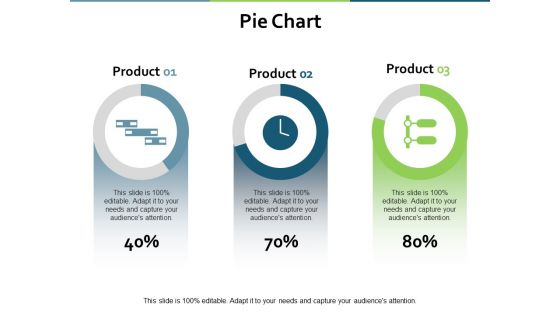
Pie Chart Marketing Finance Ppt PowerPoint Presentation Gallery Good
This is a pie chart marketing finance ppt powerpoint presentation gallery good. This is a three stage process. The stages in this process are finance, analysis, business, investment, marketing.
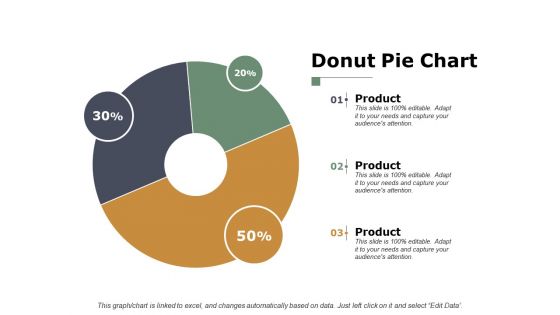
Donut Pie Chart Finance Ppt PowerPoint Presentation Inspiration Graphics
This is a donut pie chart finance ppt powerpoint presentation inspiration graphics. This is a three stage process. The stages in this process are finance, analysis, business, investment, marketing.
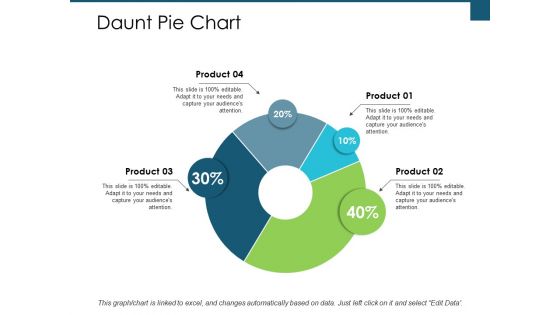
Daunt Pie Chart Investment Ppt PowerPoint Presentation Infographic Template Aids
This is a daunt pie chart investment ppt powerpoint presentation infographic template aids. This is a four stage process. The stages in this process are finance, analysis, business, investment, marketing.
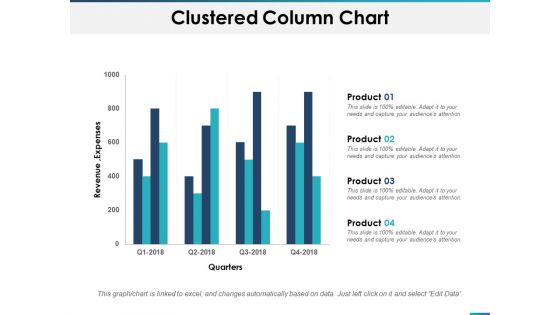
Clustered Column Chart Planning Ppt PowerPoint Presentation Portfolio Information
This is a clustered column chart planning ppt powerpoint presentation portfolio information. This is a four stage process. The stages in this process are finance, marketing, analysis, business, investment.
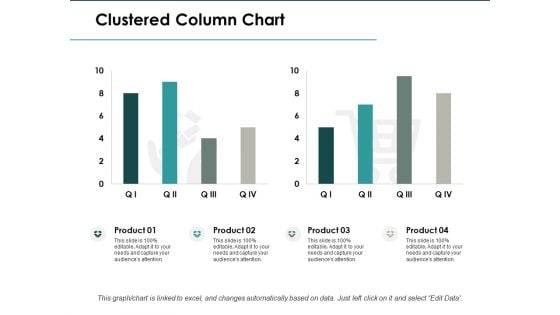
Clustered Column Chart Investment Ppt PowerPoint Presentation Infographic Template Clipart
This is a clustered column chart investment ppt powerpoint presentation infographic template clipart. This is a four stage process. The stages in this process are finance, analysis, business, investment, marketing.
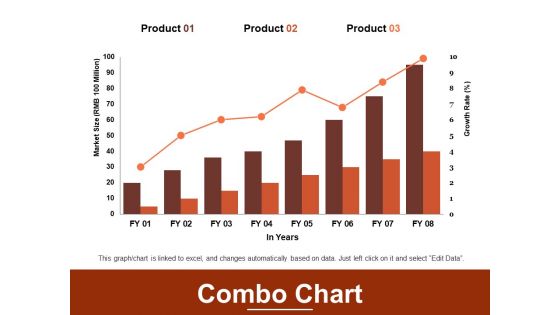
Combo Chart Finance Marketing Ppt PowerPoint Presentation File Guidelines
This is a combo chart finance marketing ppt powerpoint presentation file guidelines. This is a three stage process. The stages in this process are finance, analysis, business, investment, marketing.
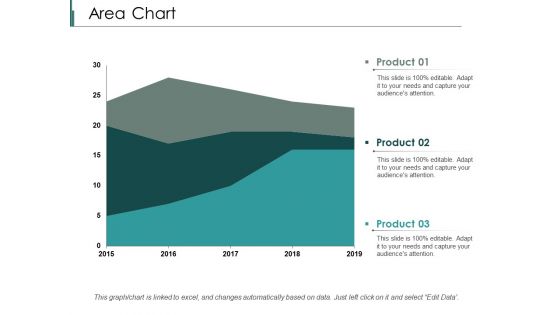
Area Chart Finance Ppt PowerPoint Presentation Styles Designs Download
This is a area chart finance ppt powerpoint presentation styles designs download. This is a three stage process. The stages in this process are finance, analysis, business, investment, marketing.
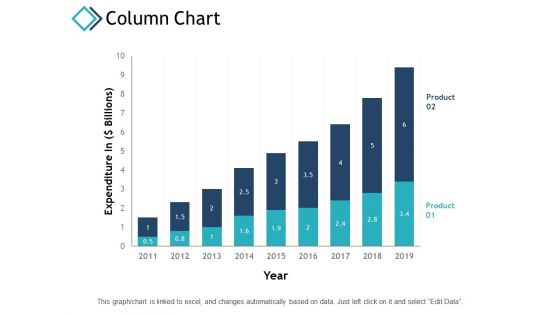
Column Chart Finance Investment Ppt PowerPoint Presentation Inspiration Template
This is a column chart finance investment ppt powerpoint presentation inspiration template. This is a two stage process. The stages in this process are finance, analysis, business, investment, marketing.
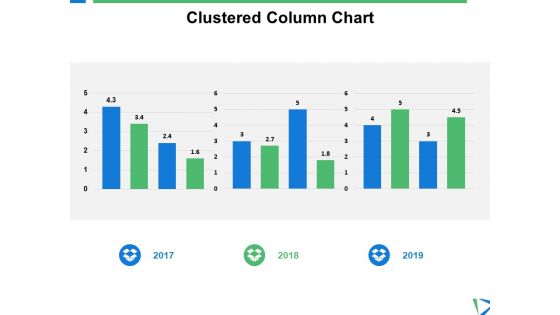
Clustered Column Chart Finance Ppt PowerPoint Presentation Gallery Styles
This is a clustered column chart finance ppt powerpoint presentation gallery styles. This is a three stage process. The stages in this process are finance, analysis, business, investment, marketing.
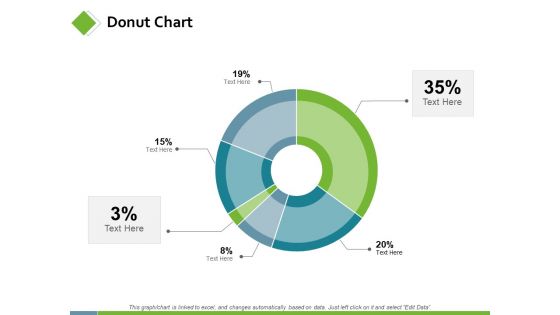
Donut Chart Marketing Planning Ppt PowerPoint Presentation Model Slideshow
This is a donut chart marketing planning ppt powerpoint presentation model slideshow. This is a six stage process. The stages in this process are finance, analysis, business, investment, marketing.
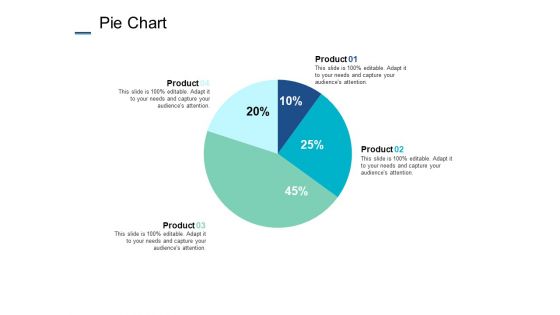
Pie Chart Finance Marketing Ppt PowerPoint Presentation Styles Outfit
This is a pie chart finance marketing ppt powerpoint presentation styles outfit. This is a four stage process. The stages in this process are finance, analysis, business, investment, marketing.
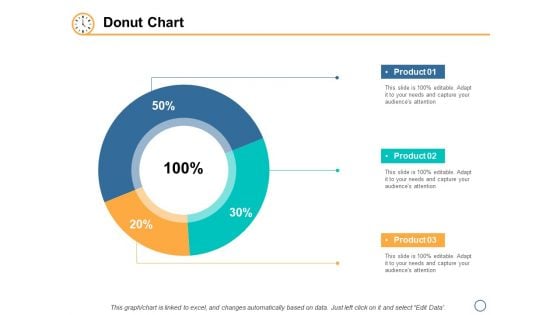
Pie Chart Marketing Finance Ppt PowerPoint Presentation File Guidelines
This is a pie chart marketing finance ppt powerpoint presentation file guidelines. This is a three stage process. The stages in this process are finance, analysis, business, investment, marketing.
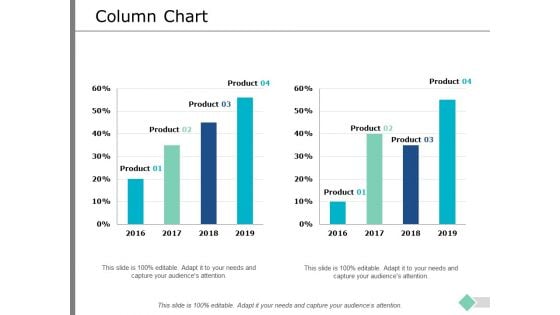
Column Chart Marketing Finance Ppt PowerPoint Presentation Infographic Template Rules
This is a column chart marketing finance ppt powerpoint presentation infographic template rules. This is a two stage process. The stages in this process are finance, analysis, business, investment, marketing.
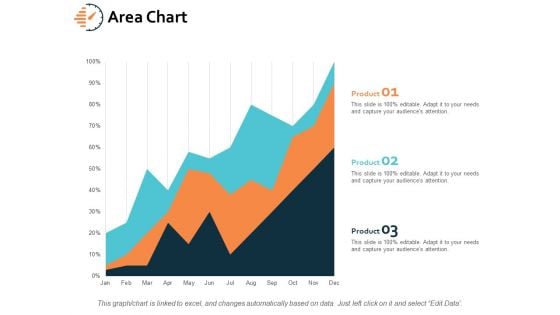
Area Chart Finance Marketing Ppt PowerPoint Presentation Gallery Graphics Design
This is a area chart finance marketing ppt powerpoint presentation gallery graphics design. This is a three stage process. The stages in this process are finance, analysis, business, investment, marketing.
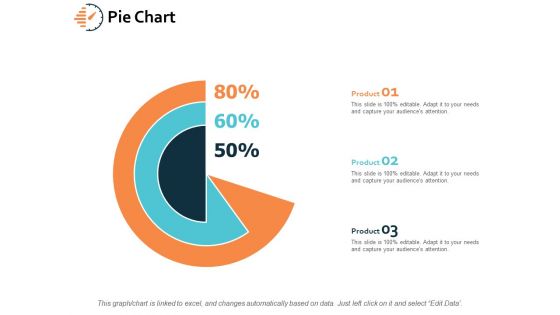
Pie Chart Investment Finance Ppt PowerPoint Presentation File Influencers
This is a pie chart investment finance ppt powerpoint presentation file influencers. This is a three stage process. The stages in this process are finance, analysis, business, investment, marketing.
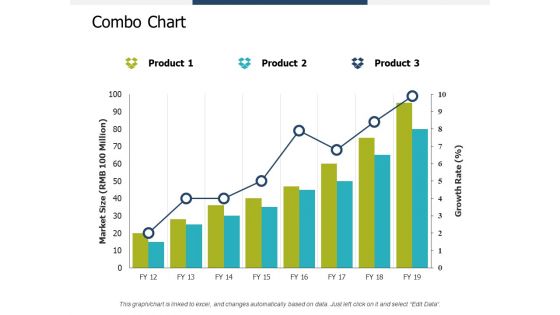
Combo Chart Investment Ppt PowerPoint Presentation Summary Infographic Template
This is a combo chart investment ppt powerpoint presentation summary infographic template. This is a three stage process. The stages in this process are finance, analysis, business, investment, marketing.
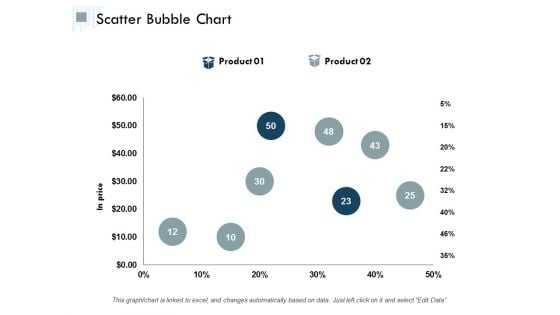
Scatter Bubble Chart Ppt PowerPoint Presentation Infographic Template Graphics Design
This is a scatter bubble chart ppt powerpoint presentation infographic template graphics design. This is a two stage process. The stages in this process are finance, analysis, business, investment, marketing.
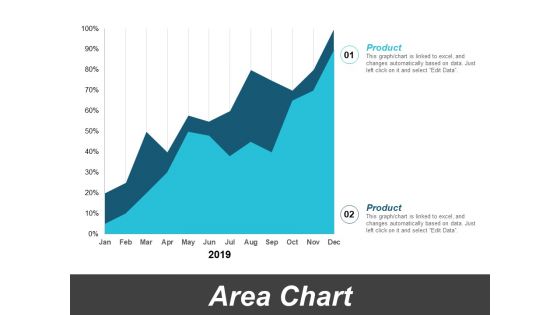
Area Chart Marketing Finance Ppt PowerPoint Presentation Ideas Elements
This is a area chart marketing finance ppt powerpoint presentation ideas elements. This is a two stage process. The stages in this process are finance, analysis, business, investment, marketing.
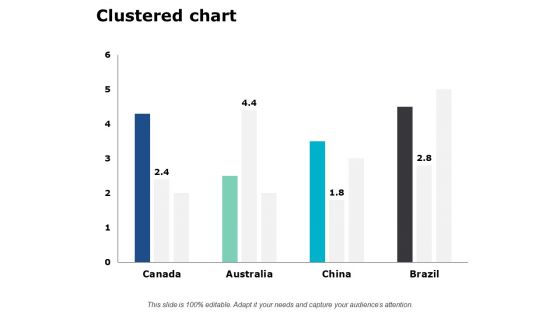
Clustered Chart Finance Marketing Ppt PowerPoint Presentation Layouts Outfit
This is a clustered chart finance marketing ppt powerpoint presentation layouts outfit. This is a four stage process. The stages in this process are finance, analysis, business, investment, marketing.
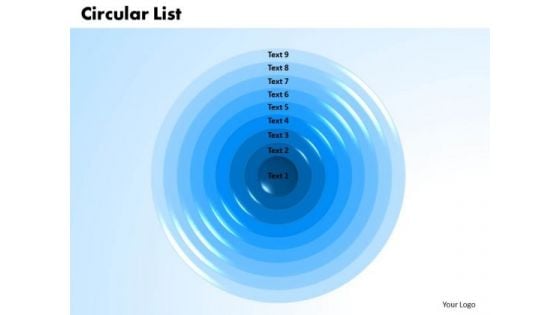
PowerPoint Slide Circular List Marketing Ppt Designs
PowerPoint Slide Circular List Marketing PPT Designs-Use to awesome List and text boxes powerpoint templates to create awesome marketing and sales priority lists or any other types of lists.-PowerPoint Slide Circular List Marketing PPT Designs-Account, Advertise, Analyze, Arrow, Brochure, Business, Catalog, Chart, Circular, Commercial, Competition, Concentric, Cyclic, Demonstration, Description, Diagram, Financial, Goals, Illustration, Information, Label, List, Management, Marketing, Note, Organization, Plan, Profit, Promote, Records, Recursive, Registry, Report, Research, Ring, Sale, Six, Spherical, Statement, Strategy, Structure, Success, Symbol Become a contributor with our PowerPoint Slide Circular List Marketing Ppt Designs. You will come out on top.
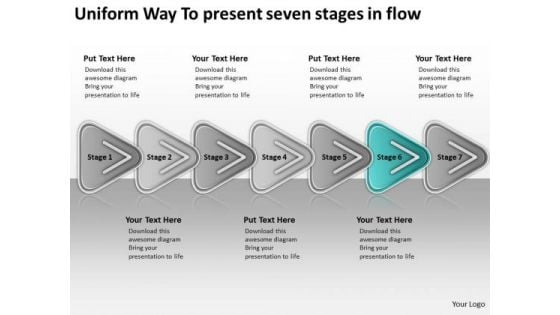
Way To Present Seven Stages In Flow Free Simple Business Plan Template PowerPoint Slides
We present our way to present seven stages in flow free simple business plan template PowerPoint Slides.Download our Process and Flows PowerPoint Templates because the mind is always whirring with new ideas. Download and present our Shapes PowerPoint Templates because with the help of our Slides you can Illustrate your ideas one by one and demonstrate how each is an important cog in running the entire wheel. Download and present our Arrows PowerPoint Templates because you can see In any endeavour people matter most. Download our Flow charts PowerPoint Templates because you should Demonstrate how you think out of the box. Present our Business PowerPoint Templates because you too have got the framework of your companys growth in place.Use these PowerPoint slides for presentations relating to Abstract, algorithm, arrows, arrows chart, block, block diagram, business, chart, color, connection, design, development, diagram, direction, element, flow, flow chart, flow diagram, flowchart, graph, kind of diagram, linear, linear diagram, management, model, module, motion, organization, plan, process, process arrows. The prominent colors used in the PowerPoint template are Green, Black, Gray. The feedback we get is that our way to present seven stages in flow free simple business plan template PowerPoint Slides are Romantic. The feedback we get is that our block PowerPoint templates and PPT Slides are Nostalgic. People tell us our way to present seven stages in flow free simple business plan template PowerPoint Slides are Whimsical. We assure you our arrows PowerPoint templates and PPT Slides are Adorable. We assure you our way to present seven stages in flow free simple business plan template PowerPoint Slides are Lush. The feedback we get is that our arrows PowerPoint templates and PPT Slides are Chic. Dive into the deep end with our Way To Present Seven Stages In Flow Free Simple Business Plan Template PowerPoint Slides. They assist you in staying afloat.
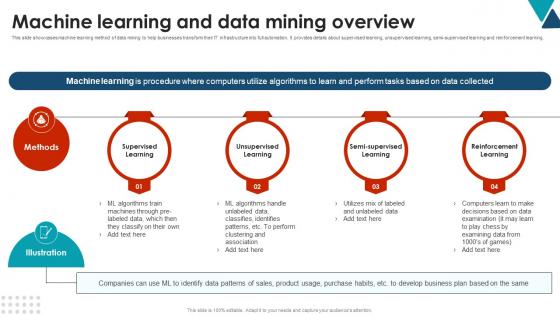
Machine Learning And Data Mining Overview Using Data Mining Tools To Optimize Processes AI SS V
This slide showcases machine learning method of data mining to help businesses transform their IT infrastructure into full automation. It provides details about supervised learning, unsupervised learning, semi-supervised learning and reinforcement learning. Are you searching for a Machine Learning And Data Mining Overview Using Data Mining Tools To Optimize Processes AI SS V that is uncluttered, straightforward, and original Its easy to edit, and you can change the colors to suit your personal or business branding. For a presentation that expresses how much effort you have put in, this template is ideal With all of its features, including tables, diagrams, statistics, and lists, its perfect for a business plan presentation. Make your ideas more appealing with these professional slides. Download Machine Learning And Data Mining Overview Using Data Mining Tools To Optimize Processes AI SS V from Slidegeeks today. This slide showcases machine learning method of data mining to help businesses transform their IT infrastructure into full automation. It provides details about supervised learning, unsupervised learning, semi-supervised learning and reinforcement learning.
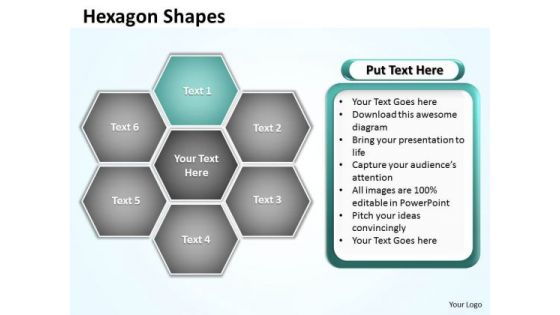
Ppt Hexagon Angles Chart Editable PowerPoint Templates 2010 Business
PPT hexagon angles chart editable powerpoint templates 2010 Business-Use this diagram as a method of graphically representing the flow of data as an information processing system. Use this PPT to represent data that is easy to comprehend and analyze. This PowerPoint diagram can be used in strategy, consulting and marketing presentations. You can apply other 3D Styles and shapes to the slide to enhance your presentations.-PPT hexagon angles chart editable powerpoint templates 2010 Business-Abstract, Background, Design, Digital, Elements, Graphic, Grey, Hexagon, Illustration, Light, Modern, Perspective, Triangles, Shapes, Shiny, Style, Technology, Template, Vector, Vertical, Virtual, Wallpaper, Web Our Ppt Hexagon Angles Chart Editable PowerPoint Templates 2010 Business have a everlasting effect. They remain in the memory for ages.
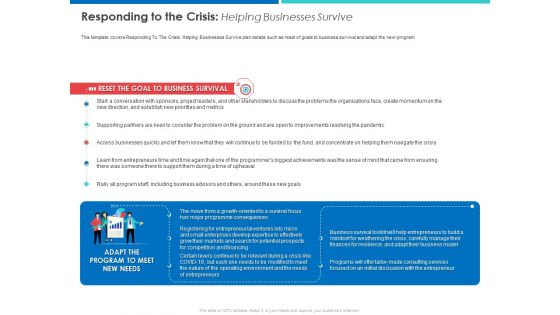
Accelerating COVID 19 Recovery In Maritime Sector Responding To The Crisis Helping Businesses Survive Diagrams PDF
This template covers Responding To The Crisis Helping Businesses Survive plan details such as reset of goals to business survival and adapt the new program Deliver and pitch your topic in the best possible manner with this accelerating COVID 19 recovery in maritime sector responding to the crisis helping businesses survive diagrams pdf. Use them to share invaluable insights on reset the goal to business survival, supporting partners are keen to consider the problem, access businesses quickly and let them know that they will continue and impress your audience. This template can be altered and modified as per your expectations. So, grab it now.
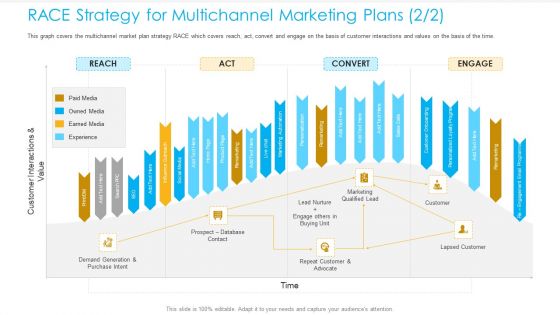
Unified Business Consumer Marketing Strategy RACE Strategy Multichannel Marketing Plans Marketing Diagrams PDF
This graph covers the multichannel market plan strategy RACE which covers reach, act, convert and engage on the basis of customer interactions and values on the basis of the time.Deliver an awe-inspiring pitch with this creative unified business consumer marketing strategy race strategy multichannel marketing plans marketing diagrams pdf bundle. Topics like demand generation and purchase intent, prospect database contact, repeat customer and advocate can be discussed with this completely editable template. It is available for immediate download depending on the needs and requirements of the user.
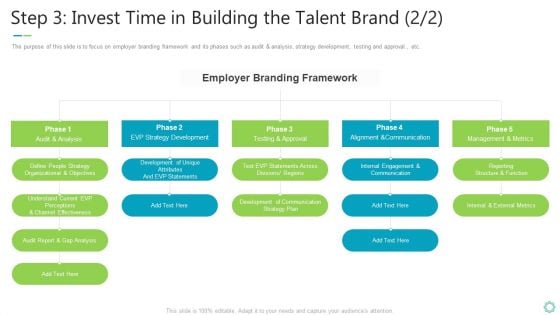
Transforming Organizational Processes And Outcomes Step 3 Invest Time In Building The Talent Brand Metrics Template PDF
The purpose of this slide is to focus on employer branding framework and its phases such as audit and analysis, strategy development, testing and approval., etc. This is a transforming organizational processes and outcomes step 3 invest time in building the talent brand metrics template pdf template with various stages. Focus and dispense information on five stages using this creative set, that comes with editable features. It contains large content boxes to add your information on topics like audit and analysis, evp strategy development, testing and approval, alignment and communication, management and metrics. You can also showcase facts, figures, and other relevant content using this PPT layout. Grab it now.
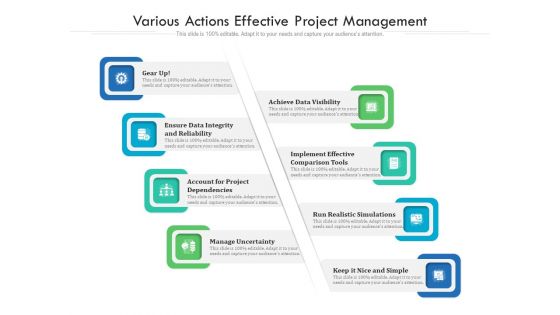
Various Actions Effective Project Management Ppt PowerPoint Presentation File Graphics PDF
Presenting various actions effective project management ppt powerpoint presentation file graphics pdf to dispense important information. This template comprises eight stages. It also presents valuable insights into the topics including manage uncertainty, data visibility, comparison tools. This is a completely customizable PowerPoint theme that can be put to use immediately. So, download it and address the topic impactfully.
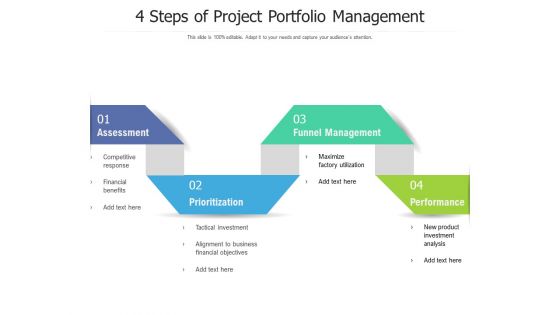
4 Steps Of Project Portfolio Management Ppt PowerPoint Presentation File Graphics Download PDF
Presenting 4 steps of project portfolio management ppt powerpoint presentation file graphics download pdf to dispense important information. This template comprises four stages. It also presents valuable insights into the topics including assessment, prioritization, funnel management. This is a completely customizable PowerPoint theme that can be put to use immediately. So, download it and address the topic impactfully.
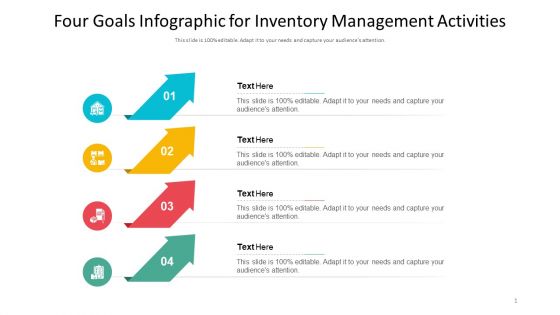
Four Goals Infographic For Inventory Management Activities Ppt PowerPoint Presentation Styles Inspiration PDF
Presenting four goals infographic for inventory management activities ppt powerpoint presentation styles inspiration pdf to dispense important information. This template comprises four stages. It also presents valuable insights into the topics including four goals infographic for inventory management activities. This is a completely customizable PowerPoint theme that can be put to use immediately. So, download it and address the topic impactfully.
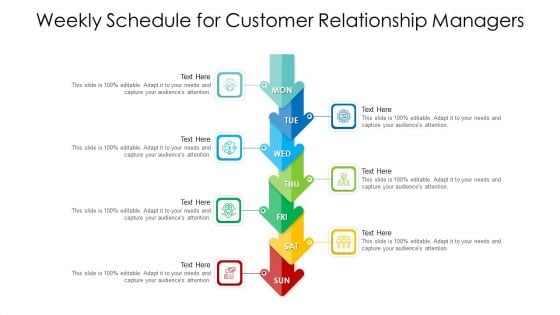
Weekly Schedule For Customer Relationship Managers Ppt PowerPoint Presentation Infographic Template Guide PDF
Presenting weekly schedule for customer relationship managers ppt powerpoint presentation infographic template guide pdf to dispense important information. This template comprises seven stages. It also presents valuable insights into the topics including weekly schedule for customer relationship managers. This is a completely customizable PowerPoint theme that can be put to use immediately. So, download it and address the topic impactfully.

Weekly Schedule For Production And Operations Management Ppt PowerPoint Presentation Infographic Template Examples PDF
Presenting weekly schedule for production and operations management ppt powerpoint presentation infographic template examples pdf to dispense important information. This template comprises seven stages. It also presents valuable insights into the topics including weekly schedule for production and operations management. This is a completely customizable PowerPoint theme that can be put to use immediately. So, download it and address the topic impactfully.
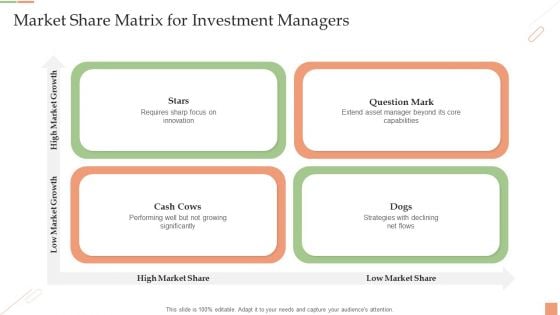
Market Share Matrix For Investment Managers Ppt PowerPoint Presentation Infographic Template Brochure PDF
Presenting Market Share Matrix For Investment Managers Ppt PowerPoint Presentation Infographic Template Brochure PDF to dispense important information. This template comprises four stages. It also presents valuable insights into the topics including requires sharp, asset manager, strategies with declining. This is a completely customizable PowerPoint theme that can be put to use immediately. So, download it and address the topic impactfully.
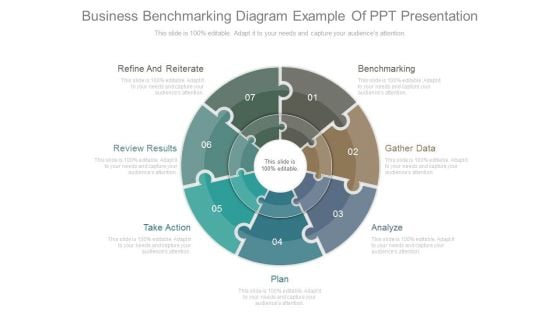
Business Benchmarking Diagram Example Of Ppt Presentation
This is a business benchmarking diagram example of ppt presentation. This is a seven stage process. The stages in this process are refine and reiterate, review results, take action, plan, analyze, gather data, benchmarking.
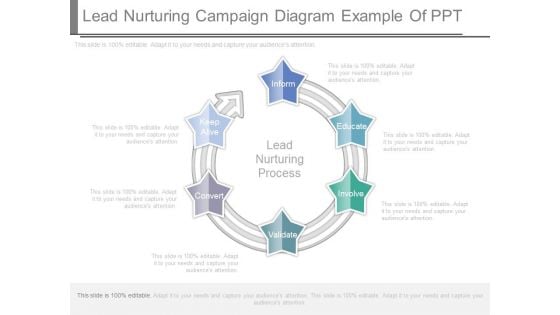
Lead Nurturing Campaign Diagram Example Of Ppt
This is a lead nurturing campaign diagram example of ppt. This is a six stage process. The stages in this process are inform, educate, involve, validate, convert, keep alive.
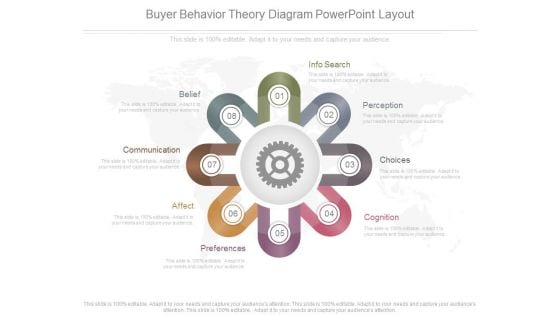
Buyer Behavior Theory Diagram Powerpoint Layout
This is a buyer behavior theory diagram powerpoint layout. This is an eight stage process. The stages in this process are belief, communication, affect, preferences, cognition, choices, perception, info search.
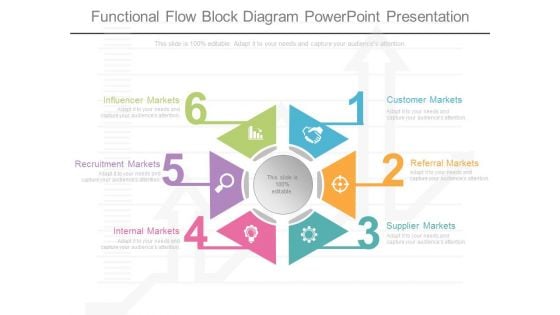
Functional Flow Block Diagram Powerpoint Presentation
This is a functional flow block diagram powerpoint presentation. This is a six stage process. The stages in this process are influencer markets, recruitment markets, internal markets, customer markets, referral markets, supplier markets.
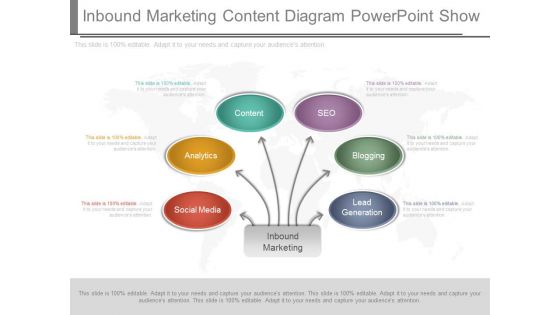
Inbound Marketing Content Diagram Powerpoint Show
This is an inbound marketing content diagram powerpoint show. This is a six stage process. The stages in this process are social media, analytics, content, seo, blogging, lead generation.

Sample Of Sensory Marketing Diagram Ppt Sample
This is a sample of sensory marketing diagram ppt sample. This is a five stage process. The stages in this process are touch, taste, hear, smell, sight, sensory marketing.
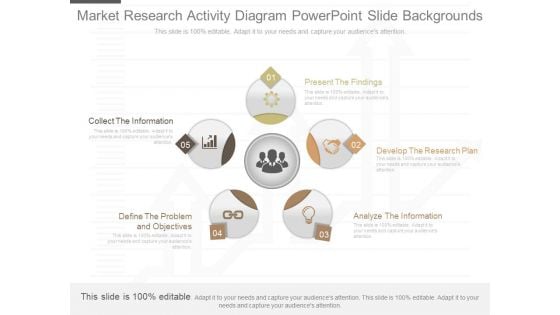
Market Research Activity Diagram Powerpoint Slide Backgrounds
This is a market research activity diagram powerpoint slide backgrounds. This is a five stage process. The stages in this process are collect the information, define the problem and objectives, present the findings, develop the research plan, analyze the information.
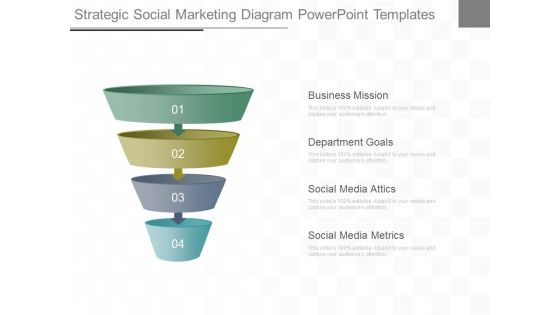
Strategic Social Marketing Diagram Powerpoint Templates
This is a strategic social marketing diagram powerpoint templates. This is a four stage process. The stages in this process are business mission, department goals, social media attics, social media metrics.
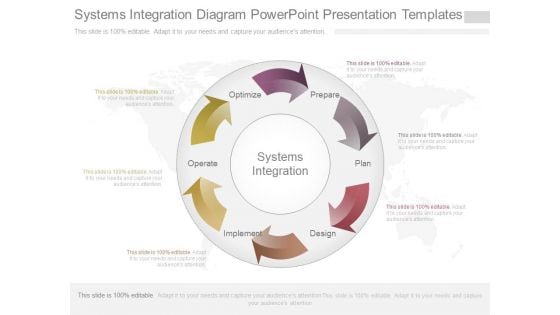
Systems Integration Diagram Powerpoint Presentation Templates
This is a systems integration diagram powerpoint presentation templates. This is a six stage process. The stages in this process are systems integration, implement, design, plan, prepare, optimize, operate.
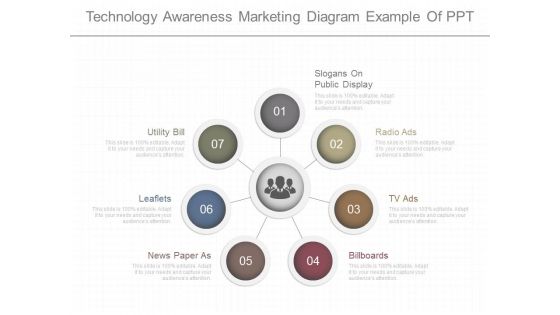
Technology Awareness Marketing Diagram Example Of Ppt
This is a technology awareness marketing diagram example of ppt. This is a seven stage process. The stages in this process are utility bill, leaflets, news paper as billboards, tv ads, radio ads, slogans on public display.
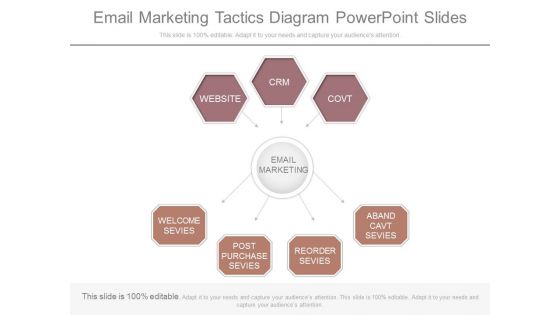
Email Marketing Tactics Diagram Powerpoint Slides
This is a email marketing tactics diagram powerpoint slides. This is a seven stage process. The stages in this process are website, crm, covt, email marketing, welcome sevies, post purchase sevies, reorder sevies, aband cavt sevies.
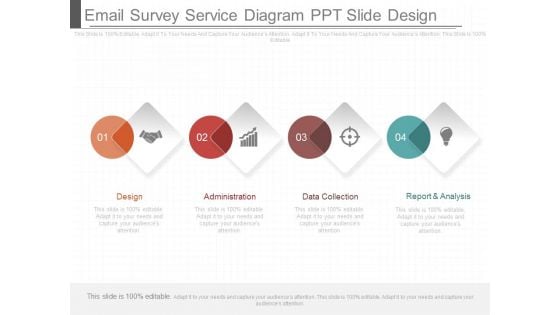
Email Survey Service Diagram Ppt Slide Design
This is a email survey service diagram ppt slide design. This is a four stage process. The stages in this process are design, administration, data collection, report and analysis.
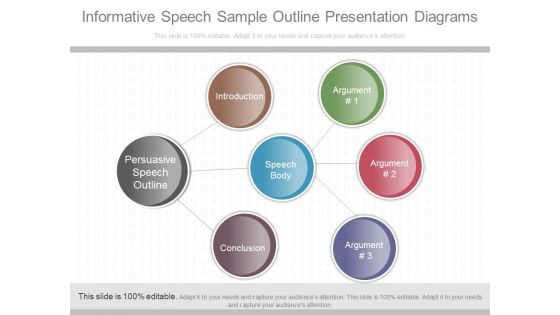
Informative Speech Sample Outline Presentation Diagrams
This is a informative speech sample outline presentation diagrams. This is a seven stage process. The stages in this process are introduction, argument, speech body, conclusion, persuasive speech outline.
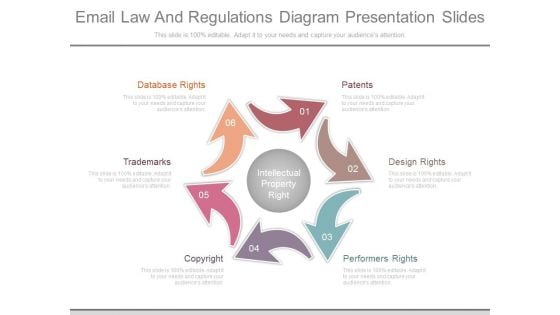
Email Law And Regulations Diagram Presentation Slides
This is a email law and regulations diagram presentation slides. This is a six stage process. The stages in this process are patents, design rights, performers rights, copyright, trademarks, database rights.
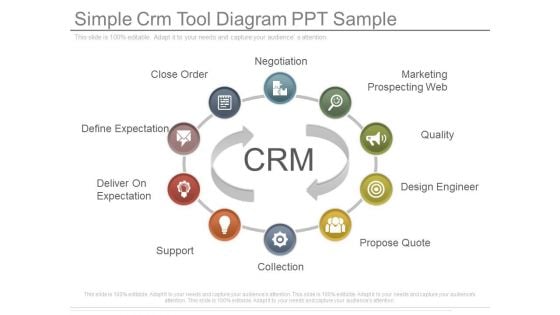
Simple Crm Tool Diagram Ppt Sample
This is a simple crm tool diagram ppt sample. This is a ten stage process. The stages in this process are close order, define expectation, deliver on expectation, support, collection, propose quote, design engineer, quality, marketing prospecting web, negotiation.
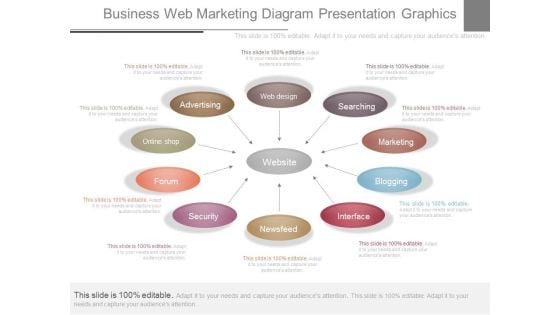
Business Web Marketing Diagram Presentation Graphics
This is a business web marketing diagram presentation graphics. This is a ten stage process. The stages in this process are web design, searching, marketing, blogging, interface, newsfeed, security, forum, online shop, advertising.
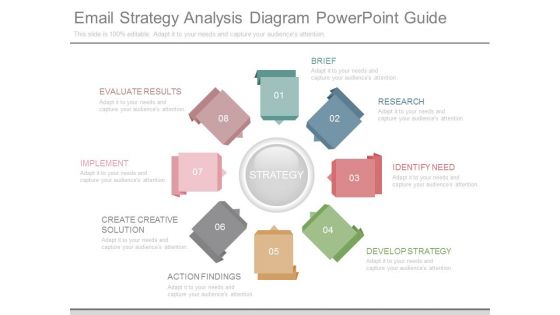
Email Strategy Analysis Diagram Powerpoint Guide
This is a email strategy analysis diagram powerpoint guide. This is a eight stage process. The stages in this process are evaluate results, implement, create creative solution, action findings, strategy, brief, research, identify need, develop strategy.
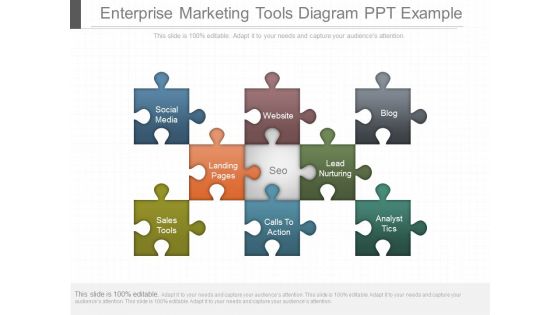
Enterprise Marketing Tools Diagram Ppt Example
This is a enterprise marketing tools diagram ppt example. This is a nine stage process. The stages in this process are social media, sales tools, landing pages, website, seo, calls to action, lead nurturing, blog, analyst tics.
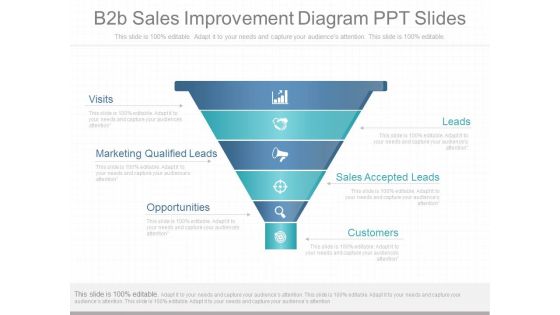
B2b Sales Improvement Diagram Ppt Slides
This is a b2b sales improvement diagram ppt slides. This is a six stage process. The stages in this process are visits, marketing qualified leads, opportunities, customers, sales accepted leads, leads.
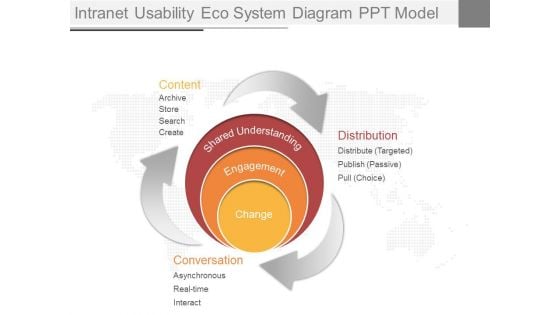
Intranet Usability Eco System Diagram Ppt Model
This is a intranet usability eco system diagram ppt model. This is a three stage process. The stages in this process are change, engagement, shared understanding, distribution, conversation, content.

Ecommerce Marketing Strategy Diagram Ppt Infographic Template
This is a ecommerce marketing strategy diagram ppt infographic template. This is a four stage process. The stages in this process are ad words method, social media ad, banner ads, seo tactics.
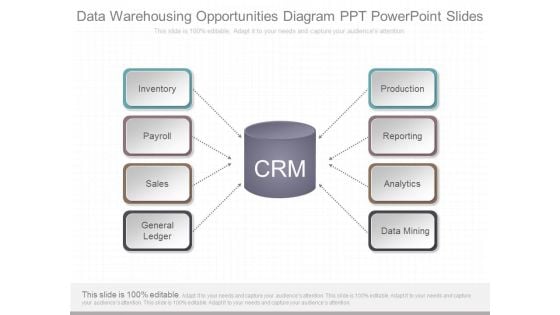
Data Warehousing Opportunities Diagram Ppt Powerpoint Slides
This is a data warehousing opportunities diagram ppt powerpoint slides. This is a eight stage process. The stages in this process are inventory, payroll, sales, ledger general, production, reporting, analytics, data mining.
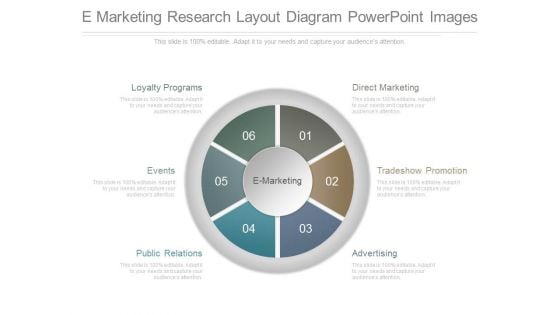
E Marketing Research Layout Diagram Powerpoint Images
This is a e marketing research layout diagram powerpoint images. This is a six stage process. The stages in this process are loyalty programs, direct marketing, tradeshow promotion, advertising, public relations, events.
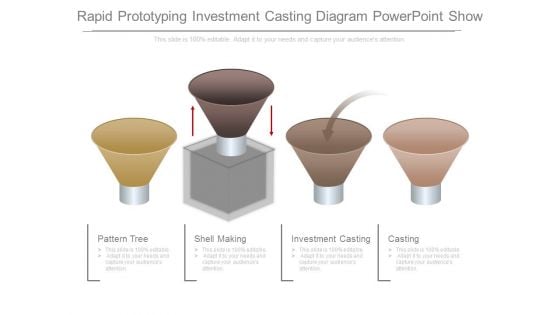
Rapid Prototyping Investment Casting Diagram Powerpoint Show
This is a rapid prototyping investment casting diagram powerpoint show. This is a four stage process. The stages in this process are pattern tree, shell making, investment casting, casting.
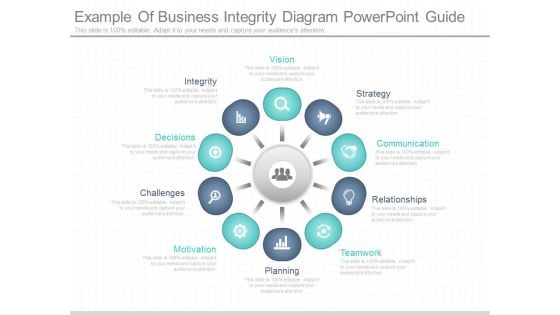
Example Of Business Integrity Diagram Powerpoint Guide
This is a example of business integrity diagram powerpoint guide. This is a ten stage process. The stages in this process are integrity, decisions, challenges, motivation, planning, teamwork, relationships, communication, strategy, vision.
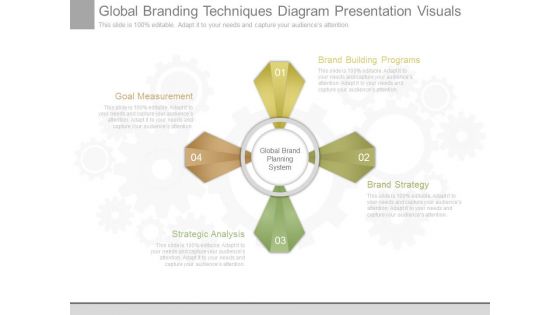
Global Branding Techniques Diagram Presentation Visuals
This is a global branding techniques diagram presentation visuals. This is a four stage process. The stages in this process are brand building programs, brand strategy, strategic analysis, goal measurement.
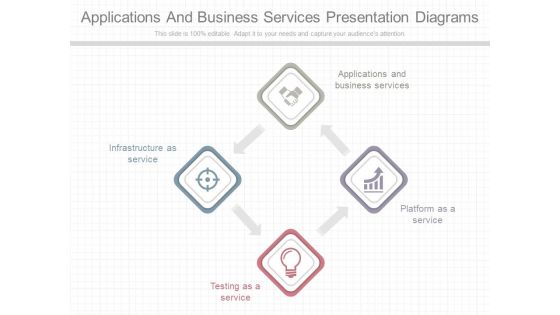
Applications And Business Services Presentation Diagrams
This is an applications and business services presentation diagrams. This is a four stage process. The stages in this process are applications and business services, infrastructure as service, testing as a service.
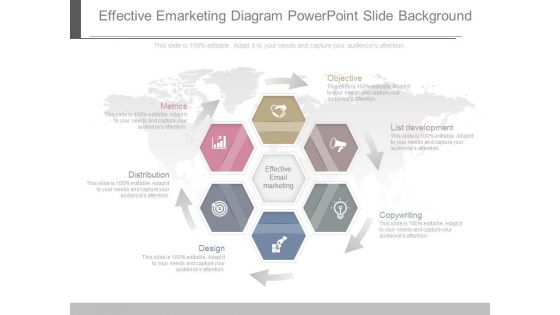
Effective Emarketing Diagram Powerpoint Slide Background
This is a effective emarketing diagram powerpoint slide background. This is a six stage process. The stages in this process are metrics, distribution, design, copywriting, list development, objective, effective email marketing.\n\n\n\n\n\n\n\n\n\n\n\n\n\n\n\n\n\n
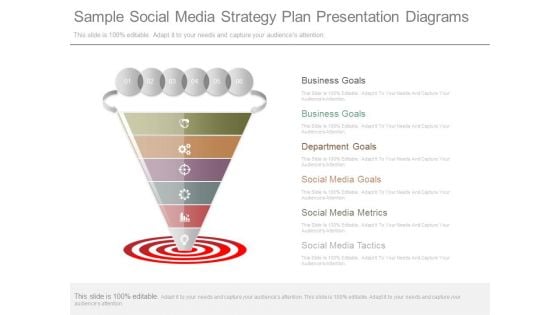
Sample Social Media Strategy Plan Presentation Diagrams
This is a sample social media strategy plan presentation diagrams. This is a six stage process. The stages in this process are business goals, department goals, social media goals, social media metrics, social media tactics.
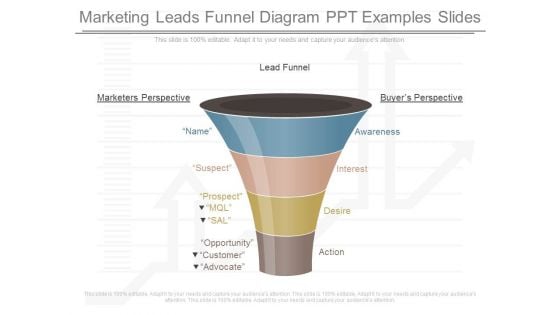
Marketing Leads Funnel Diagram Ppt Examples Slides
This is a marketing leads funnel diagram ppt examples slides. This is a four stage process. The stages in this process are name, suspect, prospect, mql, sal, opportunity, customer, advocate, awareness, interest, desire, action, marketers perspective, lead funnel, buyers perspective.
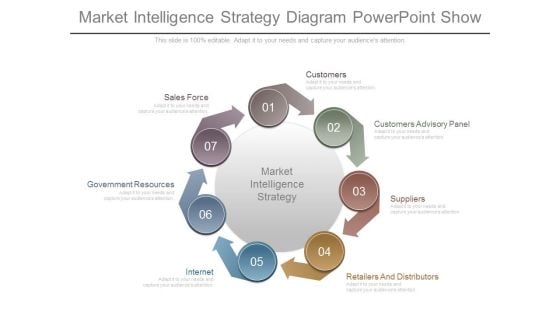
Market Intelligence Strategy Diagram Powerpoint Show
This is a market intelligence strategy diagram powerpoint show. This is a seven stage process. The stages in this process are customers, customers advisory panel, suppliers, retailers and distributors, internet, government resources, sales force.
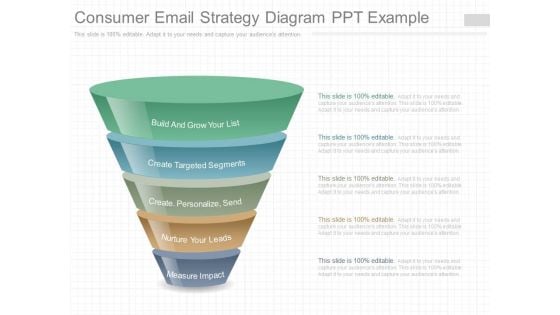
Consumer Email Strategy Diagram Ppt Example
This is a consumer email strategy diagram ppt example. This is a five stage process. The stages in this process are build and grow your list, create targeted segments, create personalize send, nurture your leads, measure impact.
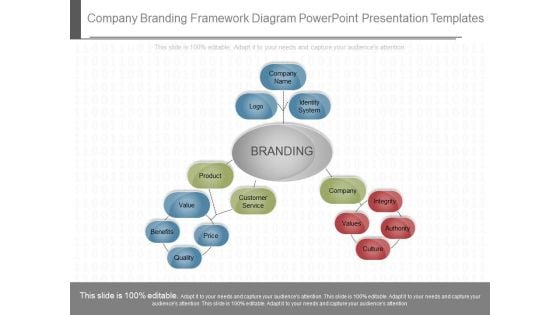
Company Branding Framework Diagram Powerpoint Presentation Templates
This is a company branding framework diagram powerpoint presentation templates. This is a one stage process. The stages in this process are company name, logo, identity system, branding, product, customer service, value, price, benefits, quality, company, integrity, authority, culture.
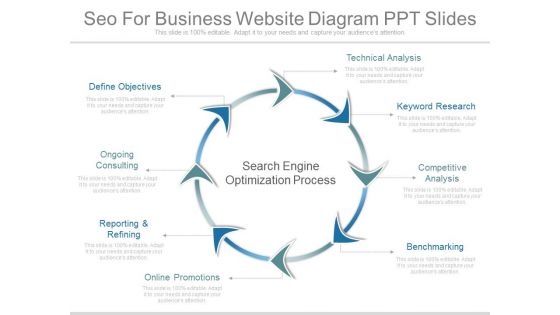
Seo For Business Website Diagram Ppt Slides
This is a seo for business website diagram ppt slides. This is a eight stage process. The stages in this process are technical analysis, keyword research, competitive analysis, benchmarking, online promotions, reporting and refining, ongoing consulting, define objectives.
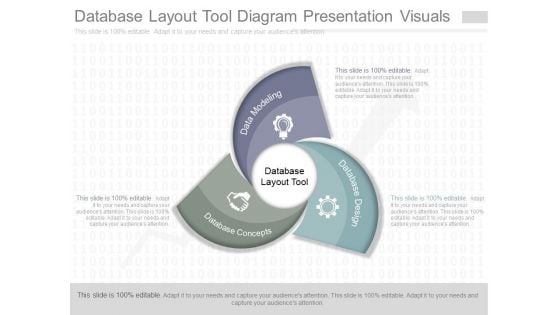
Database Layout Tool Diagram Presentation Visuals
This is a database layout tool diagram presentation visuals. This is a three stage process. The stages in this process are database concepts, data modeling, database layout tool, database design.\n\n\n\n
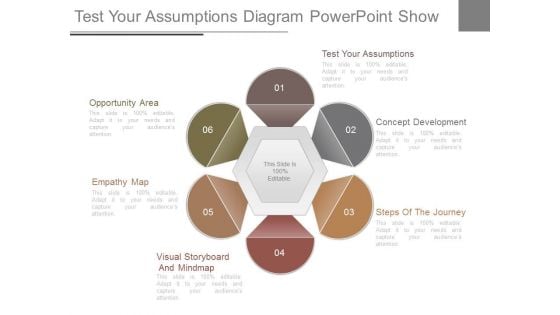
Test Your Assumptions Diagram Powerpoint Show
This is a test your assumptions diagram powerpoint show. This is a six stage process. The stages in this process are opportunity area, test your assumptions, concept development, empathy map, visual storyboard and mindmap, steps of the journey.
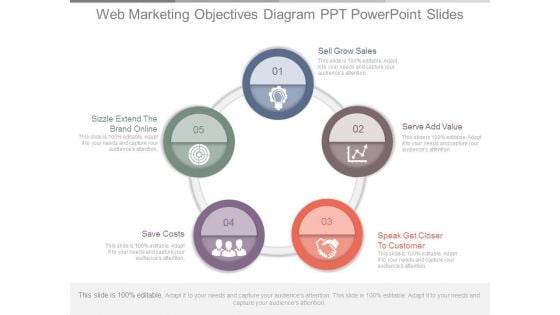
Web Marketing Objectives Diagram Ppt Powerpoint Slides
This is a web marketing objectives diagram ppt powerpoint slides. This is a five stage process. The stages in this process are sell grow sales, serve add value, speak get closer to customer, save costs, sizzle extend the brand online.
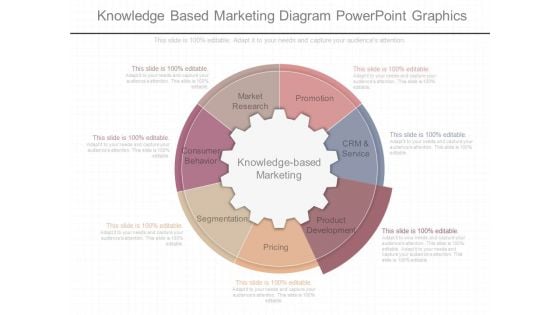
Knowledge Based Marketing Diagram Powerpoint Graphics
This is a knowledge based marketing diagram powerpoint graphics. This is a seven stage process. The stages in this process are market research, promotion, consumer behavior, knowledge based marketing, segmentation, pricing, product development, crm and service.
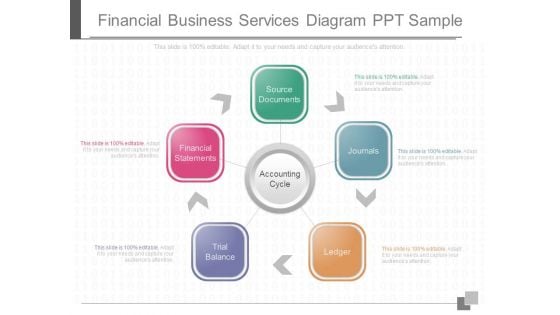
Financial Business Services Diagram Ppt Sample
This is a financial business services diagram ppt sample. This is a five stage process. The stages in this process are source documents, financial statements, trial balance, accounting cycle, ledger, journals, accounting cycle.\n\n\n\n\n\n\n\n\n\n\n\n\n\n\n\n
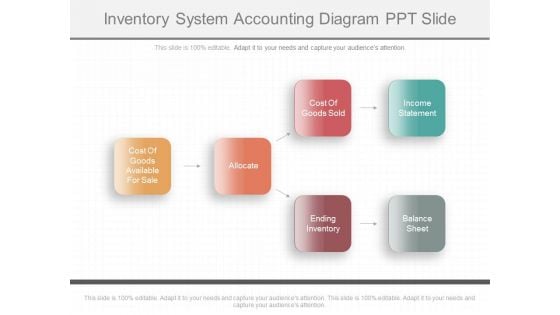
Inventory System Accounting Diagram Ppt Slide
This is a inventory system accounting diagram ppt slide. This is a six stage process. The stages in this process are cost of goods available for sale, allocate, cost of goods sold, ending inventory, income statement, balance sheet.\n\n \n\n\n\n\n\n\n\n\n\n\n\n\n\n\n\n\n\n\n\n\n\n\n\n\n\n
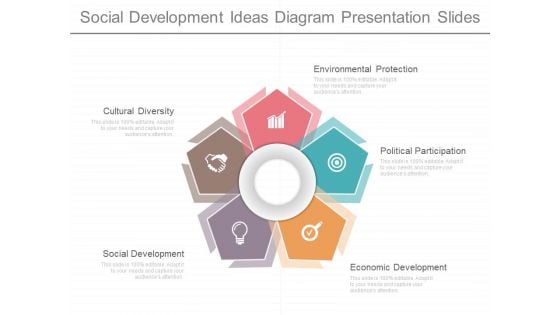
Social Development Ideas Diagram Presentation Slides
This is a social development ideas diagram presentation slides. This is a five stage process. The stages in this process are environmental protection, cultural diversity, social development, economic, development, political participation.
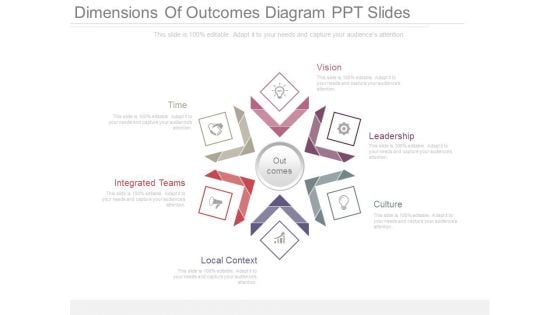
Dimensions Of Outcomes Diagram Ppt Slides
This is a dimensions of outcomes diagram ppt slides. This is a six stage process. The stages in this process are time, integrated teams, local context, culture, leadership, vision, out comes.
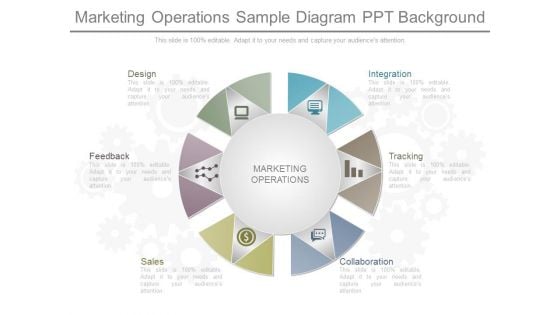
Marketing Operations Sample Diagram Ppt Background
This is a marketing operations sample diagram ppt background. This is a six stage process. The stages in this process are design, feedback, sales, integration, tracking, collaboration, marketing operations.
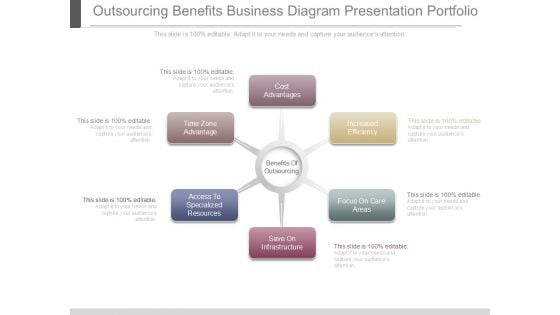
Outsourcing Benefits Business Diagram Presentation Portfolio

Financial Data Analysis Sample Diagram Presentation Slide
This is a financial data analysis sample diagram presentation slide. This is a four stage process. The stages in this process are finance, sales and marketing, operations, credit and risk.
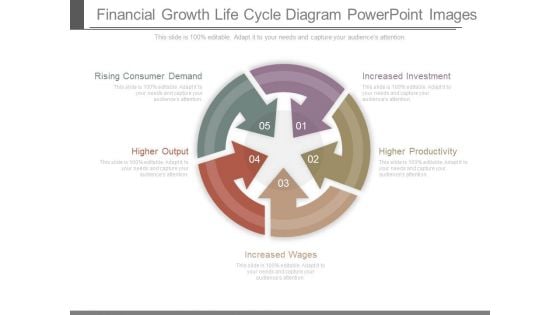
Financial Growth Life Cycle Diagram Powerpoint Images
This is a financial growth life cycle diagram powerpoint images. This is a five stage process. The stages in this process are rising consumer demand, higher output, increased wages, higher productivity, increased investment.
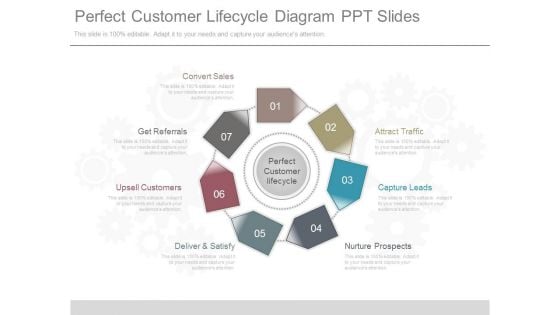
Perfect Customer Lifecycle Diagram Ppt Slides
This is a perfect customer lifecycle diagram ppt slides. This is a seven stage process. The stages in this process are convert sales, get referrals, upsell customers, deliver and satisfy, nurture prospects, capture leads, attract traffic, perfect customer lifecycle.\n\n
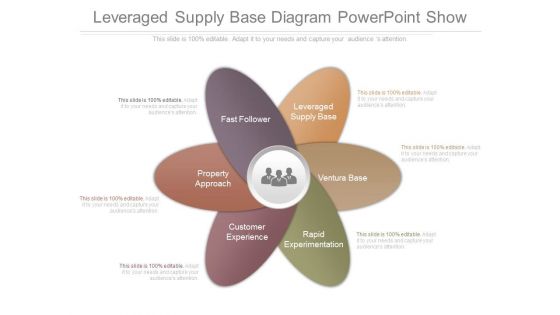
Leveraged Supply Base Diagram Powerpoint Show
This is a leveraged supply base diagram powerpoint show. This is a six stage process. The stages in this process are fast follower, leveraged supply base, ventura base, property approach, customer experience, rapid experimentation.
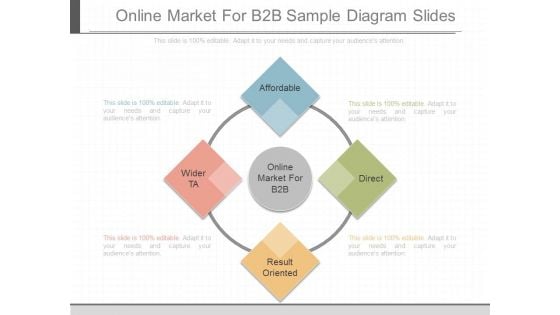
Online Market For B2b Sample Diagram Slides
This is a online market for b2b sample diagram slides. This is a four stage process. The stages in this process are affordable, wider ta, result oriented, direct, online market for b2b.

Brand Identity Brand Architecture Diagram Ppt Slides
This is a brand identity brand architecture diagram ppt slides. This is a six stage process. The stages in this process are understanding all stakeholder needs and desires, opportunity modelling, brand platform, brand identity, brand architecture, continuous evaluation and development.
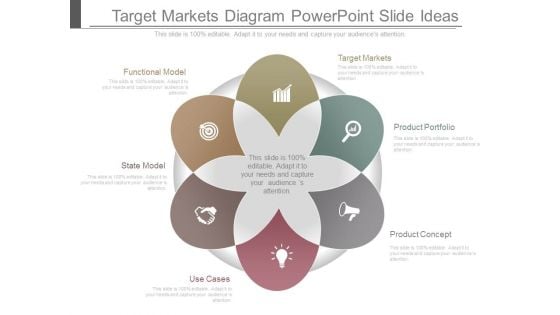
Target Markets Diagram Powerpoint Slide Ideas
This is a target markets diagram powerpoint slide ideas. This is a six stage process. The stages in this process are functional model, state model, use cases, target markets, product portfolio, product concept.
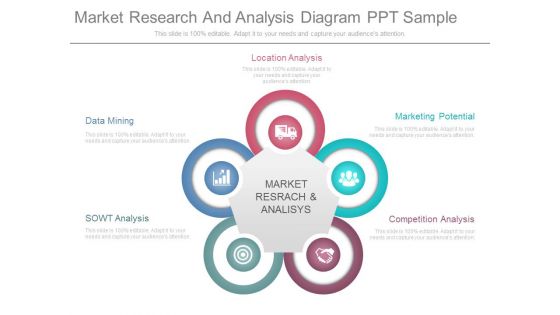
Market Research And Analysis Diagram Ppt Sample
This is a market research and analysis diagram ppt sample. This is a five stage process. The stages in this process are location analysis, data mining, sowt analysis, market research and analysis, competition analysis, marketing potential.
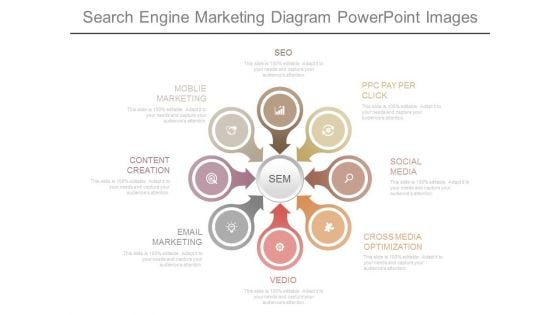
Search Engine Marketing Diagram Powerpoint Images
This is a search engine marketing diagram powerpoint images. This is a eight stage process. The stages in this process are seo, mobile marketing, content creation, email marketing, video, cross media optimization, social media, ppc pay per click, sem.
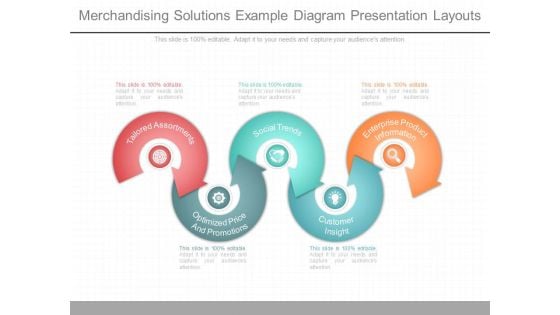
Merchandising Solutions Example Diagram Presentation Layouts
This is a merchandising solutions example diagram presentation layouts. This is a five stage process. The stages in this process are tailored assortments, optimized price and promotions, social trends, customer insight, enterprise product information.
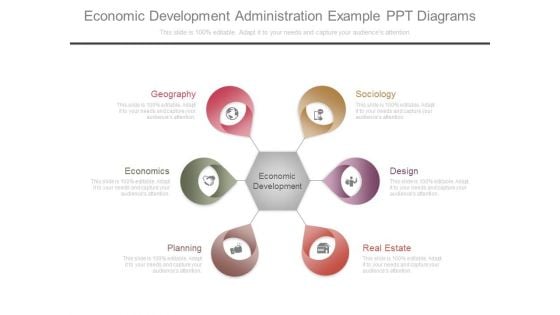
Economic Development Administration Example Ppt Diagrams
This is economic development administration example ppt diagrams. This is a six stage process. The stages in this process are real estate, design, sociology, geography, economics, planning, economic development.
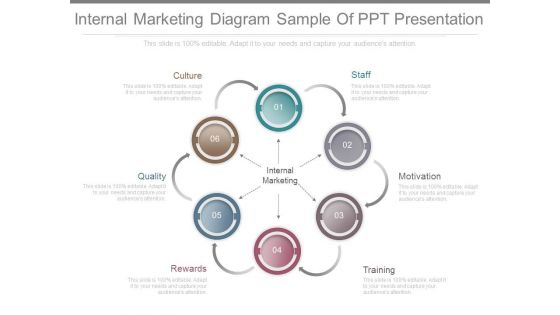
Internal Marketing Diagram Sample Of Ppt Presentation
This is a internal marketing diagram sample of ppt presentation. This is a six stage process. The stages in this process are internal marketing, culture, quality, rewards, training, motivation, staff.
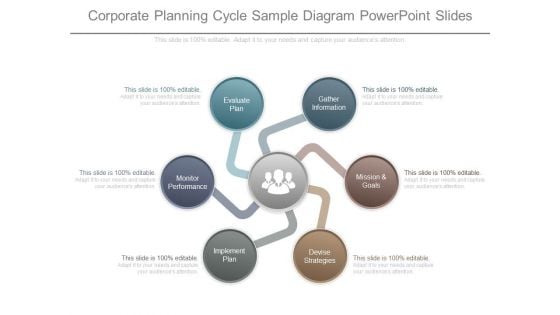
Corporate Planning Cycle Sample Diagram Powerpoint Slides
This is a corporate planning cycle sample diagram powerpoint slides. This is a six stage process. The stages in this process are gather information, mission and goals, devise strategies, implement plan, monitor performance, evaluate plan.
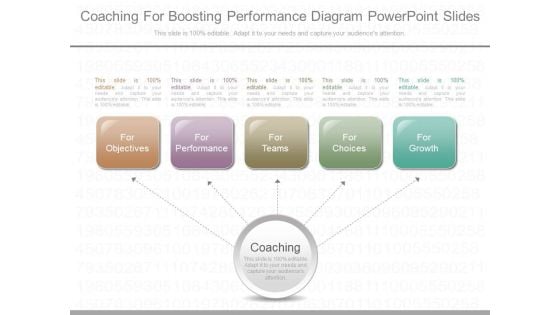
Coaching For Boosting Performance Diagram Powerpoint Slides
This is a coaching for boosting performance diagram powerpoint slides. This is a five stage process. The stages in this process are for objectives, for performance, for teams, for choices, for growth, coaching.
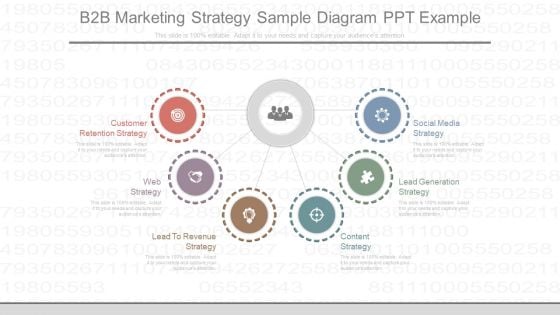
B2b Marketing Strategy Sample Diagram Ppt Example
This is a b2b marketing strategy sample diagram ppt example. This is a six stage process. The stages in this process are customer retention strategy, web strategy, lead to revenue strategy, content strategy, lead generation strategy, social media strategy.
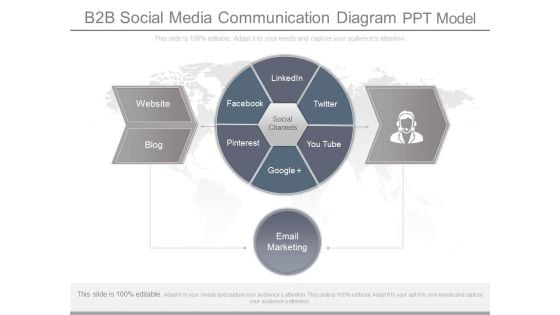
B2b Social Media Communication Diagram Ppt Model
This is a b2b social media communication diagram ppt model. This is a six stage process. The stages in this process are website, blog, facebook, linkedin, twitter, tube, interest, email marketing.
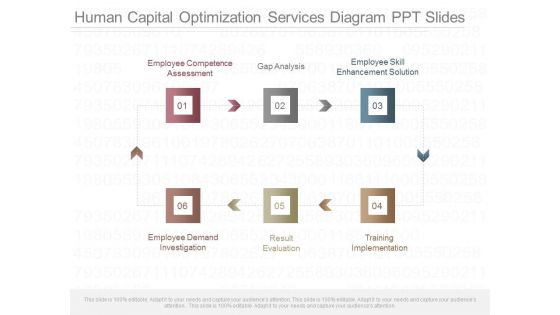
Human Capital Optimization Services Diagram Ppt Slides
This is a human capital optimization services diagram ppt slides. This is a six stage process. The stages in this process are employee competence assessment, gap analysis, employee skill enhancement solution, employee demand investigation, result evaluation, training implementation.

 Home
Home