Work Plan
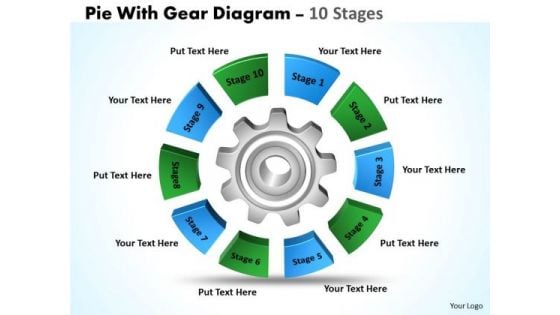
Business Diagram Pie With Gear Diagram 10 Stages Sales Diagram
Document The Process On Our Business Diagram Pie With Gear Diagram 10 Stages Sales Diagram Powerpoint Templates. Make A Record Of Every Detail.
Business Cycle Diagram Traffic Lights Style Sales Diagram
Document The Process On Our Business Cycle Diagram Traffic Lights Style Sales Diagram Powerpoint Templates. Make A Record Of Every Detail.
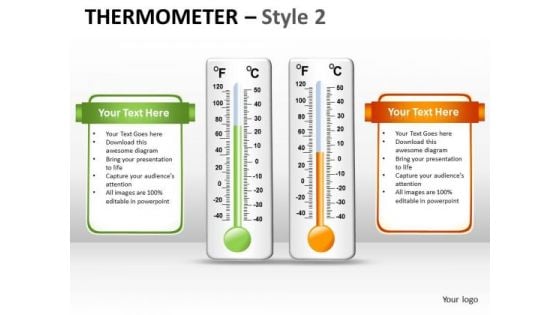
Business Cycle Diagram Thermometer Style 2 Business Diagram
Document The Process On Our Business Cycle Diagram Thermometer Style 2 Business Diagram Powerpoint Templates. Make A Record Of Every Detail.
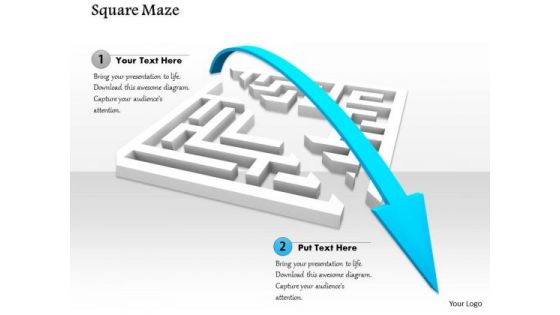
Stock Photo Blue Arrow Jumping Over The Maze PowerPoint Slide
Document The Process On Our stock photo blue arrow jumping over the maze powerpoint slide Powerpoint Templates. Make A Record Of Every Detail.

Stock Photo Model Of Globe With Books Education Concept PowerPoint Slide
Document The Process On Our Stock Photo Model Of Globe With Books Education Concept Powerpoint Slide Powerpoint Templates. Make A Record Of Every Detail.
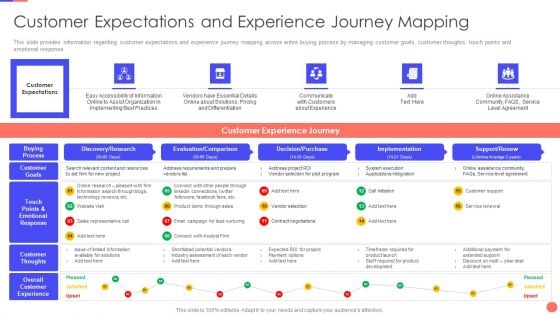
Sales Techniques Playbook Customer Expectations And Experience Journey Mapping Demonstration PDF
This slide provides information regarding customer expectations and experience journey mapping across entire buying process by managing customer goals, customer thoughts, touch points and emotional response. Deliver and pitch your topic in the best possible manner with this sales techniques playbook customer expectations and experience journey mapping demonstration pdf. Use them to share invaluable insights on customer expectations, buying process, customer goals, touch points and emotional response, customer thoughts and impress your audience. This template can be altered and modified as per your expectations. So, grab it now.
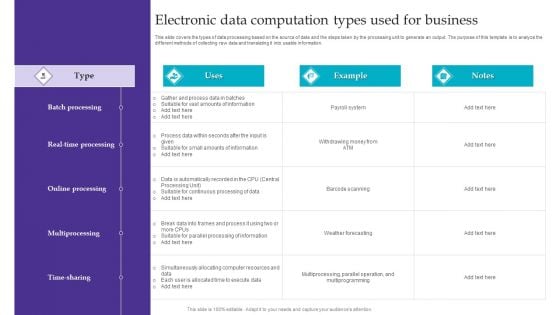
Electronic Data Computation Types Used For Business Microsoft PDF
This slide covers the types of data processing based on the source of data and the steps taken by the processing unit to generate an output. The purpose of this template is to analyze the different methods of collecting raw data and translating it into usable information. Pitch your topic with ease and precision using this Electronic Data Computation Types Used For Business Microsoft PDF. This layout presents information on Batch Processing, Online Processing, Multiprocessing. It is also available for immediate download and adjustment. So, changes can be made in the color, design, graphics or any other component to create a unique layout.
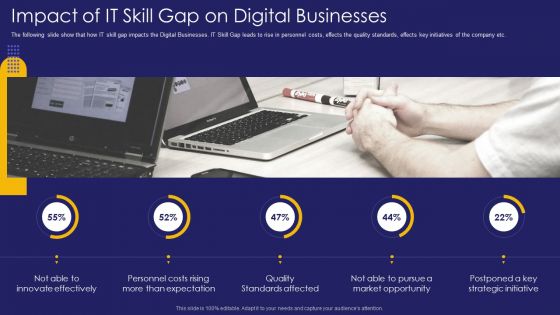
Role IT Team Digital Transformation Impact Of It Skill Gap On Digital Businesses Sample PDF
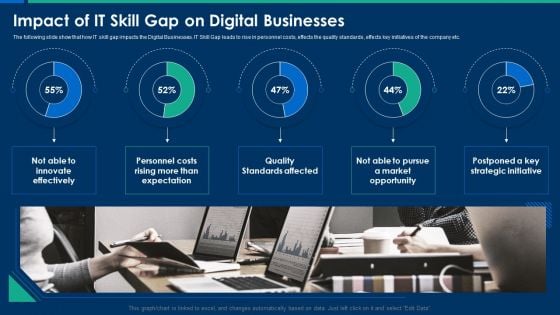
The following slide show that how IT skill gap impacts the Digital Businesses. IT Skill Gap leads to rise in personnel costs, effects the quality standards, effects key initiatives of the company etc. Deliver and pitch your topic in the best possible manner with this role it team digital transformation impact of it skill gap on digital businesses sample pdf. Use them to share invaluable insights on personnel, expectation, standards and impress your audience. This template can be altered and modified as per your expectations. So, grab it now.
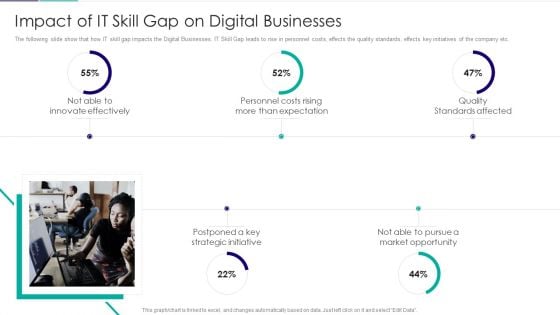
Role Of Technical Competence In Organizational Impact Of It Skill Gap On Digital Businesses Graphics PDF
The following slide show that how IT skill gap impacts the Digital Businesses. IT Skill Gap leads to rise in personnel costs, effects the quality standards, effects key initiatives of the company etc.Deliver an awe inspiring pitch with this creative Role Of Technical Competence In Organizational Impact Of It Skill Gap On Digital Businesses Graphics PDF bundle. Topics like Innovate Effectively, Personnel Costs Rising, Quality Standards Affected can be discussed with this completely editable template. It is available for immediate download depending on the needs and requirements of the user.
CIO Role In Digital Evolution Impact Of It Skill Gap On Digital Businesses Ideas PDF
The following slide show that how IT skill gap impacts the Digital Businesses. IT Skill Gap leads to rise in personnel costs, effects the quality standards, effects key initiatives of the company etc. Deliver an awe inspiring pitch with this creative CIO Role In Digital Evolution Impact Of It Skill Gap On Digital Businesses Ideas PDF bundle. Topics like Innovate Effectively, Personnel Costs, Quality Standards can be discussed with this completely editable template. It is available for immediate download depending on the needs and requirements of the user.
Integrating ITSM To Enhance Service Key Roles And Responsibilities Of Service Desk Department Professional PDF
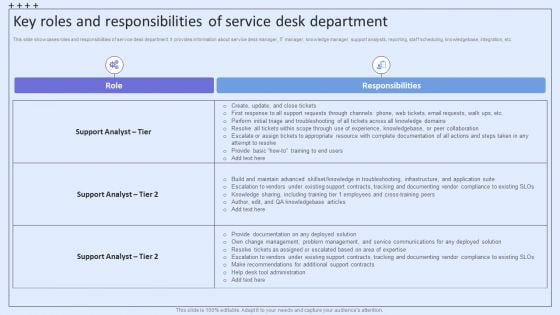
This slide showcases roles and responsibilities of service desk department. It provides information about service desk manager, IT manager, knowledge manager, support analysts, reporting, staff scheduling, knowledgebase, integration, etc. Make sure to capture your audiences attention in your business displays with our gratis customizable Integrating ITSM To Enhance Service Key Roles And Responsibilities Of Service Desk Department Professional PDF. These are great for business strategies, office conferences, capital raising or task suggestions. If you desire to acquire more customers for your tech business and ensure they stay satisfied, create your own sales presentation with these plain slides.
Digitalization Of Service Desk Key Roles And Responsibilities Of Service Desk Department Ppt Infographics Graphic Tips PDF
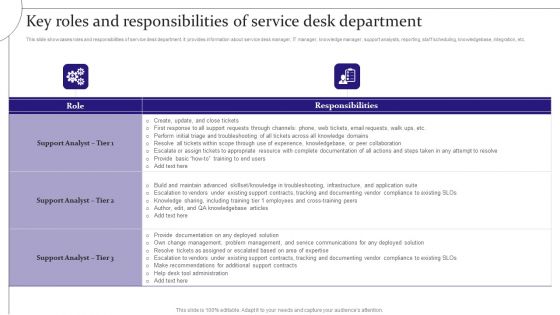
This slide showcases roles and responsibilities of service desk department. It provides information about service desk manager, IT manager, knowledge manager, support analysts, reporting, staff scheduling, knowledgebase, integration, etc. Make sure to capture your audiences attention in your business displays with our gratis customizable Digitalization Of Service Desk Key Roles And Responsibilities Of Service Desk Department Ppt Infographics Graphic Tips PDF. These are great for business strategies, office conferences, capital raising or task suggestions. If you desire to acquire more customers for your tech business and ensure they stay satisfied, create your own sales presentation with these plain slides.

Key Roles And Responsibilities Of Service Desk Department Ppt PowerPoint Presentation File Backgrounds PDF
This slide showcases roles and responsibilities of service desk department. It provides information about service desk manager, IT manager, knowledge manager, support analysts, reporting, staff scheduling, knowledgebase, integration, etc. Make sure to capture your audiences attention in your business displays with our gratis customizable Key Roles And Responsibilities Of Service Desk Department Ppt PowerPoint Presentation File Backgrounds PDF. These are great for business strategies, office conferences, capital raising or task suggestions. If you desire to acquire more customers for your tech business and ensure they stay satisfied, create your own sales presentation with these plain slides.
Business Marketing PowerPoint Templates Business 3d Puzzle Pieces Put Together Ppt Slides
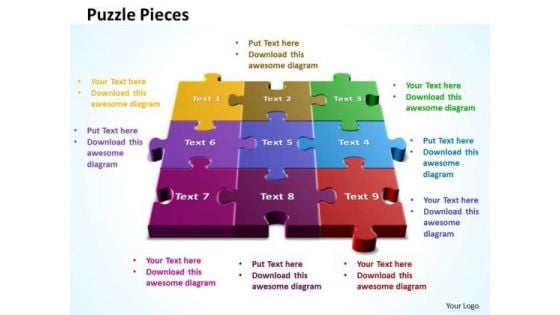
Business Marketing PowerPoint Templates Business 3D Puzzle Pieces Put Together PPT Slides-This 3D PowerPoint Diagram consists of 9 puzzle pieces connected together. Use this template to illustrate your method, piece by piece, and interlock the whole process in the minds of your audience.-Business Marketing PowerPoint Templates Business 3D Puzzle Pieces Put Together PPT Slides You've found a treasure for presentations. Get goingwith our Business Marketing PowerPoint Templates Business 3d Puzzle Pieces Put Together Ppt Slides. You'll deliver your best presentation yet.
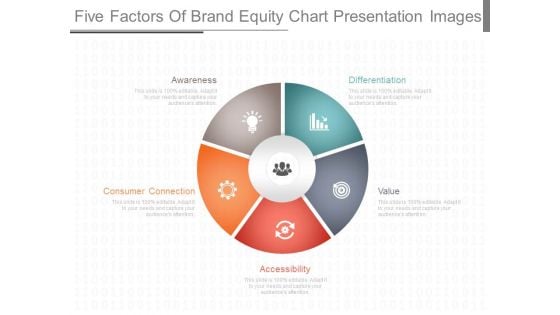
Five Factors Of Brand Equity Chart Presentation Images
This is a five factors of brand equity chart presentation images. This is a five stage process. The stages in this process are awareness, differentiation, consumer connection, accessibility, value. \n \n \n \n \n \n \n \n \n \n
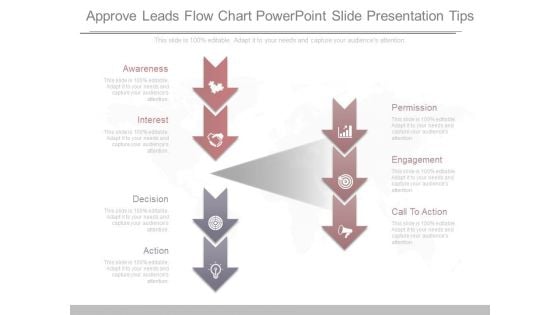
Approve Leads Flow Chart Powerpoint Slide Presentation Tips
This is a approve leads flow chart powerpoint slide presentation tips. This is a seven stage process. The stages in this process are awareness, interest, decision, action, permission, engagement, call to action.
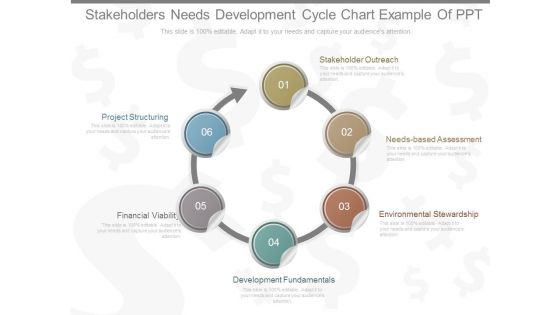
Stakeholders Needs Development Cycle Chart Example Of Ppt
This is a stakeholders needs development cycle chart example of ppt. This is a six stage process. The stages in this process are stakeholder outreach, needs based assessment, environmental stewardship,, development fundamentals, financial viability, project structuring.
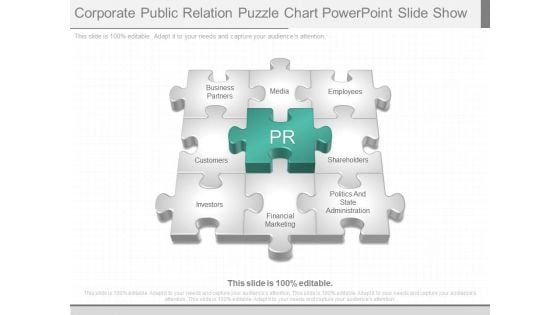
Corporate Public Relation Puzzle Chart Powerpoint Slide Show
This is a corporate public relation puzzle chart powerpoint slide show. This is a nine stage process. The stages in this process are business partners, media, employees, customers, shareholders, investors, financial marketing, politics and state administration, pr.
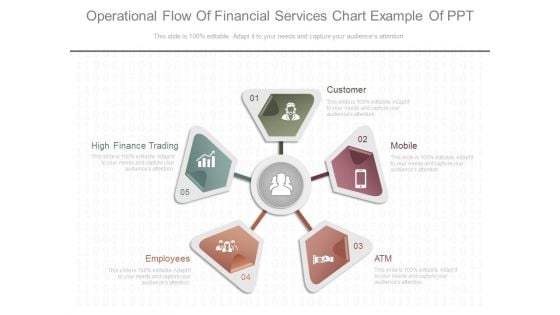
Operational Flow Of Financial Services Chart Example Of Ppt
This is a operational flow of financial services chart example of ppt. This is a five stage process. The stages in this process are customer, mobile, atm, employees, high finance trading.
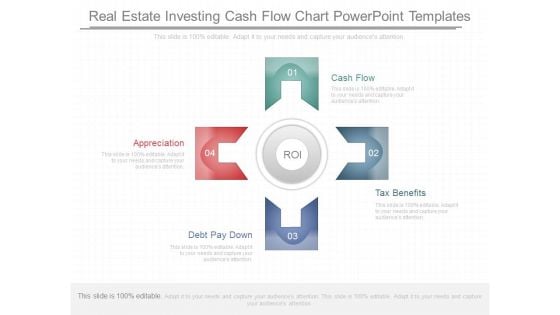
Real Estate Investing Cash Flow Chart Powerpoint Templates
This is a real estate investing cash flow chart powerpoint templates. This is a four stage process. The stages in this process are cash flow, tax benefits, debt pay down, appreciation.
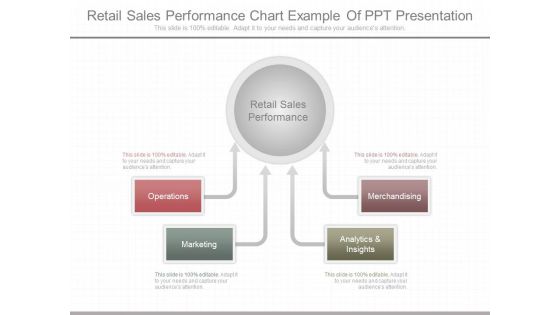
Retail Sales Performance Chart Example Of Ppt Presentation
This is a retail sales performance chart example of ppt presentation. This is a four stage process. The stages in this process are operations, marketing, analytics and insights, merchandising, retail sales performance.
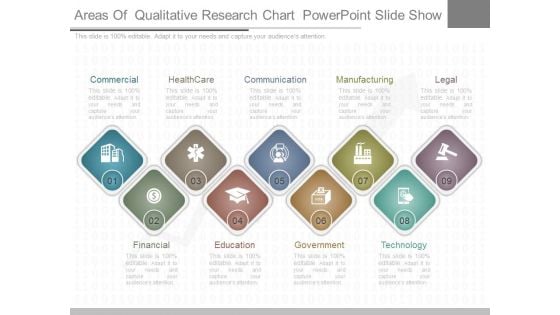
Areas Of Qualitative Research Chart Powerpoint Slide Show
This is a areas of qualitative research chart powerpoint slide show. This is a nine stage process. The stages in this process are commercial, healthcare, communication, manufacturing, legal, financial,, education, government, technology.
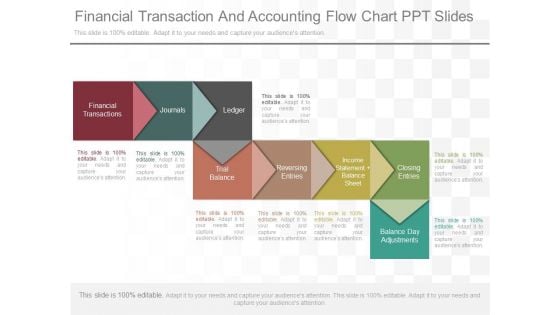
Financial Transaction And Accounting Flow Chart Ppt Slides
This is a financial transaction and accounting flow chart ppt slides. This is a eight stage process. The stages in this process are financial transactions, journals, ledger, trial balance, reversing entries, income statement balance sheet, closing entries, balance day adjustments.
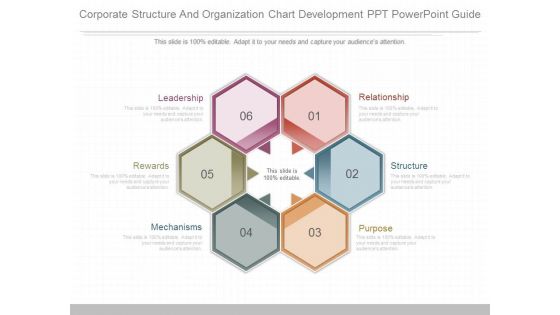
Corporate Structure And Organization Chart Development Ppt Powerpoint Guide
This is a corporate structure and organization chart development ppt powerpoint guide. This is a six stage process. The stages in this process are relationship, structure, purpose, mechanisms, rewards, leadership.
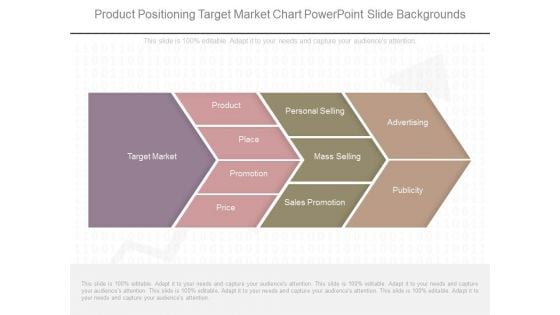
Product Positioning Target Market Chart Powerpoint Slide Backgrounds
This is a product positioning target market chart powerpoint slide backgrounds. This is a four stage process. The stages in this process are target market, product, place, promotion, price, personal selling, mass selling, sales promotion, advertising, publicity.
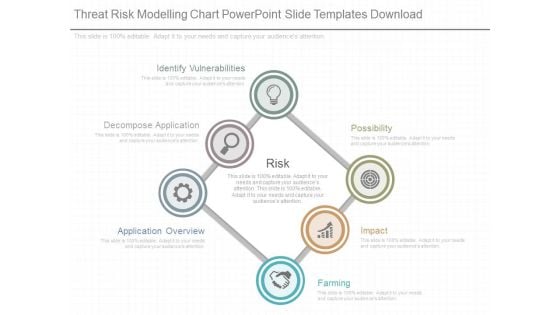
Threat Risk Modelling Chart Powerpoint Slide Templates Download
This is a threat risk modelling chart powerpoint slide templates download. This is a six stage process. The stages in this process are identify vulnerabilities, decompose application, application overview, possibility, impact, farming, risk.
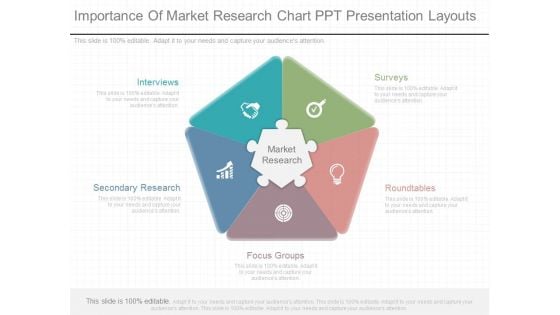
Importance Of Market Research Chart Ppt Presentation Layouts
This is a importance of market research chart ppt presentation layouts. This is a five stage process. The stages in this process are interviews, secondary research, market research, focus groups, surveys, roundtables.
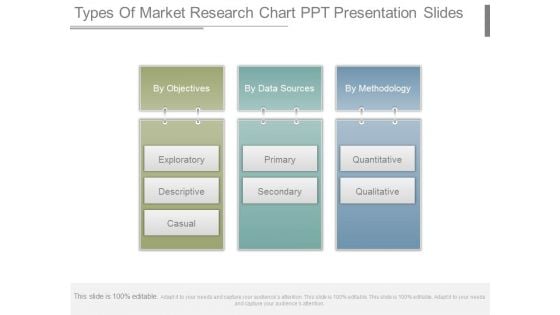
Types Of Market Research Chart Ppt Presentation Slides
This is a types of market research chart ppt presentation slides. This is a three stage process. The stages in this process are by objectives, exploratory, descriptive, causal, by data sources, primary, secondary, by methodology, quantitative, qualitative.
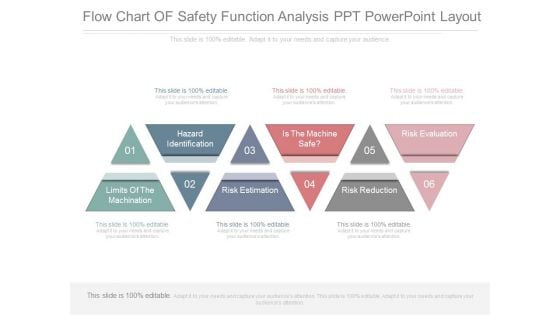
Flow Chart Of Safety Function Analysis Ppt Powerpoint Layout
This is a flow chart of safety function analysis ppt powerpoint layout. This is a six stage process. The stages in this process are hazard identification, limits of the machination, risk estimation, is the machine safe, risk reduction, risk evaluation.
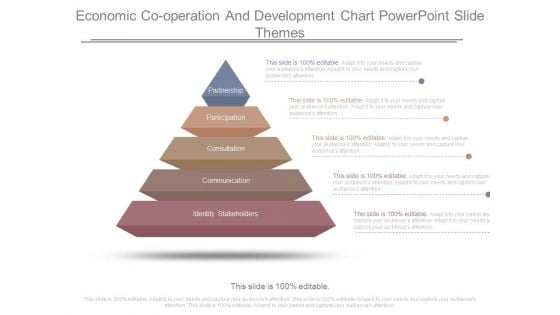
Economic Cooperation And Development Chart Powerpoint Slide Themes
This is a economic cooperation and development chart powerpoint slide themes. This is a five stage process. The stages in this process are partnership, participation, consultation, communication, identify, stakeholders.
Mutual Fund Operation Flow Chart Diagram Ppt Icon
This is a mutual fund operation flow chart diagram ppt icon. This is a four stage process. The stages in this process are return, securities, investors, fund, mutual fund operation.

Conversion Rate Optimization Flow Chart Sample Diagram Powerpoint Slides Images
This is a conversion rate optimization flow chart sample diagram powerpoint slides images. This is a five stage process. The stages in this process are gather insights, measure, unique, pitch, status, future.
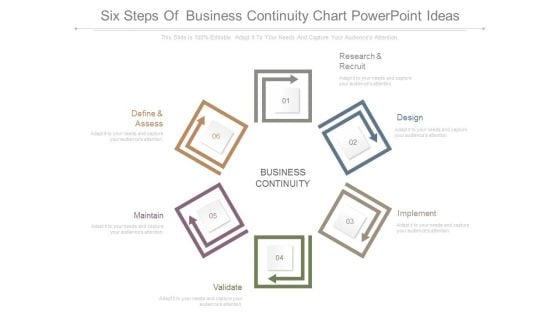
Six Steps Of Business Continuity Chart Powerpoint Ideas
This is a six steps of business continuity chart powerpoint ideas. This is a six stage process. The stages in this process are define and assess, research and recruit, design, implement, validate, maintain, business continuity.
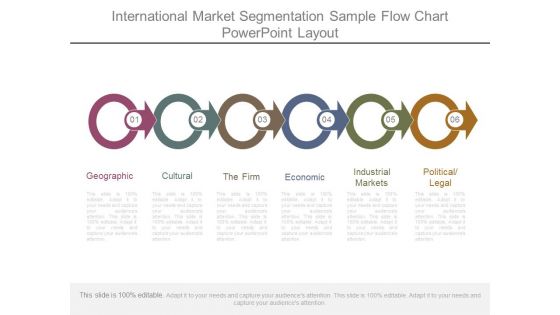
International Market Segmentation Sample Flow Chart Powerpoint Layout
This is a international market segmentation sample flow chart powerpoint layout. This is a six stage process. The stages in this process are geographic, cultural, the firm, economic, industrial markets, political legal.

Conversion Rate Optimization Flow Chart Sample Diagram Example Ppt
This is a conversion rate optimization flow chart sample diagram example ppt. This is a four stage process. The stages in this process are measure, gather insights, test, form hypothesis.
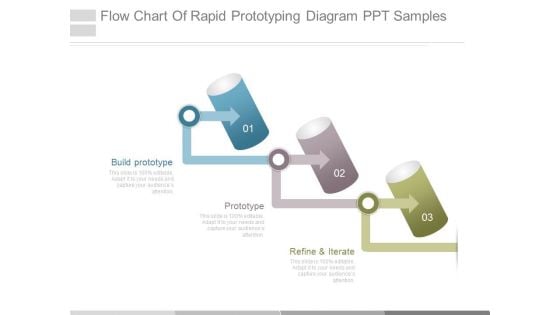
Flow Chart Of Rapid Prototyping Diagram Ppt Samples
This is a flow chart of rapid prototyping diagram ppt samples. This is a three stage process. The stages in this process are build prototype, prototype, refine and iterate.
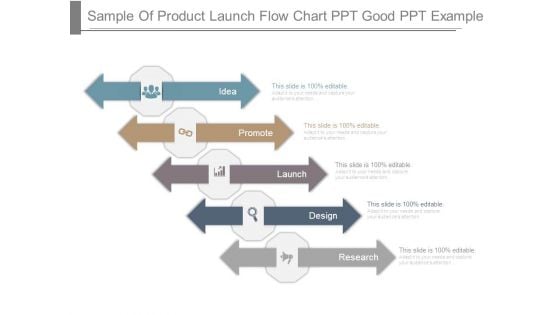
Sample Of Product Launch Flow Chart Ppt Good Ppt Example
This is a sample of product launch flow chart ppt good ppt example. This is a five stage process. The stages in this process are idea, promote, launch, design, research.
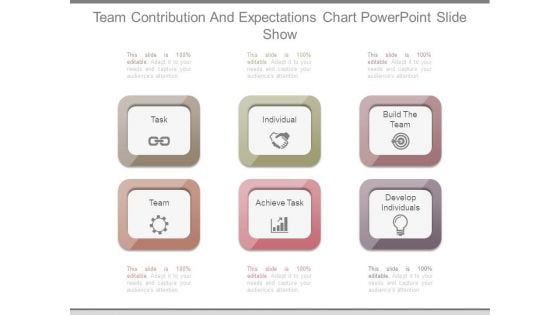
Team Contribution And Expectations Chart Powerpoint Slide Show
This is a team contribution and expectations chart powerpoint slide show. This is a six stage process. The stages in this process are task, individual, build the team, team, achieve task, develop individuals.
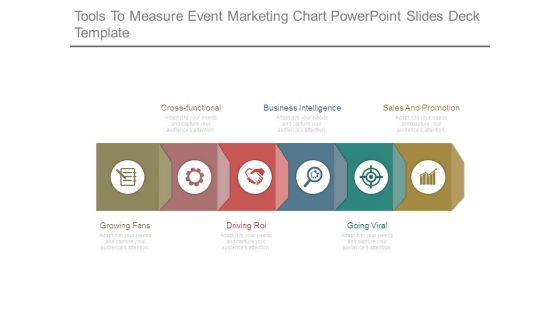
Tools To Measure Event Marketing Chart Powerpoint Slides Deck Template
This is a tools to measure event marketing chart powerpoint slides deck template. This is a six stage process. The stages in this process are cross functional, business intelligence, sales and promotion, going viral, driving roi, growing fans.
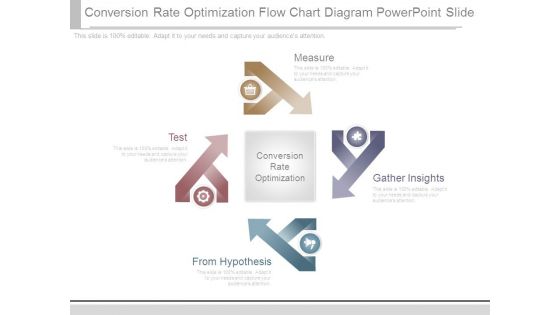
Conversion Rate Optimization Flow Chart Diagram Powerpoint Slide
This is a conversion rate optimization flow chart diagram powerpoint slide. This is a four stage process. The stages in this process are measure, gather insights, from hypothesis, test, conversion rate optimization.

Enterprise Value Timing Factors Chart Ppt Examples Professional
This is a enterprise value timing factors chart ppt examples professional. This is a four stage process. The stages in this process are industry dynamics, company performance, organic growth, strategic acquisitions.
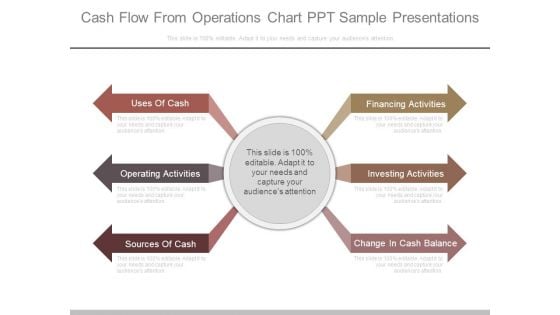
Cash Flow From Operations Chart Ppt Sample Presentations
This is a cash flow from operations chart ppt sample presentations. This is a six stage process. The stages in this process are uses of cash, operating activities, sources of cash, financing activities, investing activities, change in cash balance.
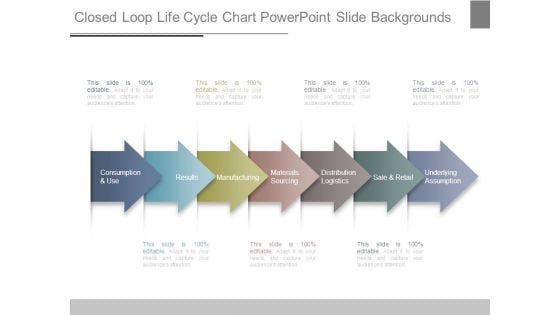
Closed Loop Life Cycle Chart Powerpoint Slide Backgrounds
This is a closed loop life cycle chart powerpoint slide backgrounds. This is a seven stage process. The stages in this process are consumption and use, results, manufacturing, materials sourcing, distribution logistics, sale and retail, underlying assumption.
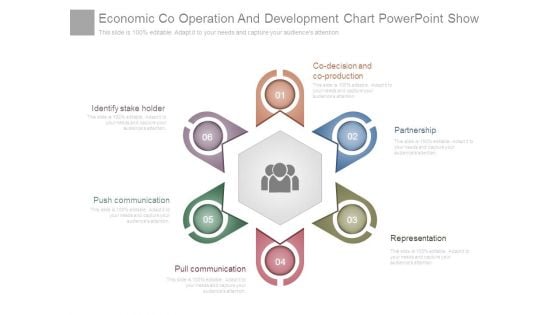
Economic Co Operation And Development Chart Powerpoint Show
This is a economic co operation and development chart powerpoint show. This is a six stage process. The stages in this process are co decision and co production, partnership, representation, pull communication, push communication, identify stake holder.
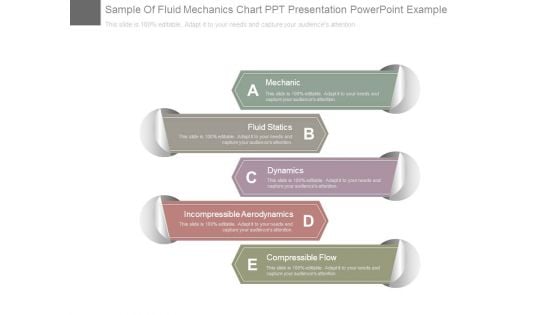
Sample Of Fluid Mechanics Chart Ppt Presentation Powerpoint Example
This is a sample of fluid mechanics chart ppt presentation powerpoint example. This is a five stage process. The stages in this process are mechanic, fluid statics, dynamics, incompressible aerodynamics, compressible flow.
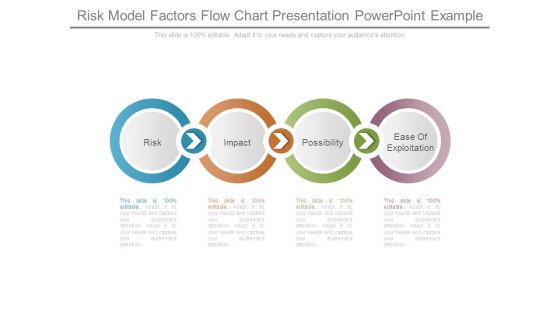
Risk Model Factors Flow Chart Presentation Powerpoint Example
This is a risk model factors flow chart presentation powerpoint example. This is a four stage process. The stages in this process are risk, impact, possibility, ease of exploitation.
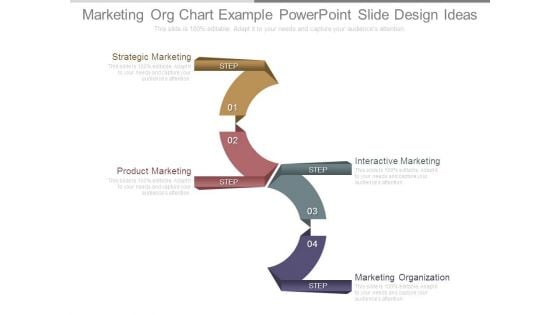
Marketing Org Chart Example Powerpoint Slide Design Ideas
This is a marketing org chart example powerpoint slide design ideas. This is a four stage process. The stages in this process are strategic marketing, product marketing, interactive marketing, marketing organization.
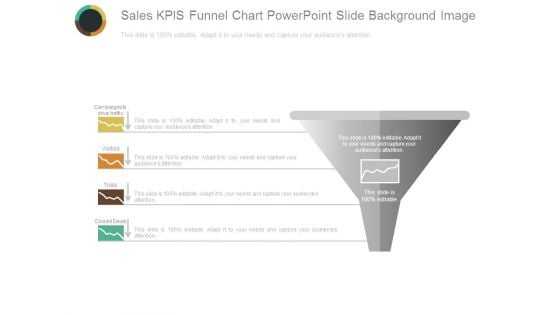
Sales Kpis Funnel Chart Powerpoint Slide Background Image
This is a sales kpis funnel chart powerpoint slide background image. This is a one stage process. The stages in this process are campaigns to drive traffic, visitors, trials, closed deals, sales.

Break Point Chart For Quality Analysis Powerpoint Slide Show
This is a break point chart for quality analysis powerpoint slide show. This is a one stage process. The stages in this process are total variable costs, fixed costs, quality sold.
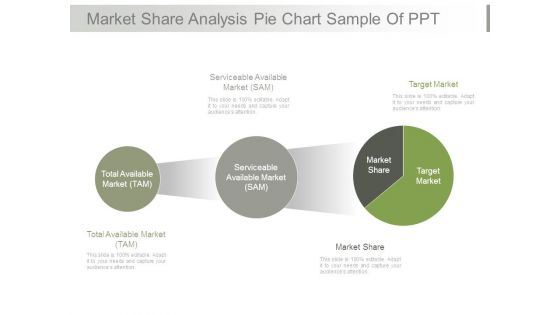
Market Share Analysis Pie Chart Sample Of Ppt
This is a market share analysis pie chart sample of ppt. This is a three stage process. The stages in this process are serviceable available market sam, target market, total available market tam, market share.

And R Chart For Six Sigma Powerpoint Slide Background Designs
This is a and r chart for six sigma powerpoint slide background designs. This is a two stage process. The stages in this process are subtitle, option, lcl, ucl.
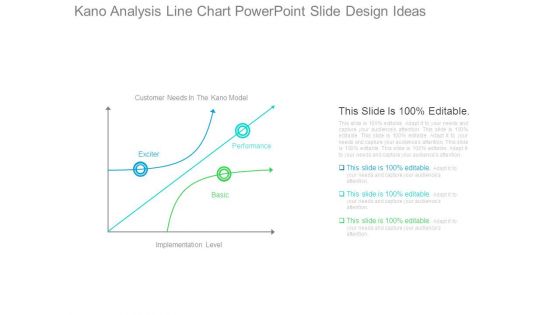
Kano Analysis Line Chart Powerpoint Slide Design Ideas
This is a kano analysis line chart powerpoint slide design ideas. This is a three stage process. The stages in this process are customer needs in the kano model, exciter, performance, basic, implementation level.
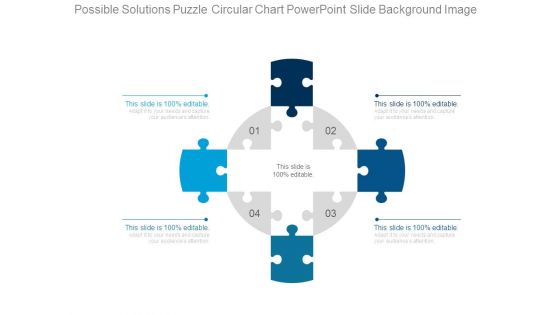
Possible Solutions Puzzle Circular Chart Powerpoint Slide Background Image
This is a possible solutions puzzle circular chart powerpoint slide background image. This is a four stage process. The stages in this process are puzzles, business, problem, solution, game pieces, marketing.
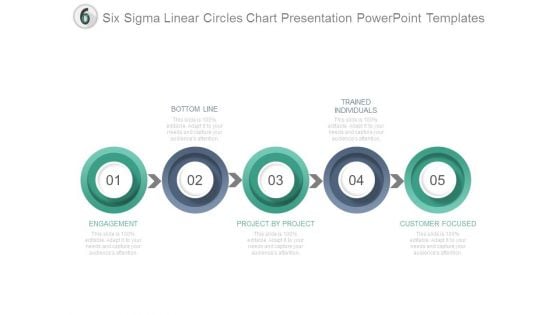
Six Sigma Linear Circles Chart Presentation Powerpoint Templates
This is a six sigma linear circles chart presentation powerpoint templates. This is a five stage process. The stages in this process are bottom line, trained individuals, engagement, project by project, customer focused.
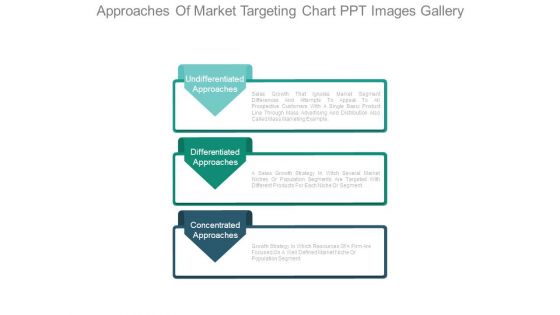
Approaches Of Market Targeting Chart Ppt Images Gallery
This is a approaches of market targeting chart ppt images gallery. This is a three stage process. The stages in this process are undifferentiated approaches, differentiated approaches, concentrated approaches.
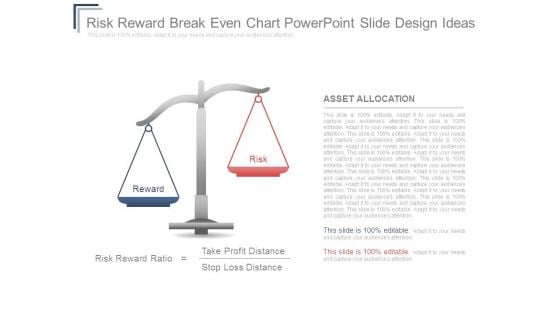
Risk Reward Breakeven Chart Powerpoint Slide Design Ideas
This is a risk reward breakeven chart powerpoint slide design ideas. This is a two stage process. The stages in this process are reward, risk, asset allocation, risk reward ratio, take profit distance, stop loss distance.

Expected Return And Variance Chart Powerpoint Slide Deck Template
This is a expected return and variance chart powerpoint slide deck template. This is a one stage process. The stages in this process are investment reward, reward matrix, high, med, low.

Key Skills Chart For Evaluation Example Of Ppt Presentation
This is a key skills chart for evaluation example of ppt presentation. This is a five stage process. The stages in this process are communicating, questioning, researching, analyzing, evaluating, key skills.
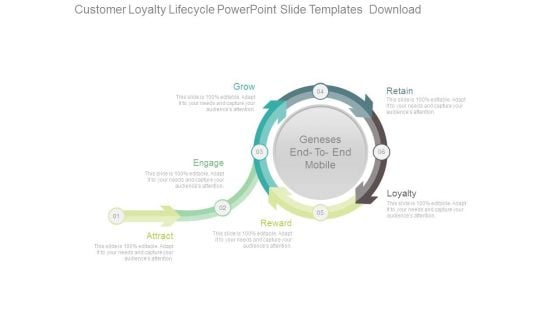
Customer Loyalty Circle Chart Powerpoint Slide Templates Download
This is a customer loyalty circle chart powerpoint slide templates download. This is a six stage process. The stages in this process are grow, engage, attract, reward, retain, loyalty.
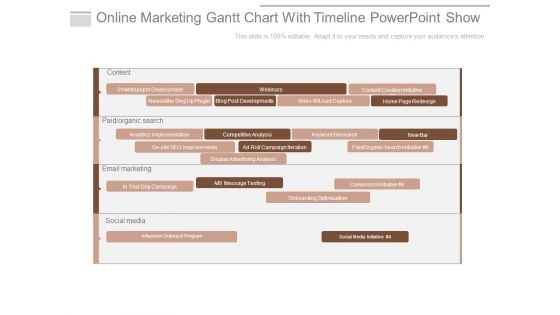
Online Marketing Gantt Chart With Timeline Powerpoint Show
This is a online marketing gantt chart with timeline powerpoint show. This is a four stage process. The stages in this process are content, whitepaper development, webinars, email marketing, social media, content creation initiative, conversion initiative.


 Continue with Email

 Home
Home


