Year Comparison
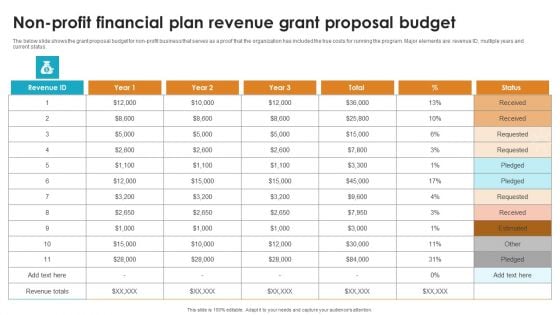
Non Profit Financial Plan Revenue Grant Proposal Budget Designs PDF
The below slide shows the grant proposal budget for non profit business that serves as a proof that the organization has included the true costs for running the program. Major elements are revenue ID, multiple years and current status.Pitch your topic with ease and precision using this Non Profit Financial Plan Revenue Grant Proposal Budget Designs PDF. This layout presents information on Grant Proposal, Plan Revenue. It is also available for immediate download and adjustment. So, changes can be made in the color, design, graphics or any other component to create a unique layout.
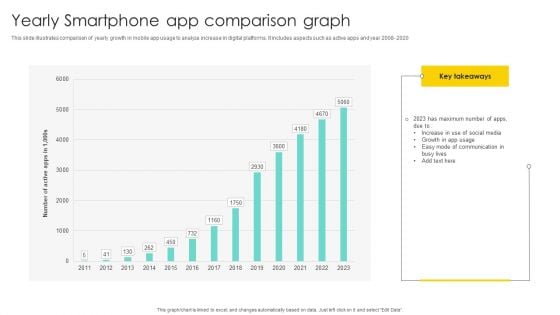
Yearly Smartphone App Comparison Graph Diagrams PDF
Showcasing this set of slides titled Yearly Smartphone App Comparison Graph Diagrams PDF. The topics addressed in these templates are Comparison Graph, Comparison Of Yearly, Growth In App . All the content presented in this PPT design is completely editable. Download it and make adjustments in color, background, font etc. as per your unique business setting.

Two Consecutive Years Revenue Comparison Topics PDF
This slide showcases profitability comparison with the help of a trend chart. It represents revenue, cost of goods sold, gross profit, net profit, etc. Pitch your topic with ease and precision using this Two Consecutive Years Revenue Comparison Topics PDF. This layout presents information on Revenue, Gross Profit, Net Income. It is also available for immediate download and adjustment. So, changes can be made in the color, design, graphics or any other component to create a unique layout.

New Year Celebration Festival PowerPoint Templates Ppt Backgrounds For Slides 1212
We present our New Year Celebration Festival PowerPoint Templates PPT Backgrounds For Slides 1212.Use our New year PowerPoint Templates because you have the right attitude and great ideas to chart the way in the new year. Use our Christmas PowerPoint Templates because this PPt slide highlights any anticipated problems, shortfalls or weak areas. Present our Festival PowerPoint Templates because this amazing layout demonstrates how they all combine to form the final product. Download and present our Holidays PowerPoint Templates because You have some unique ones up your sleeve. Expose the special features of these hotspots to the world around you. Use our Shapes PowerPoint Templates because let your words be the drops of wisdom spreading knowledge and peace like ripples through the expectant minds of your devoted followers.Use these PowerPoint slides for presentations relating to Shiny ballons and data 2013, christmas, new year, holidays, festival, shapes. The prominent colors used in the PowerPoint template are Green, Red, Blue. PowerPoint presentation experts tell us our New Year Celebration Festival PowerPoint Templates PPT Backgrounds For Slides 1212 are Stylish. Customers tell us our christmas PowerPoint templates and PPT Slides are Pretty. You can be sure our New Year Celebration Festival PowerPoint Templates PPT Backgrounds For Slides 1212 are Pleasant. PowerPoint presentation experts tell us our 2013 PowerPoint templates and PPT Slides are Energetic. PowerPoint presentation experts tell us our New Year Celebration Festival PowerPoint Templates PPT Backgrounds For Slides 1212 are Luxurious. You can be sure our and PowerPoint templates and PPT Slides will help them to explain complicated concepts. Build teams with our New Year Celebration Festival PowerPoint Templates Ppt Backgrounds For Slides 1212. Download without worries with our money back guaranteee.

2013 With Globe New Year PowerPoint Templates Ppt Backgrounds For Slides 1212
We present our 2013 With Globe New Year PowerPoint Templates PPT Backgrounds For Slides 1212.Download and present our Global PowerPoint Templates because getting it done may not be enough. Use our Business PowerPoint Templates because the NASA Space programme took mankind to the moon and so much more. Like them you too can look far beyond normal boundaries. Show them that in your mind the sky is certainly not the limit. Use our New year PowerPoint Templates because you are the Champion of your team shall anoint. Download and present our Festival PowerPoint Templates because the atmosphere in the worplace is electric. Use our Holidays PowerPoint Templates because You have some unique ones up your sleeve. Expose the special features of these hotspots to the world around you.Use these PowerPoint slides for presentations relating to New year 2013 with globe, new year, global, business, holidays, festival . The prominent colors used in the PowerPoint template are Black, White, Red. Professionals tell us our 2013 With Globe New Year PowerPoint Templates PPT Backgrounds For Slides 1212 are One-of-a-kind. You can be sure our business PowerPoint templates and PPT Slides are Royal. PowerPoint presentation experts tell us our 2013 With Globe New Year PowerPoint Templates PPT Backgrounds For Slides 1212 are visually appealing. Use our 2013 PowerPoint templates and PPT Slides are Quaint. Professionals tell us our 2013 With Globe New Year PowerPoint Templates PPT Backgrounds For Slides 1212 are Beautiful. People tell us our 2013 PowerPoint templates and PPT Slides are Sparkling. Get your experiment rolling along. Press the button with our 2013 With Globe New Year PowerPoint Templates Ppt Backgrounds For Slides 1212.

Microsoft Corporations Revenue Growth Graph Strategic Advancements By Microsofts Diagrams Pdf
This slide represents graph which ca be used to calculate the revenue growth of Microsoft in last twenty years. Microsofts revenue has been growing continuously over the past 5 years since. Presenting this PowerPoint presentation, titled Microsoft Corporations Revenue Growth Graph Strategic Advancements By Microsofts Diagrams Pdf, with topics curated by our researchers after extensive research. This editable presentation is available for immediate download and provides attractive features when used. Download now and captivate your audience. Presenting this Microsoft Corporations Revenue Growth Graph Strategic Advancements By Microsofts Diagrams Pdf. Our researchers have carefully researched and created these slides with all aspects taken into consideration. This is a completely customizable Microsoft Corporations Revenue Growth Graph Strategic Advancements By Microsofts Diagrams Pdf that is available for immediate downloading. Download now and make an impact on your audience. Highlight the attractive features available with our PPTs. This slide represents graph which ca be used to calculate the revenue growth of Microsoft in last twenty years. Microsofts revenue has been growing continuously over the past 5 years since.
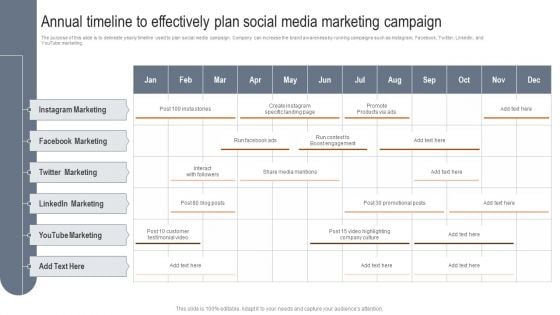
Annual Timeline To Effectively Plan Social Media Marketing Campaign Clipart PDF
The purpose of this slide is to delineate yearly timeline used to plan social media campaign. Company can increase the brand awareness by running campaigns such as Instagram, Facebook, Twitter, LinkedIn, and YouTube marketing. Pitch your topic with ease and precision using this Annual Timeline To Effectively Plan Social Media Marketing Campaign Clipart PDF. This layout presents information on Instagram Marketing, Facebook Marketing, Linkedin Marketing. It is also available for immediate download and adjustment. So, changes can be made in the color, design, graphics or any other component to create a unique layout.

Before Vs After Two Years Comparison Charts PPT Sample SS
Retrieve professionally designed Before Vs After Two Years Comparison Charts PPT Sample SS to effectively convey your message and captivate your listeners. Save time by selecting pre-made slideshows that are appropriate for various topics, from business to educational purposes. These themes come in many different styles, from creative to corporate, and all of them are easily adjustable and can be edited quickly. Access them as PowerPoint templates or as Google Slides themes. You do not have to go on a hunt for the perfect presentation because Slidegeeks got you covered from everywhere. Our Before Vs After Two Years Comparison Charts PPT Sample SS are topically designed to provide an attractive backdrop to any subject. Use them to look like a presentation pro.
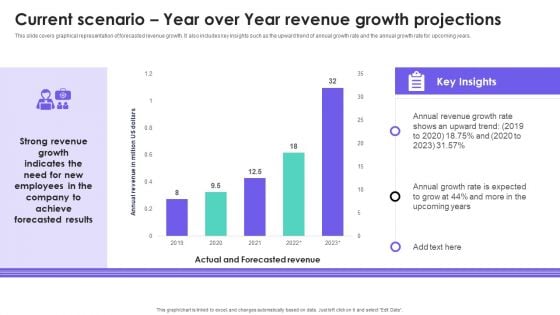
HRMS Execution Plan Current Scenario Year Over Year Revenue Growth Projections Inspiration PDF
This slide covers graphical representation of forecasted revenue growth. It also includes key insights such as the upward trend of annual growth rate and the annual growth rate for upcoming years. Presenting this PowerPoint presentation, titled HRMS Execution Plan Current Scenario Year Over Year Revenue Growth Projections Inspiration PDF, with topics curated by our researchers after extensive research. This editable presentation is available for immediate download and provides attractive features when used. Download now and captivate your audience. Presenting this HRMS Execution Plan Current Scenario Year Over Year Revenue Growth Projections Inspiration PDF. Our researchers have carefully researched and created these slides with all aspects taken into consideration. This is a completely customizable HRMS Execution Plan Current Scenario Year Over Year Revenue Growth Projections Inspiration PDF that is available for immediate downloading. Download now and make an impact on your audience. Highlight the attractive features available with our PPTs.
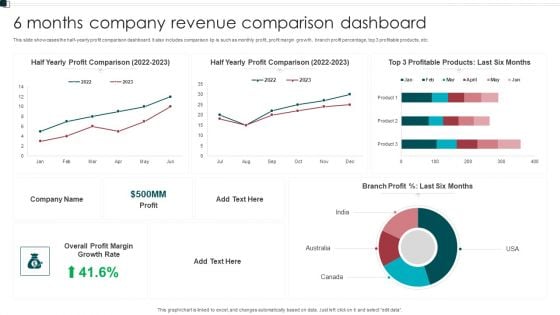
6 Months Company Revenue Comparison Dashboard Graphics PDF
This slide showcases the half yearly profit comparison dashboard. It also includes comparison kp is such as monthly profit, profit margin growth, branch profit percentage, top 3 profitable products, etc. Showcasing this set of slides titled 6 Months Company Revenue Comparison Dashboard Graphics PDF. The topics addressed in these templates are Growth Rate, Overall Profit Margin, Branch Profit. All the content presented in this PPT design is completely editable. Download it and make adjustments in color, background, font etc. as per your unique business setting.
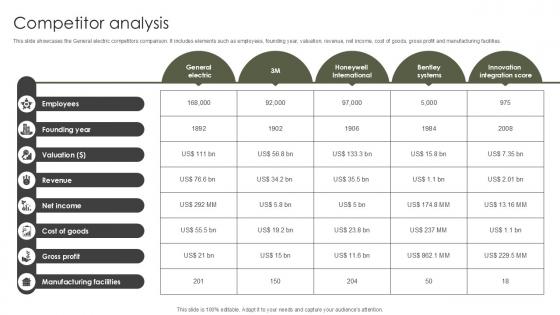
Competitor Analysis Military Aircraft Engine Manufacturing PPT PowerPoint CP SS V
This slide showcases the General electric competitors comparison. It includes elements such as employees, founding year, valuation, revenue, net income, cost of goods, gross profit and manufacturing facilities. Get a simple yet stunning designed Competitor Analysis Military Aircraft Engine Manufacturing PPT PowerPoint CP SS V. It is the best one to establish the tone in your meetings. It is an excellent way to make your presentations highly effective. So, download this PPT today from Slidegeeks and see the positive impacts. Our easy-to-edit Competitor Analysis Military Aircraft Engine Manufacturing PPT PowerPoint CP SS V can be your go-to option for all upcoming conferences and meetings. So, what are you waiting for Grab this template today. This slide showcases the General electric competitors comparison. It includes elements such as employees, founding year, valuation, revenue, net income, cost of goods, gross profit and manufacturing facilities.
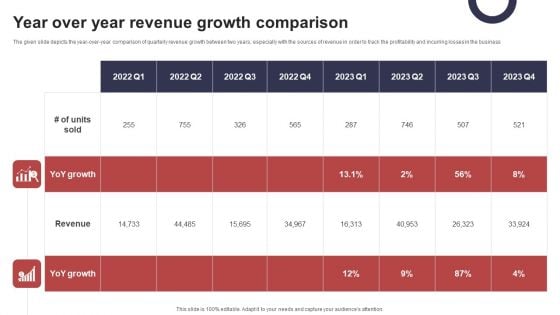
Year Over Year Revenue Growth Comparison Diagrams PDF
The given slide depicts the year over year comparison of quarterly revenue growth between two years, especially with the sources of revenue in order to track the profitability and incurring losses in the business. Showcasing this set of slides titled Year Over Year Revenue Growth Comparison Diagrams PDF. The topics addressed in these templates are Year Over Year, Revenue Growth, Comparison. All the content presented in this PPT design is completely editable. Download it and make adjustments in color, background, font etc. as per your unique business setting.
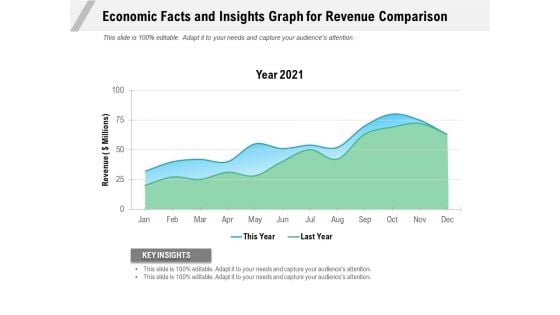
Economic Facts And Insights Graph For Revenue Comparison Ppt PowerPoint Presentation Gallery Portfolio PDF
Pitch your topic with ease and precision using this economic facts and insights graph for revenue comparison ppt powerpoint presentation gallery portfolio pdf. This layout presents information on year 2021, revenue, key insights. It is also available for immediate download and adjustment. So, changes can be made in the color, design, graphics or any other component to create a unique layout.
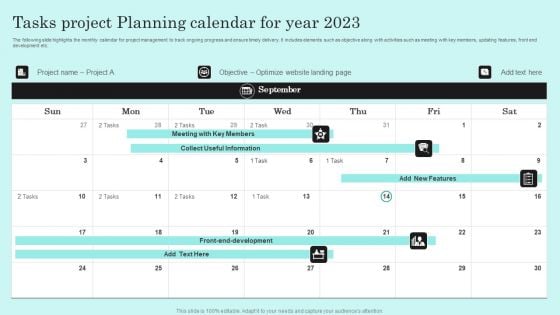
Tasks Project Planning Calendar For Year 2023 Portrait PDF
The following slide highlights the monthly calendar for project management to track ongoing progress and ensure timely delivery. It includes elements such as objective along with activities such as meeting with key members, updating features, front end development etc. Pitch your topic with ease and precision using this Tasks Project Planning Calendar For Year 2023 Portrait PDF. This layout presents information on Tasks Project, Planning, Calendar. It is also available for immediate download and adjustment. So, changes can be made in the color, design, graphics or any other component to create a unique layout.
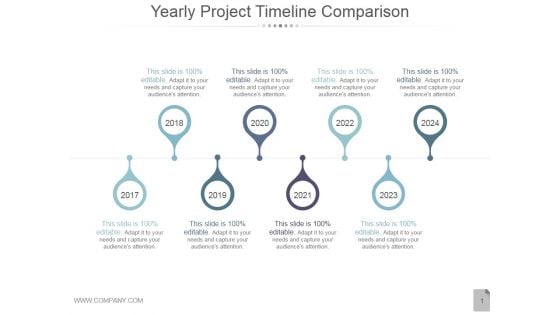
Yearly Project Timeline Comparison Ppt PowerPoint Presentation Picture
This is a yearly project timeline comparison ppt powerpoint presentation picture. This is a eight stage process. The stages in this process are timeline, business, marketing, planning, management.
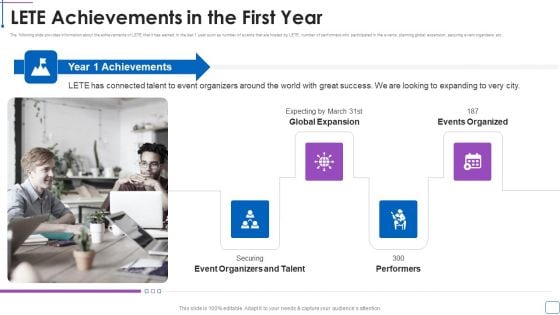
LETE Venture Funding Pitch Deck LETE Achievements In The First Year Slides PDF
The following slide provides information about the achievements of LETE that it has earned in the last 1 year such as number of events that are hosted by LETE, number of performers who participated in the events, planning global expansion, securing event organizers etc. This is a lete venture funding pitch deck lete achievements in the first year slides pdf template with various stages. Focus and dispense information on four stages using this creative set, that comes with editable features. It contains large content boxes to add your information on topics like how lete solves the problem You can also showcase facts, figures, and other relevant content using this PPT layout. Grab it now.

Website Data Yearly Comparison With Percentage Change Formats PDF
This slide showcases yearly comparison table that can help organization to identify the change in current year website statistics as compared to previous year. Its key metrics are total traffic, conversion rate, pages or session, pageviews and bounce rate. Pitch your topic with ease and precision using this Website Data Yearly Comparison With Percentage Change Formats PDF. This layout presents information on Website Data Yearly Comparison With Percentage Change. It is also available for immediate download and adjustment. So, changes can be made in the color, design, graphics or any other component to create a unique layout.
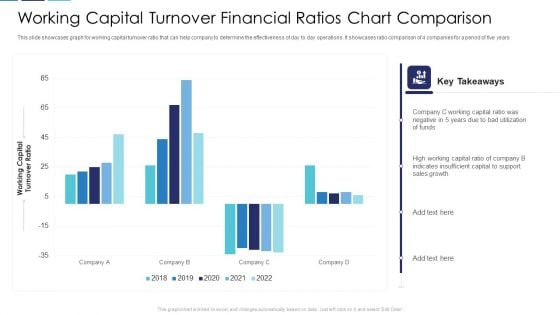
Working Capital Turnover Financial Ratios Chart Comparison Clipart PDF
This slide showcases graph for working capital turnover ratio that can help company to determine the effectiveness of day to day operations. It showcases ratio comparison of 4 companies for a period of five years Pitch your topic with ease and precision using this working capital turnover financial ratios chart comparison clipart pdf. This layout presents information on working capital turnover financial ratios chart comparison. It is also available for immediate download and adjustment. So, changes can be made in the color, design, graphics or any other component to create a unique layout.
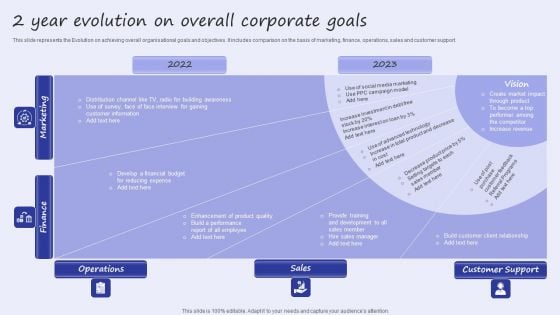
2 Year Evolution On Overall Corporate Goals Template PDF
This slide represents the Evolution on achieving overall organisational goals and objectives. It includes comparison on the basis of marketing, finance, operations, sales and customer support. Pitch your topic with ease and precision using this 2 Year Evolution On Overall Corporate Goals Template PDF. This layout presents information on Finance, Operations, Customer Support. It is also available for immediate download and adjustment. So, changes can be made in the color, design, graphics or any other component to create a unique layout.
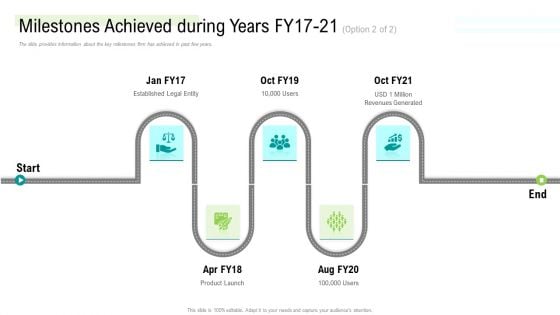
Management Acquisition As Exit Strategy Ownership Transfer Milestones Achieved During Years Fy17 21 Users Diagrams PDF
The slide provides information about the key milestones firm has achieved in past few years. This is a management acquisition as exit strategy ownership transfer milestones achieved during years fy17 21 users diagrams pdf template with various stages. Focus and dispense information on five stages using this creative set, that comes with editable features. It contains large content boxes to add your information on topics like milestones achieved during years fy17 21. You can also showcase facts, figures, and other relevant content using this PPT layout. Grab it now.
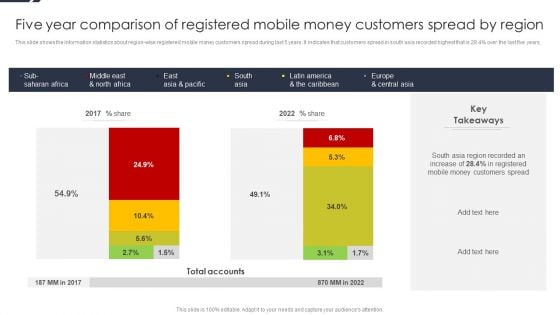
Five Year Comparison Of Registered Mobile Money Customers Spread By Region Introduction PDF
This slide shows the information statistics about region wise registered mobile money customers spread during last 5 years. It indicates that customers spread in south asia recorded highest that is 28.4persent over the last five years.Deliver and pitch your topic in the best possible manner with this Five Year Comparison Of Registered Mobile Money Customers Spread By Region Introduction PDF. Use them to share invaluable insights on Region Recorded, Mobile Money, Customers Spread and impress your audience. This template can be altered and modified as per your expectations. So, grab it now.
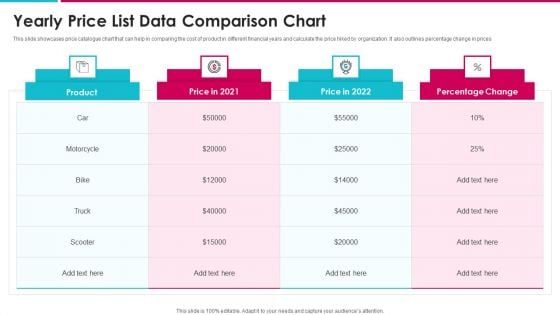
Yearly Price List Data Comparison Chart Structure PDF
This slide showcases price catalogue chart that can help in comparing the cost of product in different financial years and calculate the price hiked by organization. It also outlines percentage change in prices Showcasing this set of slides titled yearly price list data comparison chart structure pdf. The topics addressed in these templates are yearly price list data comparison chart. All the content presented in this PPT design is completely editable. Download it and make adjustments in color, background, font etc. as per your unique business setting.
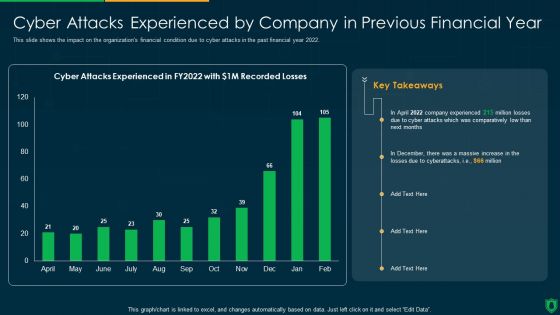
Info Security Cyber Attacks Experienced By Company In Previous Financial Year Ppt PowerPoint Presentation Gallery Slideshow PDF
This slide shows the impact on the organizations financial condition due to cyber attacks in the past financial year 2022. Deliver an awe inspiring pitch with this creative info security cyber attacks experienced by company in previous financial year ppt powerpoint presentation gallery slideshow pdf bundle. Topics like comparatively low, cyber attacks experienced can be discussed with this completely editable template. It is available for immediate download depending on the needs and requirements of the user.
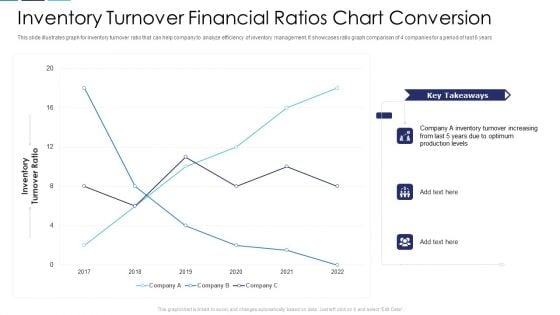
Inventory Turnover Financial Ratios Chart Conversion Portrait PDF
This slide illustrates graph for inventory turnover ratio that can help company to analyze efficiency of inventory management. It showcases ratio graph comparison of 4 companies for a period of last 6 years Pitch your topic with ease and precision using this inventory turnover financial ratios chart conversion portrait pdf. This layout presents information on inventory turnover financial ratios chart conversion. It is also available for immediate download and adjustment. So, changes can be made in the color, design, graphics or any other component to create a unique layout.

Cloud Kitchen And Dine In Restaurant Sales Comparison Global Virtual Restaurant Infographics Pdf
The following slide highlights comparison of cloud kitchen and dine in restaurants based on gross food sales of previous years. It presents yearly sales growth of cloud kitchen and direct restaurant. Find highly impressive Cloud Kitchen And Dine In Restaurant Sales Comparison Global Virtual Restaurant Infographics Pdf on Slidegeeks to deliver a meaningful presentation. You can save an ample amount of time using these presentation templates. No need to worry to prepare everything from scratch because Slidegeeks experts have already done a huge research and work for you. You need to download Cloud Kitchen And Dine In Restaurant Sales Comparison Global Virtual Restaurant Infographics Pdf for your upcoming presentation. All the presentation templates are 100 percent editable and you can change the color and personalize the content accordingly. Download now. The following slide highlights comparison of cloud kitchen and dine in restaurants based on gross food sales of previous years. It presents yearly sales growth of cloud kitchen and direct restaurant.
Year Over Year Comparison Of Global Retail Market Icons PDF
Presenting Year Over Year Comparison Of Global Retail Market Icons PDF to dispense important information. This template comprises three stages. It also presents valuable insights into the topics including Year Over Year, Comparison Global, Retail Market. This is a completely customizable PowerPoint theme that can be put to use immediately. So, download it and address the topic impactfully.
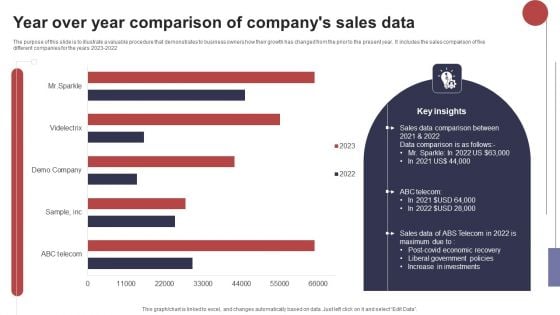
Year Over Year Comparison Of Companys Sales Data Microsoft PDF
The purpose of this slide is to illustrate a valuable procedure that demonstrates to business owners how their growth has changed from the prior to the present year. It includes the sales comparison of five different companies for the years 2023 2022. Pitch your topic with ease and precision using this Year Over Year Comparison Of Companys Sales Data Microsoft PDF. This layout presents information on Sales Data Comparison, Liberal Government, Increase Investments. It is also available for immediate download and adjustment. So, changes can be made in the color, design, graphics or any other component to create a unique layout.

Social Media Global Usage Year Over Year Comparison Professional PDF
The purpose of this slide is to showcase the utilization of social media marketing worldwide with an upward trend influenced by technical advancements. The years include 2013 2023 along with the key insights. Showcasing this set of slides titled Social Media Global Usage Year Over Year Comparison Professional PDF. The topics addressed in these templates are Social Media, Technological Advancement, Technical Innovations. All the content presented in this PPT design is completely editable. Download it and make adjustments in color, background, font etc. as per your unique business setting.
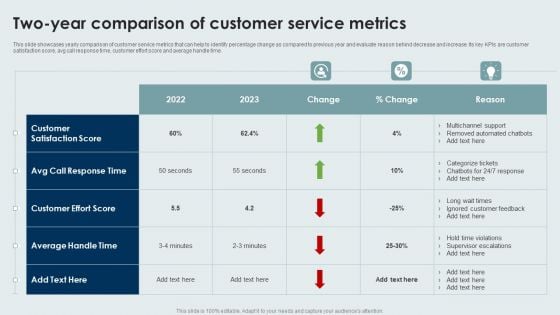
Two Year Comparison Of Customer Service Metrics Information PDF
This slide showcases yearly comparison of customer service metrics that can help to identify percentage change as compared to previous year and evaluate reason behind decrease and increase. Its key KPIs are customer satisfaction score, avg call response time, customer effort score and average handle time. Pitch your topic with ease and precision using this Two Year Comparison Of Customer Service Metrics Information PDF. This layout presents information on Customer Effort Score, Customer Satisfaction Score, Average Handle Time. It is also available for immediate download and adjustment. So, changes can be made in the color, design, graphics or any other component to create a unique layout.

Yearly Comparison Report Of Business Sales Ppt Portfolio Rules PDF
Showcasing this set of slides titled yearly comparison report of business sales ppt portfolio rules pdf. The topics addressed in these templates are yearly comparison report of business sales. All the content presented in this PPT design is completely editable. Download it and make adjustments in color, background, font etc. as per your unique business setting.

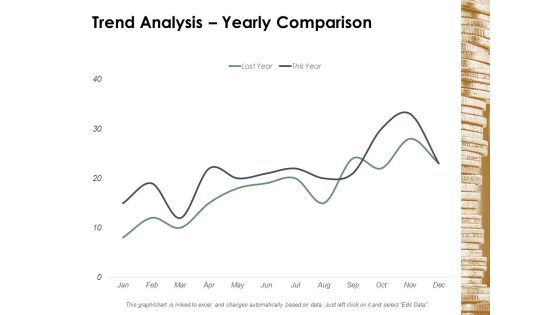
Trend Analysis Yearly Comparison Ppt Powerpoint Presentation Professional Example
This is a trend analysis yearly comparison ppt powerpoint presentation professional example. This is a two stage process. The stages in this process are finance, marketing, management, investment, analysis.
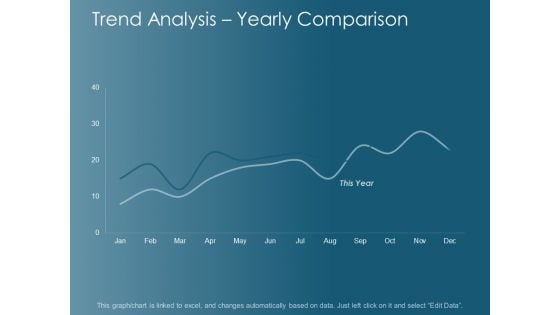
Trend Analysis Yearly Comparison Ppt Powerpoint Presentation Professional Show
This is a trend analysis yearly comparison ppt powerpoint presentation professional show. This is a two stage process. The stages in this process are finance, marketing, management, investment, analysis.
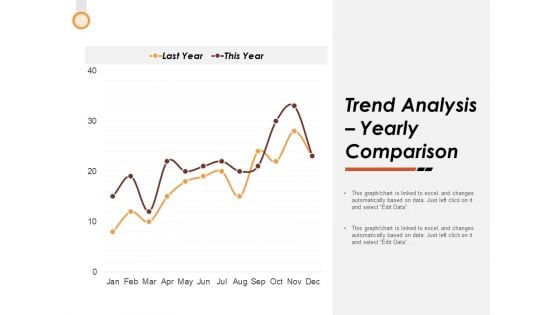
Trend Analysis Yearly Comparison Ppt Powerpoint Presentation Layouts Slideshow
This is a trend analysis yearly comparison ppt powerpoint presentation layouts slideshow. This is a two stage process. The stages in this process are finance, marketing, management, investment, analysis.
Trend Analysis Yearly Comparison Ppt PowerPoint Presentation Summary Visual Aids
This is a trend analysis yearly comparison ppt powerpoint presentation summary visual aids. This is a two stage process. The stages in this process are finance, strategy, marketing, management, business.
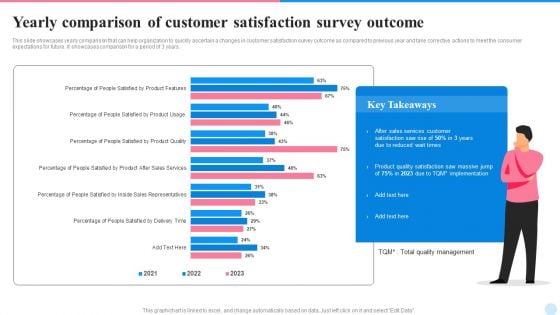
Yearly Comparison Of Customer Satisfaction Survey Outcome Demonstration PDF
This slide showcases yearly comparison that can help organization to quickly ascertain a changes in customer satisfaction survey outcome as compared to previous year and take corrective actions to meet the consumer expectations for future. It showcases comparison for a period of 3 years. Showcasing this set of slides titled Yearly Comparison Of Customer Satisfaction Survey Outcome Demonstration PDF. The topics addressed in these templates are Sales Services Customer, Implementation, Product Quality Satisfaction. All the content presented in this PPT design is completely editable. Download it and make adjustments in color, background, font etc. as per your unique business setting.
Yearly Comparison Graph Icon For Operating Profit Margin Topics PDF
Persuade your audience using this Yearly Comparison Graph Icon For Operating Profit Margin Topics PDF. This PPT design covers four stages, thus making it a great tool to use. It also caters to a variety of topics including Yearly Comparison Graph, Icon For Operating, Profit Margin. Download this PPT design now to present a convincing pitch that not only emphasizes the topic but also showcases your presentation skills.
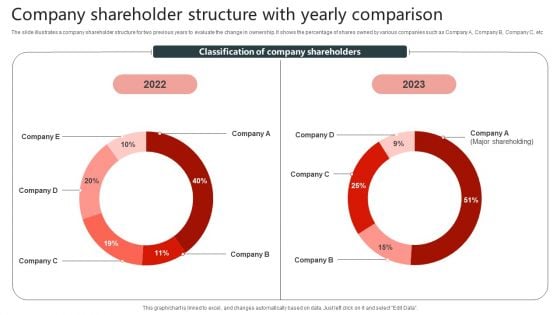
Company Shareholder Structure With Yearly Comparison Infographics PDF
The slide illustrates a company shareholder structure for two previous years to evaluate the change in ownership. It shows the percentage of shares owned by various companies such as Company A, Company B, Company C, etc. Pitch your topic with ease and precision using this Company Shareholder Structure With Yearly Comparison Infographics PDF. This layout presents information on Structure With Yearly Comparison, Company Shareholder. It is also available for immediate download and adjustment. So, changes can be made in the color, design, graphics or any other component to create a unique layout.
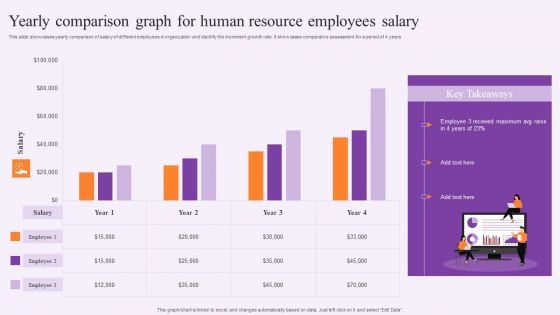
Yearly Comparison Graph For Human Resource Employees Salary Template PDF
This slide showcases yearly comparison of salary of different employees in organization and identify the increment growth rate. It showcases comparative assessment for a period of 4 years. Pitch your topic with ease and precision using this Yearly Comparison Graph For Human Resource Employees Salary Template PDF. This layout presents information on Human Resource, Employees Salary. It is also available for immediate download and adjustment. So, changes can be made in the color, design, graphics or any other component to create a unique layout.
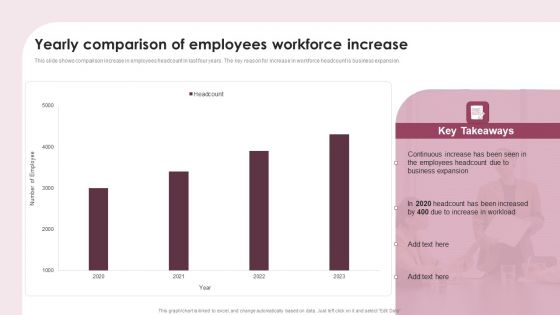
Yearly Comparison Of Employees Workforce Increase Ppt Styles Slide PDF
This slide shows comparison increase in employees headcount in last four years. The key reason for increase in workforce headcount is business expansion. Showcasing this set of slides titled Yearly Comparison Of Employees Workforce Increase Ppt Styles Slide PDF. The topics addressed in these templates are Continuous Increase, Employees Headcount, Business Expansion. All the content presented in this PPT design is completely editable. Download it and make adjustments in color, background, font etc. as per your unique business setting.
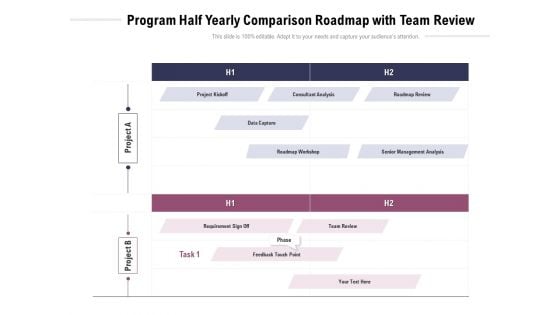
Program Half Yearly Comparison Roadmap With Team Review Microsoft
Presenting our jaw dropping program half yearly comparison roadmap with team review microsoft. You can alternate the color, font size, font type, and shapes of this PPT layout according to your strategic process. This PPT presentation is compatible with Google Slides and is available in both standard screen and widescreen aspect ratios. You can also download this well researched PowerPoint template design in different formats like PDF, JPG, and PNG. So utilize this visually appealing design by clicking the download button given below.
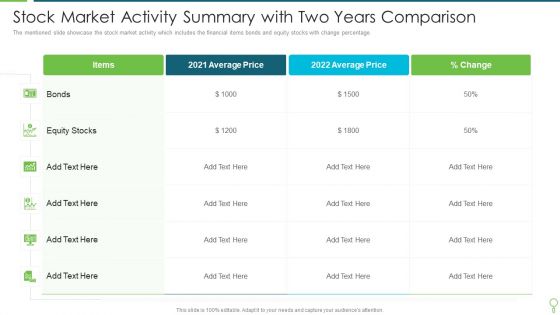
Stock Market Activity Summary With Two Years Comparison Infographics PDF
The mentioned slide showcase the stock market activity which includes the financial items bonds and equity stocks with change percentage. Pitch your topic with ease and precision using this Stock Market Activity Summary With Two Years Comparison Infographics PDF. This layout presents information on Average, Price, Equity Stocks. It is also available for immediate download and adjustment. So, changes can be made in the color, design, graphics or any other component to create a unique layout.
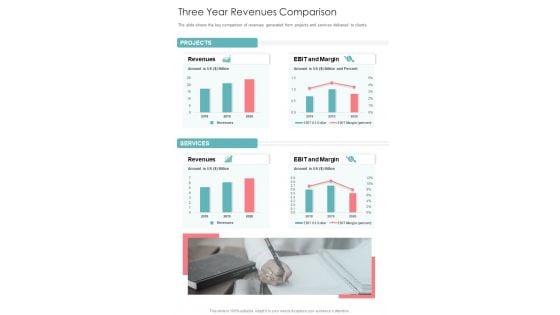
Three Year Revenues Comparison One Pager Documents
The slide shows the key comparison of revenues generated from projects and services delivered to clients. Presenting you a fantastic Three Year Revenues Comparison One Pager Documents. This piece is crafted on hours of research and professional design efforts to ensure you have the best resource. It is completely editable and its design allow you to rehash its elements to suit your needs. Get this Three Year Revenues Comparison One Pager Documents A4 One-pager now.

Yearly Comparison For Operating Profit Margin And Expenses Demonstration PDF
This slide showcases comparison table that can help organization to compare operating profit margin for a period of five years. Its key components are revenue, gross profit, expenses, operating expenses, operating profit and operating margin. Showcasing this set of slides titled Yearly Comparison For Operating Profit Margin And Expenses Demonstration PDF. The topics addressed in these templates are Gross Profit, Revenue, Operating Expenses. All the content presented in this PPT design is completely editable. Download it and make adjustments in color, background, font etc. as per your unique business setting.
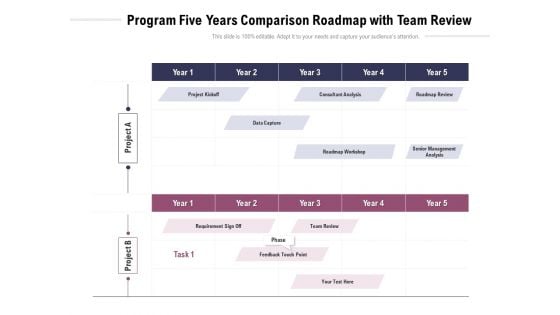
Program Five Years Comparison Roadmap With Team Review Ideas
Presenting the program five years comparison roadmap with team review ideas. The template includes a roadmap that can be used to initiate a strategic plan. Not only this, the PowerPoint slideshow is completely editable and you can effortlessly modify the font size, font type, and shapes according to your needs. This PPT slide can be easily reached in standard screen and widescreen aspect ratios. The set is also available in various formats like PDF, PNG, and JPG. So download and use it multiple times as per your knowledge.
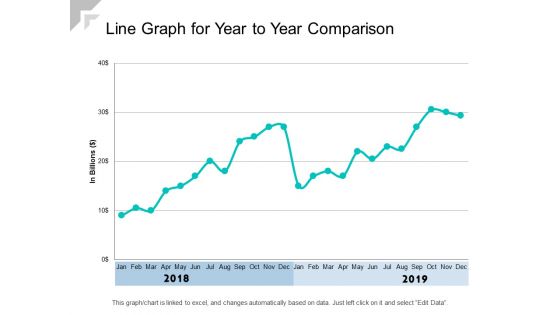
Line Graph For Year To Year Comparison Ppt PowerPoint Presentation Show Graphics Example
Presenting this set of slides with name line graph for year to year comparison ppt powerpoint presentation show graphics example. The topics discussed in these slides are revenue trend, bar chart, financial. This is a completely editable PowerPoint presentation and is available for immediate download. Download now and impress your audience.
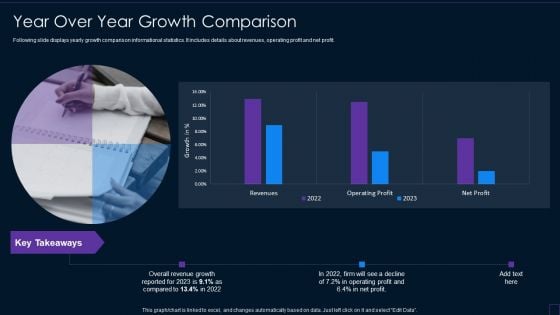
Brand Development Manual Year Over Year Growth Comparison Ideas PDF
Following slide displays yearly growth comparison informational statistics. It includes details about revenues, operating profit and net profit. Deliver and pitch your topic in the best possible manner with this Brand Development Manual Year Over Year Growth Comparison Ideas PDF Use them to share invaluable insights on Year Over Year Growth Comparison and impress your audience. This template can be altered and modified as per your expectations. So, grab it now.
Chart Illustrating Two Year Comparison Of Business Data Icon Ppt Outline Example Topics PDF
Persuade your audience using this Chart Illustrating Two Year Comparison Of Business Data Icon Ppt Outline Example Topics PDF. This PPT design covers three stages, thus making it a great tool to use. It also caters to a variety of topics including chart illustrating two year comparison of business data icon. Download this PPT design now to present a convincing pitch that not only emphasizes the topic but also showcases your presentation skills.

Introduction To Mobile Money In Developing Countries Five Year Comparison Of Registered Demonstration PDF
This slide shows the information statistics about region wise registered mobile money customers spread during last 5 years. It indicates that customers spread in South Asia recorded highest that is 28.4persent over the last five years.Deliver an awe inspiring pitch with this creative introduction to mobile money in developing countries five year comparison of registered demonstration pdf bundle. Topics like five year comparison of registered mobile money customers spread by region can be discussed with this completely editable template. It is available for immediate download depending on the needs and requirements of the user.
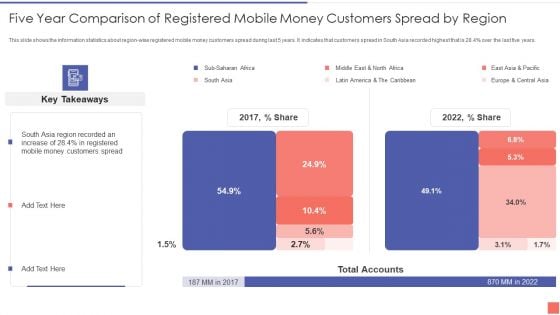
Five Year Comparison Of Registered Mobile Money Customers Spread By Region Graphics PDF
This slide shows the information statistics about region wise registered mobile money customers spread during last 5 years. It indicates that customers spread in South Asia recorded highest that is 28.4 percentage over the last five years. Deliver an awe inspiring pitch with this creative Five Year Comparison Of Registered Mobile Money Customers Spread By Region Graphics PDF bundle. Topics like Five Year Comparison Of Registered Mobile Money Customers Spread By Region can be discussed with this completely editable template. It is available for immediate download depending on the needs and requirements of the user.
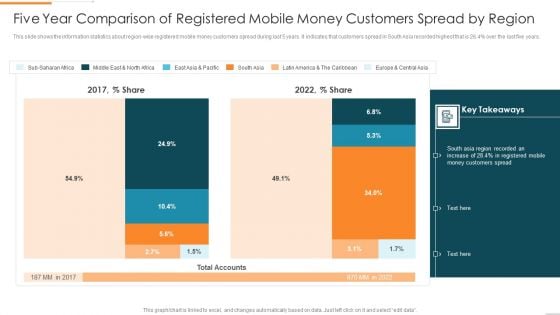
Enhanced Customer Banking Experience With Mobile Five Year Comparison Of Registered Mobile Background PDF
This slide shows the information statistics about region-wise registered mobile money customers spread during last 5 years. It indicates that customers spread in South Asia recorded highest that is 28.4percent over the last five years.Deliver an awe inspiring pitch with this creative Enhanced Customer Banking Experience With Mobile Five Year Comparison Of Registered Mobile Background PDF bundle. Topics like Five Year Comparison Of Registered Mobile Money Customers Spread By Region can be discussed with this completely editable template. It is available for immediate download depending on the needs and requirements of the user.
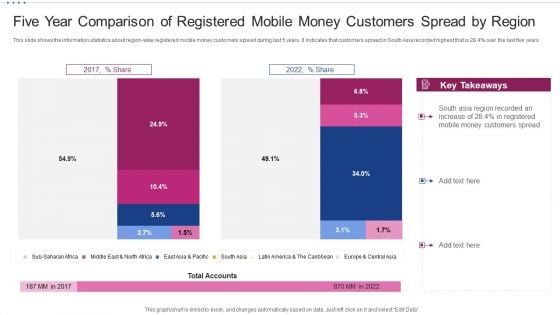
M Banking System Improving Consumer Five Year Comparison Of Registered Mobile Money Topics PDF
This slide shows the information statistics about region-wise registered mobile money customers spread during last 5 years. It indicates that customers spread in South Asia recorded highest that is 28.4 percent over the last five years. This is a m banking system improving consumer five year comparison of registered mobile money topics pdf template with various stages. Focus and dispense information on one stages using this creative set, that comes with editable features. It contains large content boxes to add your information on topics like total accounts, customers spread, mobile money. You can also showcase facts, figures, and other relevant content using this PPT layout. Grab it now.
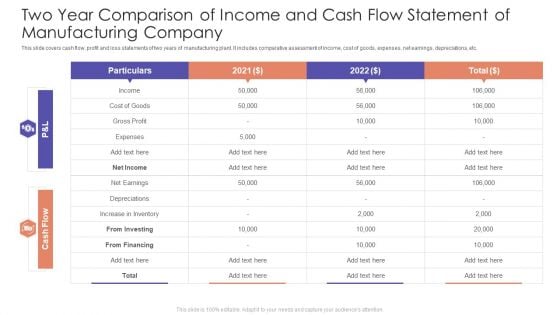
Two Year Comparison Of Income And Cash Flow Statement Of Manufacturing Company Demonstration PDF
This slide covers cash flow, profit and loss statements of two years of manufacturing plant. It includes comparative assessment of income, cost of goods, expenses, net earnings, depreciations, etc. Pitch your topic with ease and precision using this Two Year Comparison Of Income And Cash Flow Statement Of Manufacturing Company Demonstration PDF. This layout presents information on Cost Goods, Income, Cash Flow, Net Income. It is also available for immediate download and adjustment. So, changes can be made in the color, design, graphics or any other component to create a unique layout.
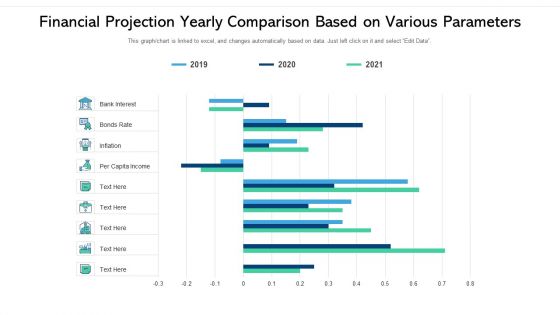
Financial Projection Yearly Comparison Based On Various Parameters Ppt Ideas Infographics PDF
Showcasing this set of slides titled financial projection yearly comparison based on various parameters ppt ideas infographics pdf. The topics addressed in these templates are financial projection yearly comparison based on various parameters. All the content presented in this PPT design is completely editable. Download it and make adjustments in color, background, font etc. as per your unique business setting.
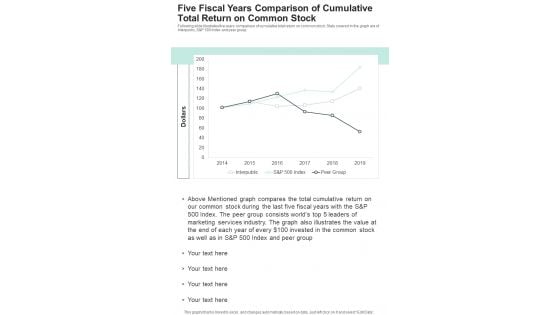
Five Fiscal Years Comparison Of Cumulative Total Return On Common Stock One Pager Documents
Following slide illustrates five years comparison of cumulative total return on common stock. Stats covered in the graph are of interpublic, S and P 500 Index and peer group. Presenting you a fantastic Five Fiscal Years Comparison Of Cumulative Total Return On Common Stock One Pager Documents. This piece is crafted on hours of research and professional design efforts to ensure you have the best resource. It is completely editable and its design allow you to rehash its elements to suit your needs. Get this Five Fiscal Years Comparison Of Cumulative Total Return On Common Stock One Pager Documents A4 One-pager now.
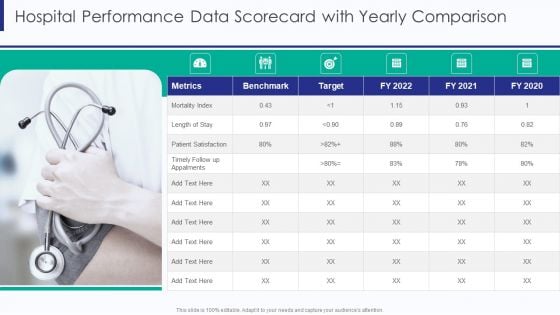
Healthcare Hospital Performance Data Scorecard With Yearly Comparison Ppt Model Templates PDF
Deliver and pitch your topic in the best possible manner with this Healthcare Hospital Performance Data Scorecard With Yearly Comparison Ppt Model Templates PDF. Use them to share invaluable insights on Mortality Index Metrics, Patient Satisfaction Target, Length Of Stay and impress your audience. This template can be altered and modified as per your expectations. So, grab it now.
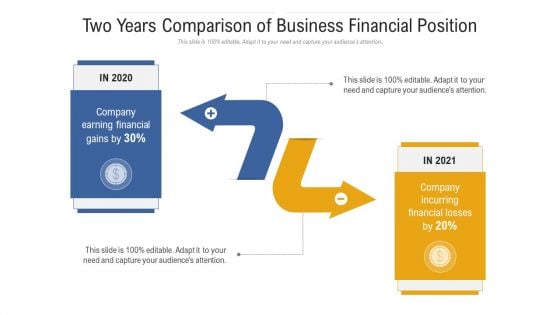
Two Years Comparison Of Business Financial Position Ppt PowerPoint Presentation Model Maker PDF
Presenting two years comparison of business financial position ppt powerpoint presentation model maker pdf to provide visual cues and insights. Share and navigate important information on two stages that need your due attention. This template can be used to pitch topics like company earning financial gains, company incurring financial losses, 2020 to 2021. In addtion, this PPT design contains high resolution images, graphics, etc, that are easily editable and available for immediate download.

Property Investment Assessment Report Highlighting Two Years Comparison Ppt PowerPoint Presentation Inspiration Display PDF
Showcasing this set of slides titled property investment assessment report highlighting two years comparison ppt powerpoint presentation inspiration display pdf. The topics addressed in these templates are revenues, expenses, total revenues, total expenses, rental income, operating income, net income. All the content presented in this PPT design is completely editable. Download it and make adjustments in color, background, font etc. as per your unique business setting.
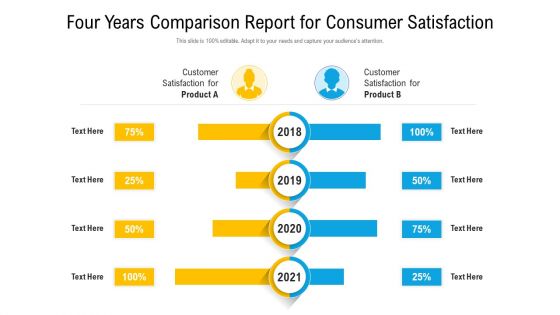
Four Years Comparison Report For Consumer Satisfaction Ppt PowerPoint Presentation Slides Topics PDF
Presenting four years comparison report for consumer satisfaction ppt powerpoint presentation slides topics pdf to provide visual cues and insights. Share and navigate important information on four stages that need your due attention. This template can be used to pitch topics like customer satisfaction for 2018 to 2021. In addtion, this PPT design contains high resolution images, graphics, etc, that are easily editable and available for immediate download.
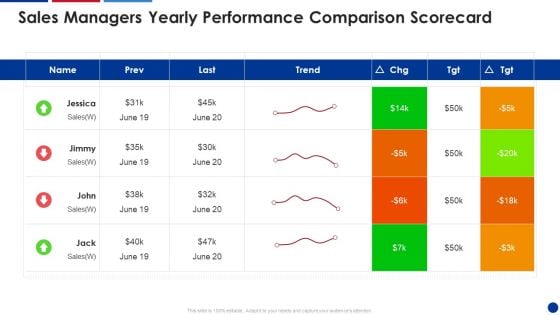
Sales Managers Yearly Performance Comparison Scorecard Designs PDF
Deliver and pitch your topic in the best possible manner with this Sales Managers Yearly Performance Comparison Scorecard Designs PDF. Use them to share invaluable insights on Sales Managers, Yearly Performance, Comparison Scorecard and impress your audience. This template can be altered and modified as per your expectations. So, grab it now.
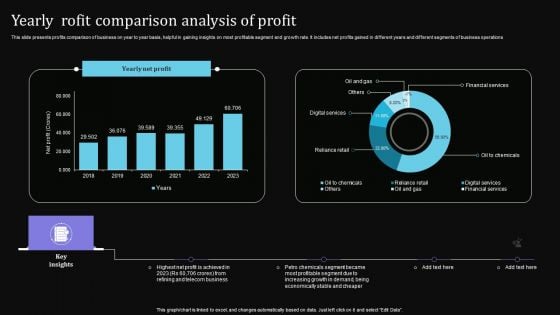
Yearly Rofit Comparison Analysis Of Profit Slides PDF
This slide presents profits comparison of business on year to year basis, helpful in gaining insights on most profitable segment and growth rate. It includes net profits gained in different years and different segments of business operations. Showcasing this set of slides titled Yearly Rofit Comparison Analysis Of Profit Slides PDF. The topics addressed in these templates are Highest Net Profit, Telecom Business, Stable Cheaper. All the content presented in this PPT design is completely editable. Download it and make adjustments in color, background, font etc. as per your unique business setting.


 Continue with Email

 Home
Home


