Yearly Marketing Calendar
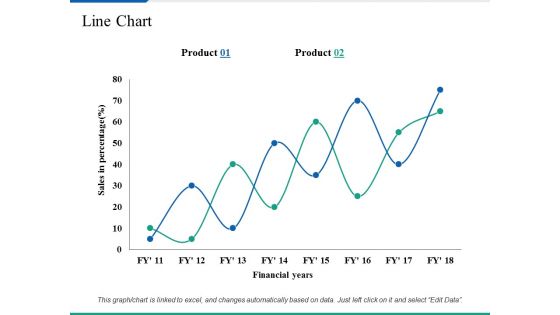
Line Chart Ppt PowerPoint Presentation Summary Clipart Images
This is a line chart ppt powerpoint presentation summary clipart images. This is a two stage process. The stages in this process are business, marketing, sales in percentage, financial years, strategy.
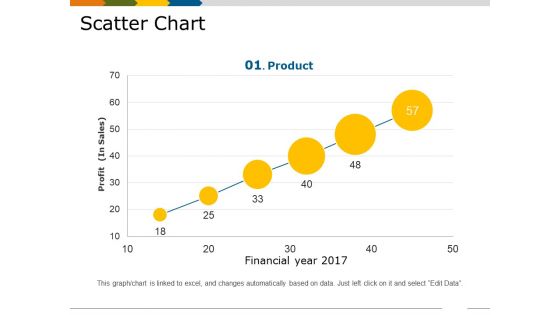
Scatter Chart Template 1 Ppt PowerPoint Presentation Show Slides
This is a scatter chart template 1 ppt powerpoint presentation show slides. This is a six stage process. The stages in this process are financial year, profit in sales, growth, business, marketing, product.
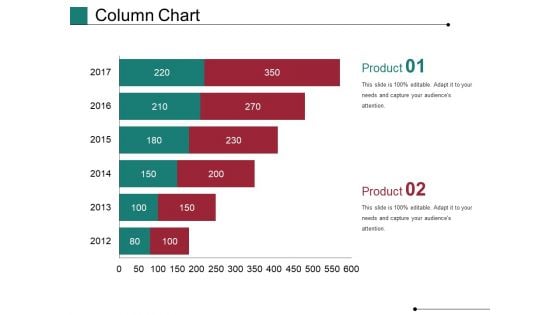
Column Chart Ppt PowerPoint Presentation Show Master Slide
This is a column chart ppt powerpoint presentation show master slide. This is a six stage process. The stages in this process are financial, years, business, marketing, finance, graph.
Column Chart Ppt PowerPoint Presentation Infographic Template Icon
This is a column chart ppt powerpoint presentation infographic template icon. This is a two stage process. The stages in this process are business, marketing, sales in percentage, financial year, graph.
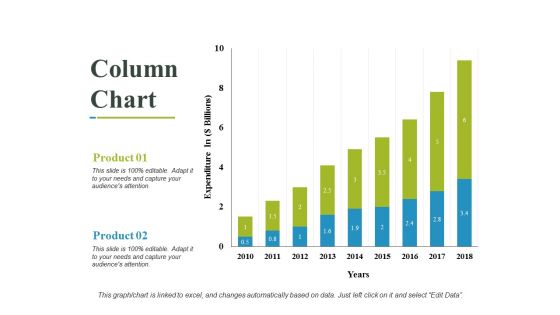
Column Chart Ppt PowerPoint Presentation Outline Design Ideas
This is a column chart ppt powerpoint presentation outline design ideas. This is a two stage process. The stages in this process are business, years, expenditure in, marketing, finance.
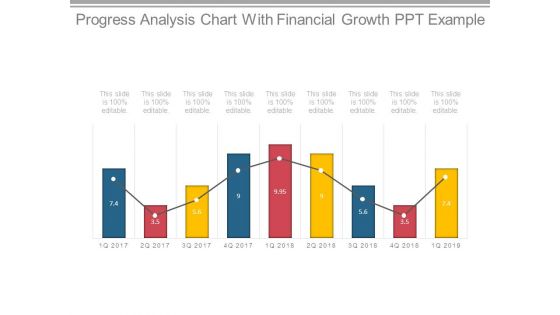
Progress Analysis Chart With Financial Growth Ppt Example
This is a progress analysis chart with financial growth ppt example. This is a nine stage process. The stages in this process are chart, years, business, growth, marketing, management.

Scatter Bubble Chart Ppt PowerPoint Presentation Professional Model
This is a scatter bubble chart ppt powerpoint presentation professional model. This is a six stage process. The stages in this process are sales in profit, financial year, growth, business, marketing, strategy.
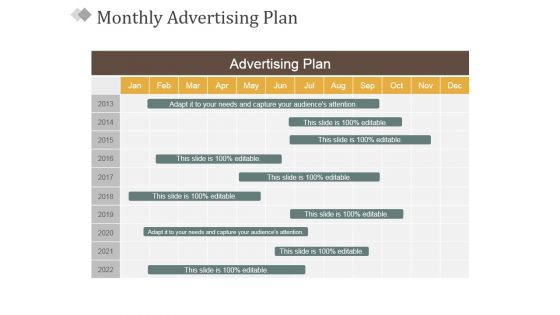
Monthly Advertising Plan Ppt PowerPoint Presentation Outline Smartart
This is a monthly advertising plan ppt powerpoint presentation outline smartart. This is a ten stage process. The stages in this process are advertising plan, years, business, management, marketing.
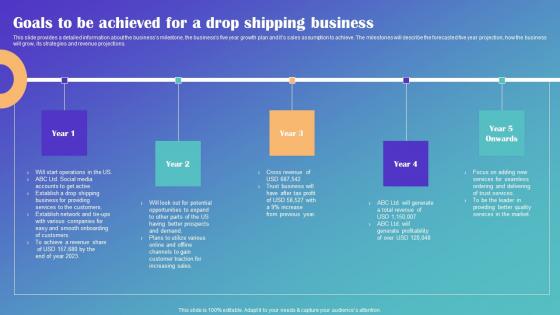
Goals To Be Achieved For A Drop Shipping Business Drop Shipping Business Plan Information Pdf
This slide provides a detailed information about the businesss milestone, the businesss five year growth plan and its sales assumption to achieve. The milestones will describe the forecasted five year projection, how the business will grow, its strategies and revenue projections. Slidegeeks is one of the best resources for PowerPoint templates. You can download easily and regulate Goals To Be Achieved For A Drop Shipping Business Drop Shipping Business Plan Information Pdf for your personal presentations from our wonderful collection. A few clicks is all it takes to discover and get the most relevant and appropriate templates. Use our Templates to add a unique zing and appeal to your presentation and meetings. All the slides are easy to edit and you can use them even for advertisement purposes. This slide provides a detailed information about the businesss milestone, the businesss five year growth plan and its sales assumption to achieve. The milestones will describe the forecasted five year projection, how the business will grow, its strategies and revenue projections.
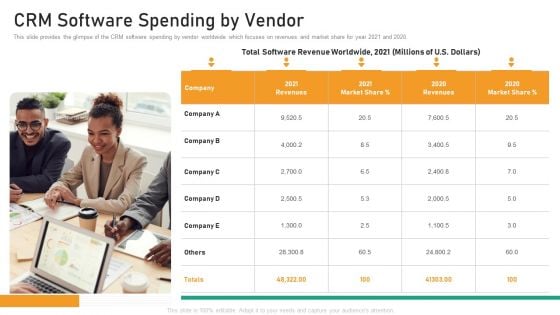
CRM Software Spending By Vendor Clipart PDF
This slide provides the glimpse of the CRM software spending by vendor worldwide which focuses on revenues and market share for year 2021 and 2020.Presenting crm software spending by vendor clipart pdf to provide visual cues and insights. Share and navigate important information on one stage that need your due attention. This template can be used to pitch topics like crm software spending by vendor. In addtion, this PPT design contains high resolution images, graphics, etc, that are easily editable and available for immediate download.
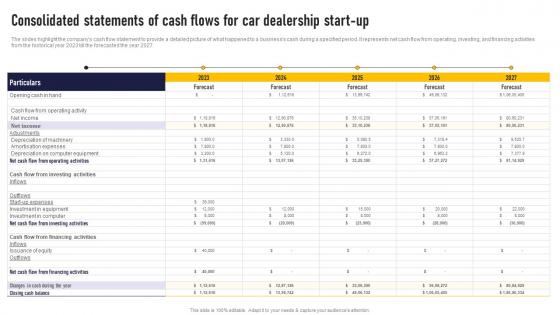
Consolidated Statements Of Cash Flows For Car Dealership Auto Dealership Business Plan Formats Pdf
The slides highlight the companys cash flow statement to provide a detailed picture of what happened to a businesss cash during a specified period. It represents net cash flow from operating, investing, and financing activities from the historical year 2023 till the forecasted the year 2027. Take your projects to the next level with our ultimate collection of Consolidated Statements Of Cash Flows For Car Dealership Auto Dealership Business Plan Formats Pdf Slidegeeks has designed a range of layouts that are perfect for representing task or activity duration, keeping track of all your deadlines at a glance. Tailor these designs to your exact needs and give them a truly corporate look with your own brand colors they well make your projects stand out from the rest. The slides highlight the companys cash flow statement to provide a detailed picture of what happened to a businesss cash during a specified period. It represents net cash flow from operating, investing, and financing activities from the historical year 2023 till the forecasted the year 2027.
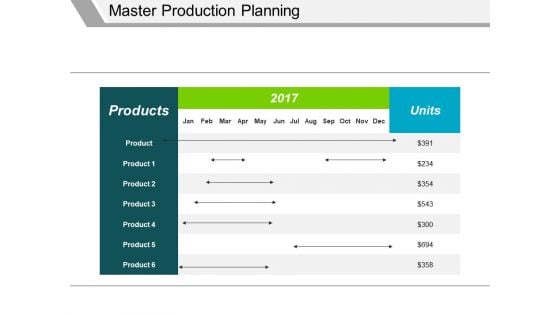
Master Production Planning Template 1 Ppt PowerPoint Presentation File Formats
This is a master production planning template 1 ppt powerpoint presentation file formats. This is a two stage process. The stages in this process are product, years, business, marketing, planning.

Effective Revenue Generation Model For Interior Design Start Up Luxury Interior Design Background Pdf
The slide shows the effective revenue model of the interior design industry, which displays the cost incurred and the various sources of income. The revenue is calculated based on the percentage of the population captured by the company from the year 2023 to the year 2027. Are you searching for a Effective Revenue Generation Model For Interior Design Start Up Luxury Interior Design Background Pdf that is uncluttered, straightforward, and original It is easy to edit, and you can change the colors to suit your personal or business branding. For a presentation that expresses how much effort you have put in, this template is ideal With all of its features, including tables, diagrams, statistics, and lists, it is perfect for a business plan presentation. Make your ideas more appealing with these professional slides. Download Effective Revenue Generation Model For Interior Design Start Up Luxury Interior Design Background Pdf from Slidegeeks today. The slide shows the effective revenue model of the interior design industry, which displays the cost incurred and the various sources of income. The revenue is calculated based on the percentage of the population captured by the company from the year 2023 to the year 2027.
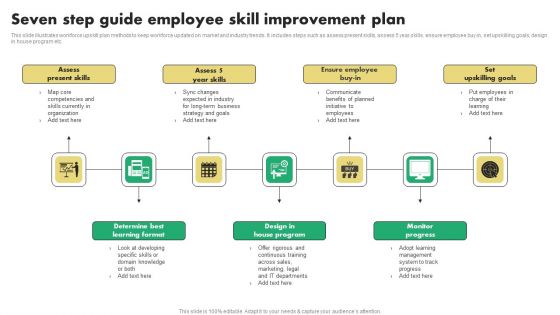
Seven Step Guide Employee Skill Improvement Plan Pictures PDF
This slide illustrates workforce upskill plan methods to keep workforce updated on market and industry trends. It includes steps such as assess present skills, assess 5 year skills, ensure employee buy in, set upskilling goals, design in house program etc. Persuade your audience using this Seven Step Guide Employee Skill Improvement Plan Pictures PDF. This PPT design covers seven stages, thus making it a great tool to use. It also caters to a variety of topics including Design In House Program, Monitor Progress, Upskilling Goals. Download this PPT design now to present a convincing pitch that not only emphasizes the topic but also showcases your presentation skills.
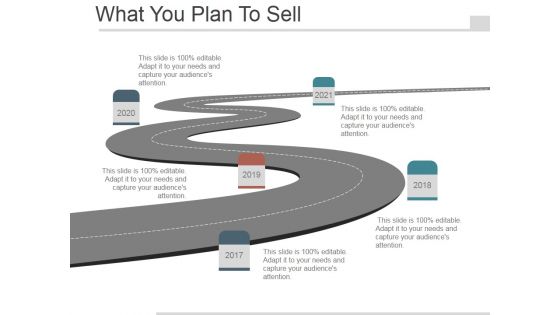
What You Plan To Sell Ppt PowerPoint Presentation Example
This is a what you plan to sell ppt powerpoint presentation example. This is a five stage process. The stages in this process are business, marketing, management, roadmap, year.
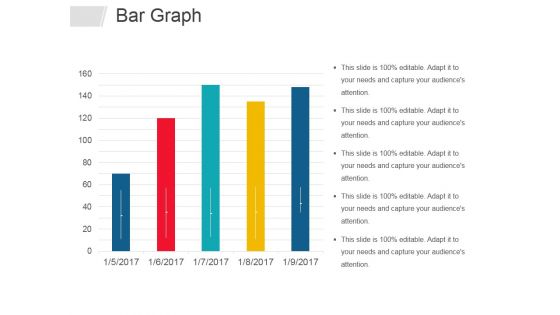
Bar Graph Ppt PowerPoint Presentation Infographics Graphics Design
This is a bar graph ppt powerpoint presentation infographics graphics design. This is a five stage process. The stages in this process are bar graph, business, years, marketing, management.
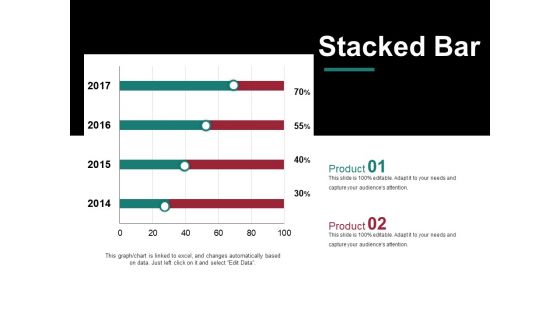
Stacked Bar Template 2 Ppt PowerPoint Presentation Model Graphic Images
This is a stacked bar template 2 ppt powerpoint presentation model graphic images. This is a two stage process. The stages in this process are business, years, marketing, percentage, finance.
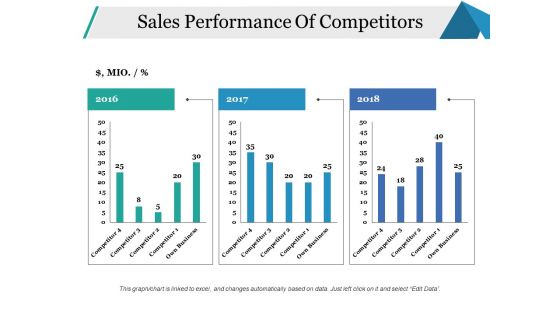
Sales Performance Of Competitors Ppt PowerPoint Presentation Portfolio Sample
This is a sales performance of competitors ppt powerpoint presentation portfolio sample. This is a three stage process. The stages in this process are business, marketing, finance, graph, years.
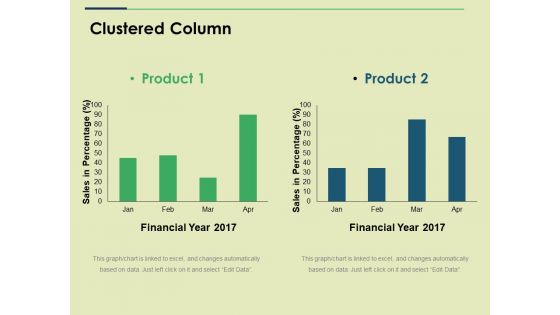
Clustered Column Ppt PowerPoint Presentation Show Graphics
This is a clustered column ppt powerpoint presentation show graphics. This is a two stage process. The stages in this process are financial year, sales in percentage, business, marketing, graph.
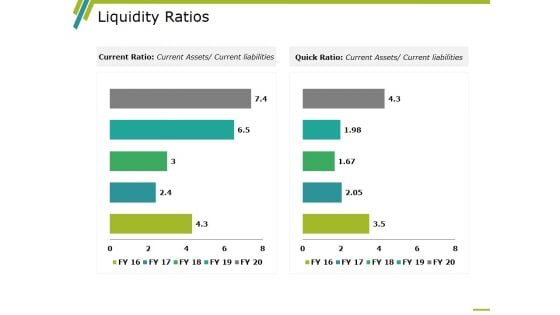
Liquidity Ratios Template 2 Ppt PowerPoint Presentation Ideas Microsoft
This is a liquidity ratios template 2 ppt powerpoint presentation ideas microsoft. This is a two stage process. The stages in this process are business, marketing, graph, year, current ratio, quick ratio.
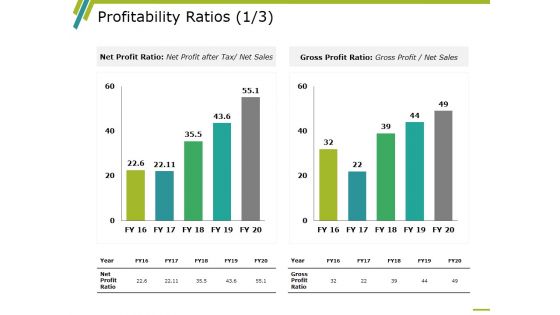
Profitability Ratios Template 2 Ppt PowerPoint Presentation Show Portfolio
This is a profitability ratios template 2 ppt powerpoint presentation show portfolio. This is a two stage process. The stages in this process are business, marketing, graph, net profit ratio, gross profit ratio, year.
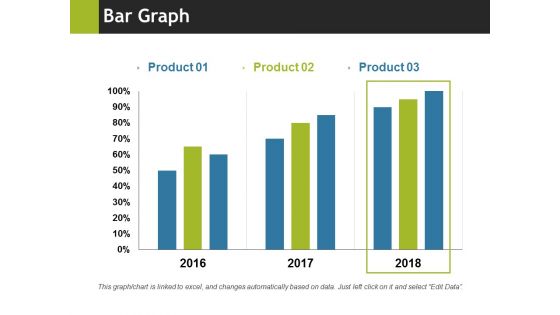
Bar Graph Ppt PowerPoint Presentation Summary Format
This is a bar graph ppt powerpoint presentation summary format. This is a three stage process. The stages in this process are bar graph, business, marketing, years, percentage, finance.
Bar Graph Ppt PowerPoint Presentation Infographics Icon
This is a bar graph ppt powerpoint presentation infographics icon. This is a two stage process. The stages in this process are business, marketing, financial year, in percentage, graph.
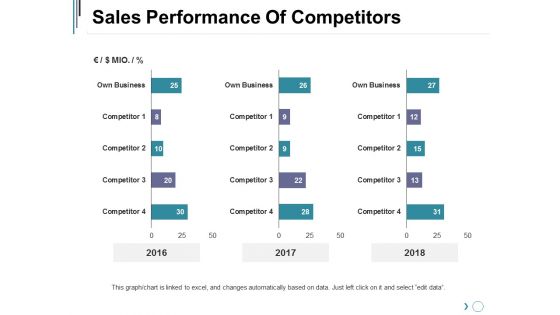
Sales Performance Of Competitors Ppt PowerPoint Presentation Inspiration Slideshow
This is a sales performance of competitors ppt powerpoint presentation inspiration slideshow. This is a three stage process. The stages in this process are business, marketing, graph, finance, years.
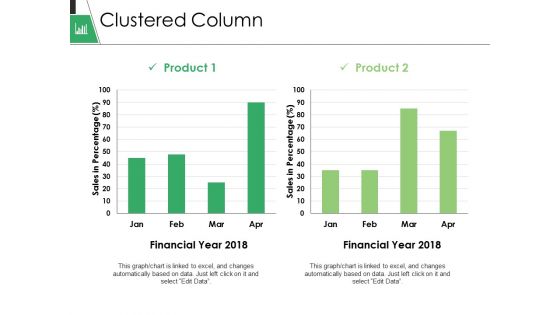
Clustered Column Ppt PowerPoint Presentation Gallery Format
This is a clustered column ppt powerpoint presentation gallery format. This is a two stage process. The stages in this process are business, marketing, graph, financial year, sales in percentage.
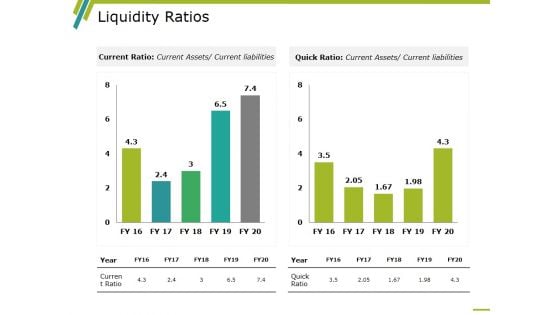
Liquidity Ratios Template 1 Ppt PowerPoint Presentation Styles Outline
This is a liquidity ratios template 1 ppt powerpoint presentation styles outline. This is a two stage process. The stages in this process are business, marketing, graph, year, current ratio, quick ratio.
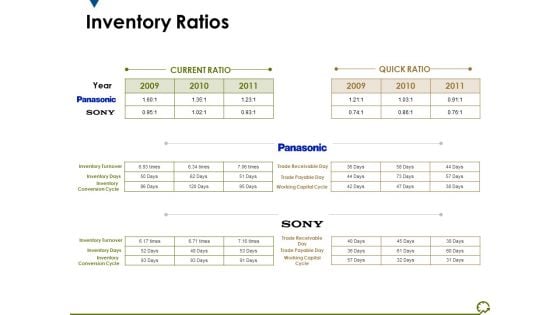
Inventory Ratios Ppt PowerPoint Presentation Layouts Brochure
This is a inventory ratios ppt powerpoint presentation layouts brochure. This is a three stage process. The stages in this process are quick ratio, current ratio, year, business, marketing, planning.
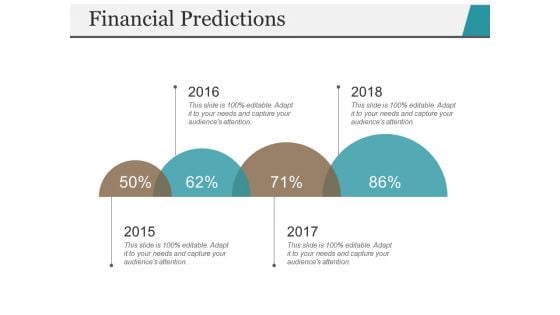
Financial Predictions Template 1 Ppt PowerPoint Presentation Slides File Formats
This is a financial predictions template 1 ppt powerpoint presentation slides file formats. This is a four stage process. The stages in this process are percentage, years, finance, business, marketing.

Combo Chart Ppt PowerPoint Presentation Summary Design Templates
This is a combo chart ppt powerpoint presentation summary design templates. This is a four stage process. The stages in this process are units sold, product, combo chart, years, planning.
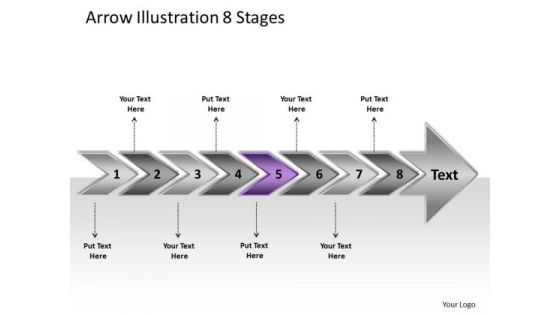
Arrow Illustration 8 Stages Process Flow Charts Examples PowerPoint Slides
We present our arrow illustration 8 stages process flow charts examples PowerPoint Slides. Use our Arrows PowerPoint Templates because, the plans are in your head, stage by stage, year by year. Use our Business PowerPoint Templates because, Marketing Strategy Business Template: - Maximizing sales of your product is the intended destination. Use our Shapes PowerPoint Templates because; explain the contribution of each of the elements and how they provide impetus to the next phase. Use our Finance PowerPoint Templates because, Bullet-point your thoughts and ideas to profitably accomplish every step of every stage along the way. Use our Process and Flows PowerPoint Templates because, Put them down and present them using our innovative templates. Use these PowerPoint slides for presentations relating to 3d arrow background bullet business chart checkmark chevron diagram drop eps10 financial five glass graphic gray icon illustration management point process project reflection set shadow stage text transparency vector white. The prominent colors used in the PowerPoint template are Purple, Gray, and Black Our Arrow Illustration 8 Stages Process Flow Charts Examples PowerPoint Slides are a complete customer delight. They deliver on every account.
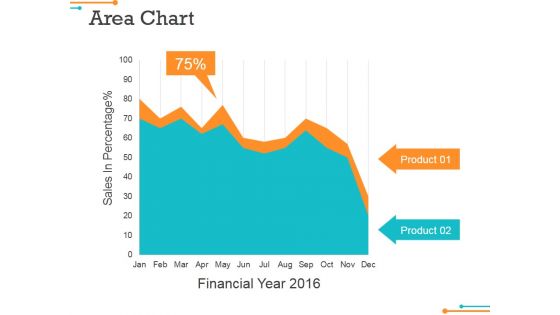
Area Chart Ppt Powerpoint Presentation File Show
This is a area chart ppt powerpoint presentation file show. This is a two stage process. The stages in this process are sales in percentage, financial year, product, financial, business.
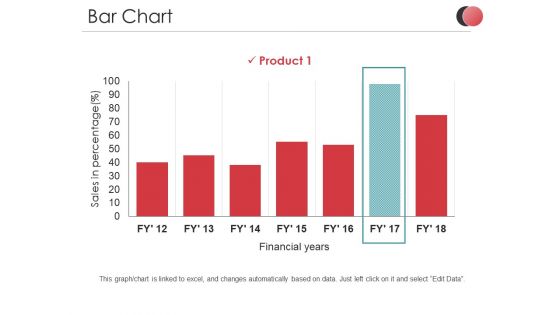
Bar Chart Ppt PowerPoint Presentation Outline Introduction
This is a bar chart ppt powerpoint presentation outline introduction. This is a one stage process. The stages in this process are sales in percentage, product, business, financial years, graph.
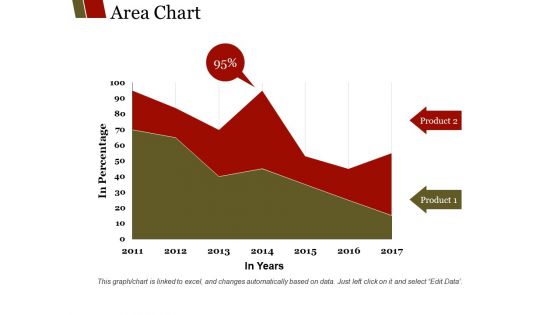
Area Chart Ppt PowerPoint Presentation Show Templates
This is a area chart ppt powerpoint presentation show templates. This is a two stage process. The stages in this process are product, in percentage, in years, finance, graph.
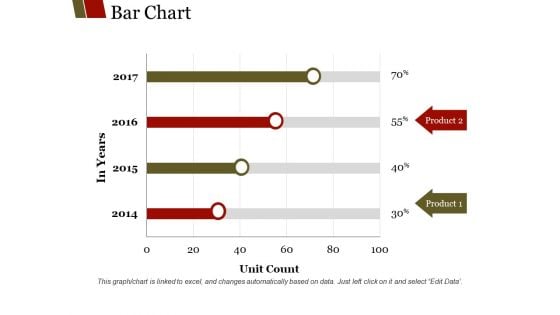
Bar Chart Ppt PowerPoint Presentation Outline Guidelines
This is a bar chart ppt powerpoint presentation outline guidelines. This is a four stage process. The stages in this process are product, unit count, in years, graph, finance, business.
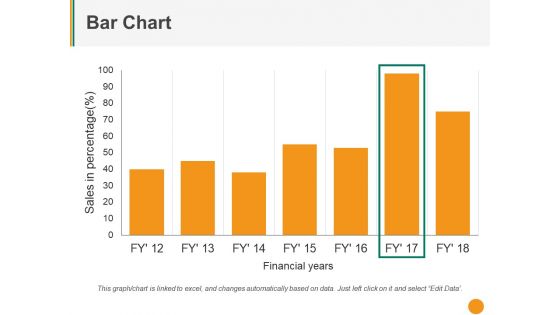
Bar Chart Ppt PowerPoint Presentation Styles Outfit
This is a bar chart ppt powerpoint presentation styles outfit. This is a Seven stage process. The stages in this process are sales in percentage, financial years, graph, business.
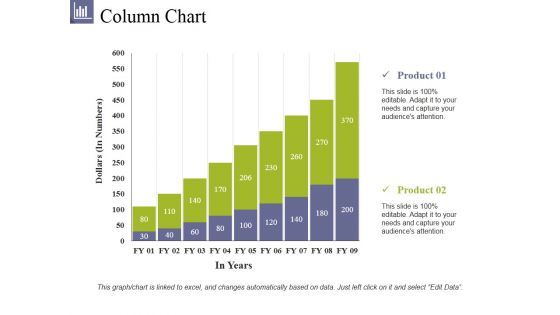
Column Chart Ppt PowerPoint Presentation File Summary
This is a column chart ppt powerpoint presentation file summary. This is a two stage process. The stages in this process are product, dollars, in years, bar graph, growth.
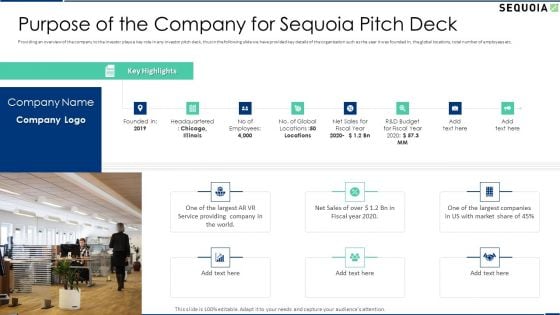
Purpose Of The Company For Sequoia Pitch Deck Template PDF
Providing an overview of the company to the investor plays a key role in any investor pitch deck, thus in the following slide we have provided key details of the organization such as the year it was founded in, the global locations, total number of employees etc. Deliver an awe inspiring pitch with this creative purpose of the company for sequoia pitch deck template pdf bundle. Topics like service, sales, market share can be discussed with this completely editable template. It is available for immediate download depending on the needs and requirements of the user.
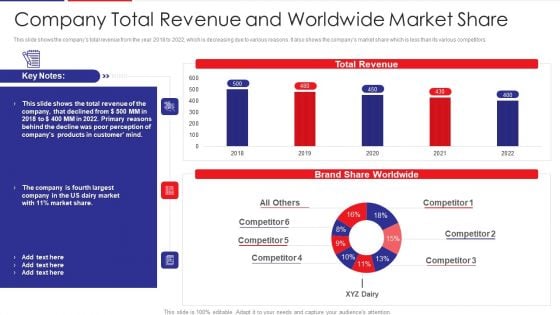
Examination Of Buyer Mindset Towards Dairy Products Company Total Revenue And Worldwide Sample PDF
This slide shows the companys total revenue from the year 2018 to 2022, which is decreasing due to various reasons. It also shows the companys market share which is less than its various competitors. Deliver an awe inspiring pitch with this creative examination of buyer mindset towards dairy products company total revenue and worldwide sample pdf bundle. Topics like brand share worldwide, total revenue can be discussed with this completely editable template. It is available for immediate download depending on the needs and requirements of the user.
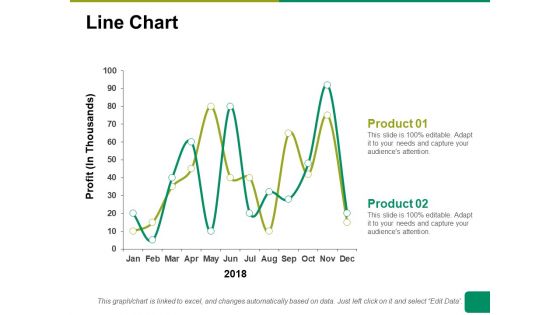
Line Chart Ppt PowerPoint Presentation Summary Ideas
This is a line chart ppt powerpoint presentation summary ideas. This is a two stage process. The stages in this process are line chart, profit, product, financial years, business.
Column Chart Ppt PowerPoint Presentation Icon Show
This is a column chart ppt powerpoint presentation icon show. This is a two stage process. The stages in this process are column chart, product, years, bar graph, growth.
Area Chart Ppt PowerPoint Presentation Gallery Icons
This is a area chart ppt powerpoint presentation gallery icons. This is a two stage process. The stages in this process are financial year, sales in percentage, product, finance, graph.
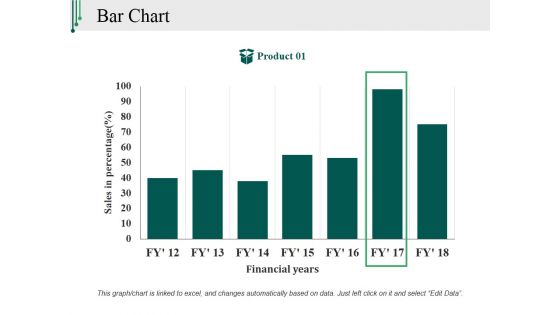
Bar Chart Ppt PowerPoint Presentation Outline Backgrounds
This is a bar chart ppt powerpoint presentation outline backgrounds. This is a one stage process. The stages in this process are sales in percentage, financial years, product, bar graph, finance.
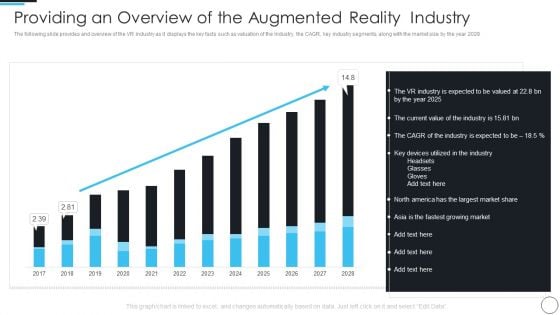
Artificial Intelligence Gaming Industry Fund Raising Elevator Providing An Overview Graphics PDF
The following slide provides and overview of the VR industry as it displays the key facts such as valuation of the Industry, the CAGR, key industry segments, along with the market size by the year 2028 Deliver and pitch your topic in the best possible manner with this artificial intelligence gaming industry fund raising elevator providing an overview graphics pdf. Use them to share invaluable insights on providing an overview of the augmented reality industry and impress your audience. This template can be altered and modified as per your expectations. So, grab it now.
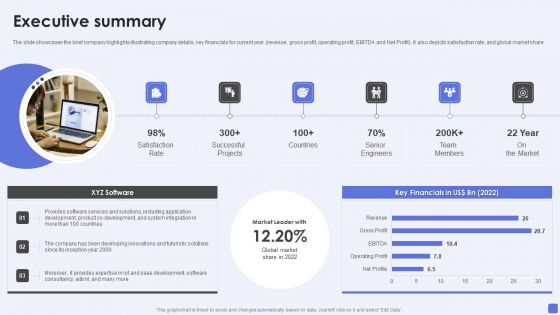
Software Services Business Profile Executive Summary Ppt PowerPoint Presentation File Elements PDF
The slide showcases the brief company highlights illustrating company details, key financials for current year revenue, gross profit, operating profit, EBITDA and Net Profit. It also depicts satisfaction rate, and global market share. Deliver an awe inspiring pitch with this creative Software Services Business Profile Executive Summary Ppt PowerPoint Presentation File Elements PDF bundle. Topics like Satisfaction Rate, Successful Projects, Senior Engineers can be discussed with this completely editable template. It is available for immediate download depending on the needs and requirements of the user.

Annual Strategic Annual Business Growth Plan Themes PDF
This slide showcase growth plan of organization in coming year with a focus of increasing sales revenue. It also includes purpose, key objectives, initiatives and key performance indicators KPI. Presenting Annual Strategic Annual Business Growth Plan Themes PDF to dispense important information. This template comprises three stages. It also presents valuable insights into the topics including Market Development, Process Improvement, People Development. This is a completely customizable PowerPoint theme that can be put to use immediately. So, download it and address the topic impactfully.
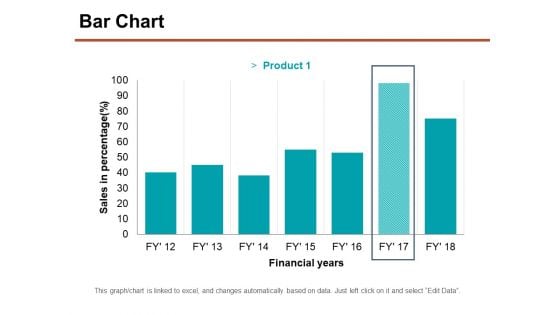
Bar Chart Ppt PowerPoint Presentation Professional Graphics Download
This is a bar chart ppt powerpoint presentation professional graphics download. This is a seven stage process. The stages in this process are sales in percentage, financial years, chart, business.
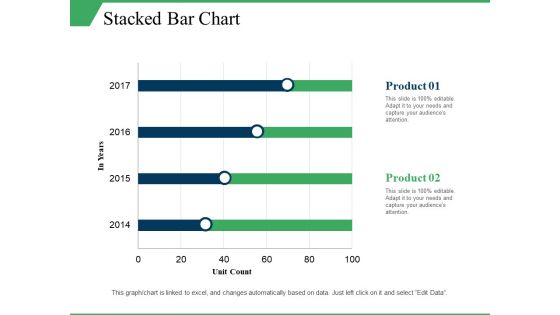
Stacked Bar Chart Ppt PowerPoint Presentation Infographics Elements
This is a stacked bar chart ppt powerpoint presentation infographics elements. This is a two stage process. The stages in this process are stacked bar chart, product, unit count, in year.
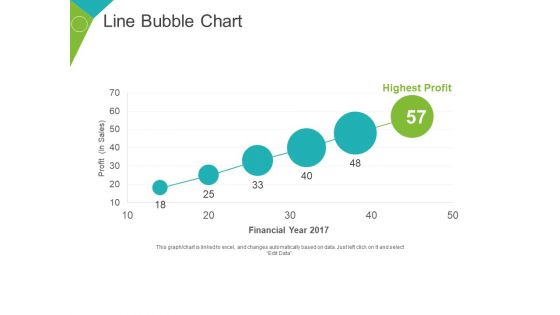
Line Bubble Chart Ppt PowerPoint Presentation Portfolio Slide Portrait
This is a line bubble chart ppt powerpoint presentation portfolio slide portrait. This is a six stage process. The stages in this process are highest profit, financial year, profit in sales, growth, business.
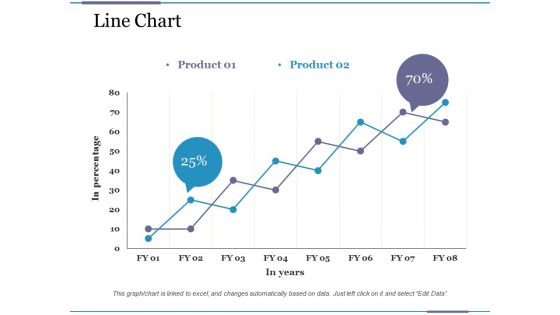
Line Chart Ppt PowerPoint Presentation Pictures File Formats
This is a line chart ppt powerpoint presentation pictures file formats. This is a two stage process. The stages in this process are business, financial, in percentage, in years, graph.
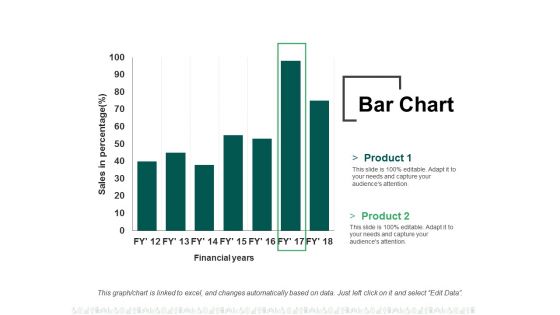
Bar Chart Ppt PowerPoint Presentation Summary File Formats
This is a bar chart ppt powerpoint presentation summary file formats. This is a two stage process. The stages in this process are business, finance, financial years, sales in percentage, graph.
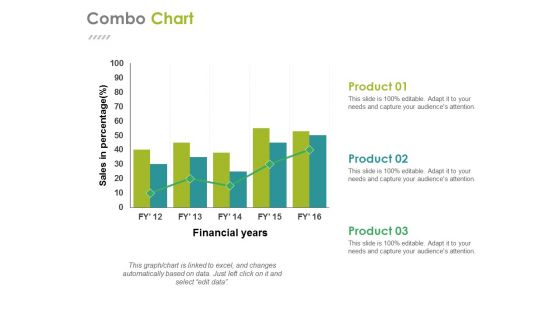
Combo Chart Ppt PowerPoint Presentation Gallery Design Ideas
This is a combo chart ppt powerpoint presentation gallery design ideas. This is a three stage process. The stages in this process are business, financial years, sales in percentage, finance, graph.
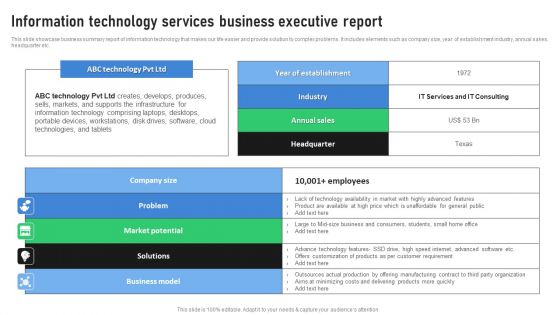
Information Technology Services Business Executive Report Rules PDF
This slide showcase business summary report of information technology that makes our life easier and provide solution to complex problems. It includes elements such as company size, year of establishment industry, annual sakes, headquarter etc. Showcasing this set of slides titled Information Technology Services Business Executive Report Rules PDF. The topics addressed in these templates are Market Potential, Business Model, Company Size. All the content presented in this PPT design is completely editable. Download it and make adjustments in color, background, font etc. as per your unique business setting.
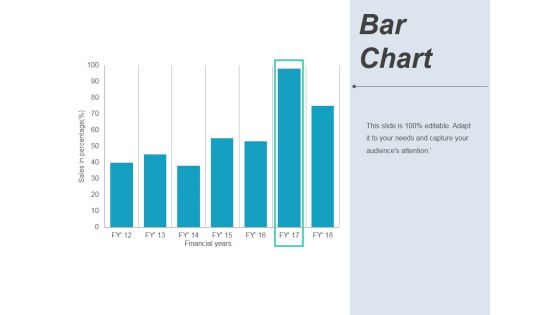
Bar Chart Ppt PowerPoint Presentation Pictures Background Image
This is a bar chart ppt powerpoint presentation pictures background image. This is a seven stage process. The stages in this process are financial years, sales in percentage, graph, business.
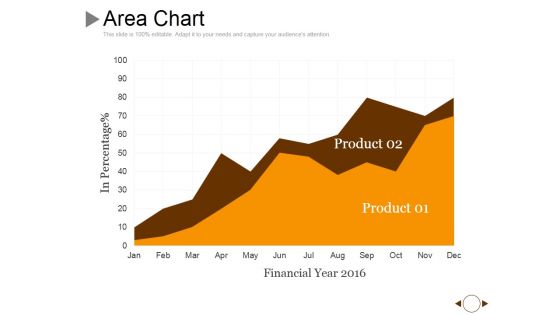
Area Chart Ppt PowerPoint Presentation Show Layout Ideas
This is a area chart ppt powerpoint presentation show layout ideas. This is a two stage process. The stages in this process are product, in percentage, financial year, growth.
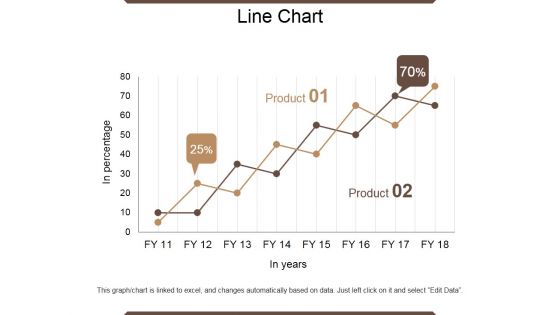
Line Chart Ppt PowerPoint Presentation Outline Infographic Template
This is a line chart ppt powerpoint presentation outline infographic template. This is a two stage process. The stages in this process are in percentage, product, in year, growth, success.
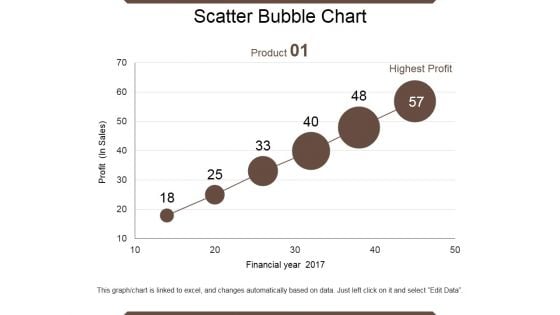
Scatter Bubble Chart Ppt PowerPoint Presentation Summary Files
This is a scatter bubble chart ppt powerpoint presentation summary files. This is a six stage process. The stages in this process are product, financial year, profit, highest profit.
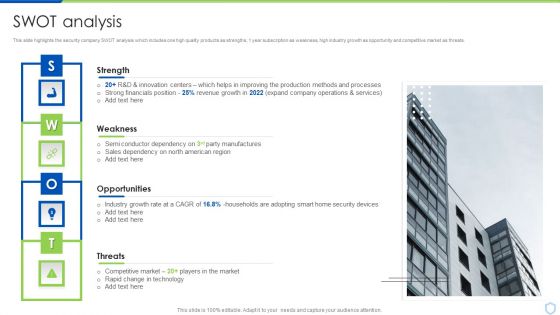
Security And Surveillance Company Profile SWOT Analysis Infographics PDF
This slide highlights the security company SWOT analysis which includes one high quality products as strengths, 1 year subscription as weakness, high industry growth as opportunity and competitive market as threats. This is a Security And Surveillance Company Profile SWOT Analysis Infographics PDF template with various stages. Focus and dispense information on four stages using this creative set, that comes with editable features. It contains large content boxes to add your information on topics like Financials Position, Innovation Centers, Operations Services. You can also showcase facts, figures, and other relevant content using this PPT layout. Grab it now.
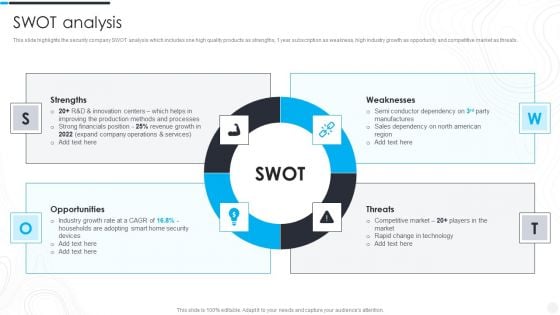
Security Camera System Company Profile SWOT Analysis Infographics PDF
This slide highlights the security company SWOT analysis which includes one high quality products as strengths, 1 year subscription as weakness, high industry growth as opportunity and competitive market as threats. This is a Security Camera System Company Profile SWOT Analysis Infographics PDF template with various stages. Focus and dispense information on four stages using this creative set, that comes with editable features. It contains large content boxes to add your information on topics like Strengths, Weaknesses, Opportunities. You can also showcase facts, figures, and other relevant content using this PPT layout. Grab it now.
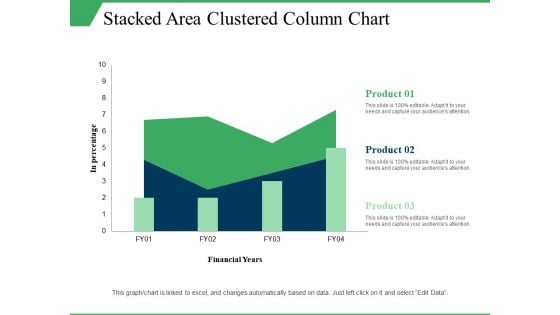
Stacked Area Clustered Column Chart Ppt PowerPoint Presentation Visual Aids Model
This is a stacked area clustered column chart ppt powerpoint presentation visual aids model. This is a three stage process. The stages in this process are in percentage, product, financial years, growth, column chart.
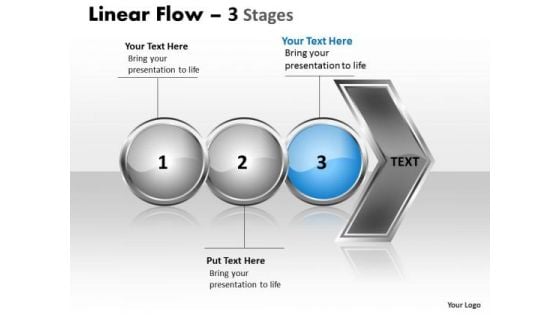
Usa Ppt Theme Horizontal Flow Of 3 Phase Diagram Communication Skills PowerPoint 4 Graphic
We present our USA PPT Theme Horizontal Flow of 3 phase diagram communication skills power point 4 Graphic. Use our Arrows PowerPoint Templates because, Vision Ave Future St Template: - There was a vision of a desired destination and the best road to take to reach that goal. Use our Circle Charts PowerPoint Templates because; Use our templates to lustrate your ability. Use our Business PowerPoint Templates because, Marketing Strategy Business Template:- Maximizing sales of your product is the intended destination. Use our Shapes PowerPoint Templates because, the plans are in your head, stage by stage, year by year. Use our Process and Flows PowerPoint Templates because; educate your team with your thoughts and logic. Use these PowerPoint slides for presentations relating to background, blog, business, chain, communication, community, concept, contact, design, interaction, internet, line, linear, location, logistic, map, modern, movement, network, pointer, reaction, social, stream, structure, system, team,. The prominent colors used in the PowerPoint template are Blue, Gray, and Black Awards will be the feathers in your cap. Accumulate accolades with our Usa Ppt Theme Horizontal Flow Of 3 Phase Diagram Communication Skills PowerPoint 4 Graphic.


 Continue with Email

 Home
Home


