Yearly Progress
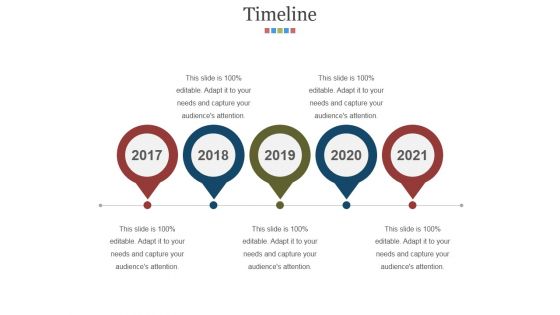
Timeline Ppt PowerPoint Presentation Model Tips
This is a timeline ppt powerpoint presentation model tips. This is a five stage process. The stages in this process are years, timeline, process, success, strategy.
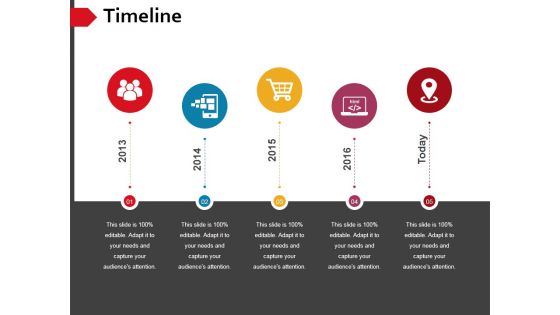
Timeline Ppt PowerPoint Presentation Professional Files
This is a timeline ppt powerpoint presentation professional files. This is a five stage process. The stages in this process are years, timeline, process, success, icons.

Analyzing Talent Sourcing And Planned Workforce Enhancement Ideas Pdf
This slide showcases multiple sources of candidate hiring and costs associated with them that can help us prepare recruitment budget for upcoming years. It includes years, selection methods, cost of recruitment, outcome, etc.Create an editable Analyzing Talent Sourcing And Planned Workforce Enhancement Ideas Pdf that communicates your idea and engages your audience. Whether you are presenting a business or an educational presentation, pre-designed presentation templates help save time. Analyzing Talent Sourcing And Planned Workforce Enhancement Ideas Pdf is highly customizable and very easy to edit, covering many different styles from creative to business presentations. Slidegeeks has creative team members who have crafted amazing templates. So, go and get them without any delay. This slide showcases multiple sources of candidate hiring and costs associated with them that can help us prepare recruitment budget for upcoming years. It includes years, selection methods, cost of recruitment, outcome, etc.

Major Milestones Achieved Writing Enhancement Software Pitch Deck PPT Template
This slide presents the key milestones achieved by the company over the years. It presents key milestones such as founding year, extensions, platform scaling, and grammarlyGo. Do you have to make sure that everyone on your team knows about any specific topic I yes, then you should give Major Milestones Achieved Writing Enhancement Software Pitch Deck PPT Template a try. Our experts have put a lot of knowledge and effort into creating this impeccable Major Milestones Achieved Writing Enhancement Software Pitch Deck PPT Template. You can use this template for your upcoming presentations, as the slides are perfect to represent even the tiniest detail. You can download these templates from the Slidegeeks website and these are easy to edit. So grab these today This slide presents the key milestones achieved by the company over the years.It presents key milestones such as founding year, extensions, platform scaling, and grammarlyGo.

Revenue Growth For Bar Graph Ppt Examples Slides
This is a revenue growth for bar graph ppt examples slides. This is a five stage process. The stages in this process are bar graph, years, business, growth, marketing.
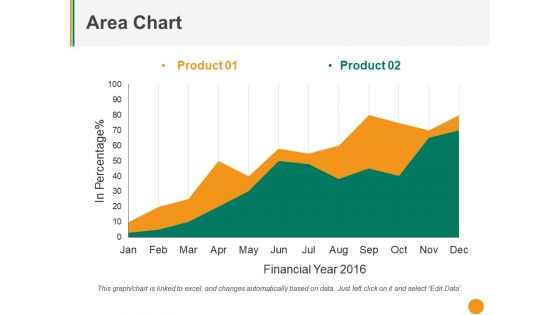
Area Chart Ppt PowerPoint Presentation File Graphic Tips
This is a area chart ppt powerpoint presentation file graphic tips. This is a two stage process. The stages in this process are product, in percentage, financial year, business, growth.
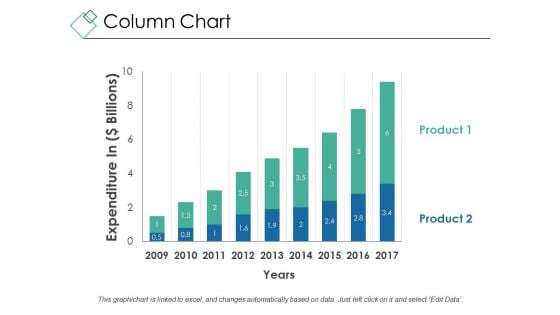
Column Chart Ppt PowerPoint Presentation Gallery Graphics Example
This is a column chart ppt powerpoint presentation gallery graphics example. This is a two stage process. The stages in this process are expenditure in, years, business, marketing, growth.
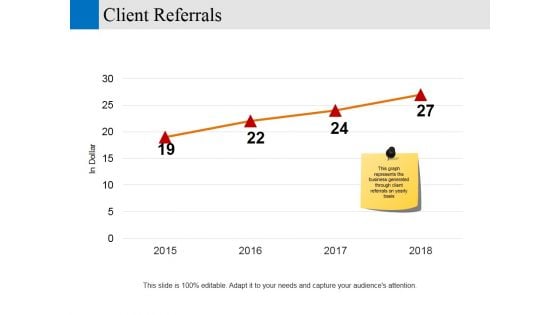
client referrals ppt powerpoint presentation visual aids show
This is a client referrals ppt powerpoint presentation visual aids show. This is a four stage process. The stages in this process are in dollar, years, business, marketing, growth.
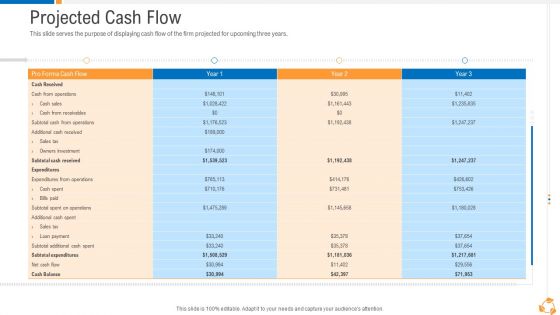
Business Advancement Internal Growth Projected Cash Flow Diagrams PDF
This slide serves the purpose of displaying cash flow of the firm projected for upcoming three years. Deliver an awe-inspiring pitch with this creative business advancement internal growth projected cash flow diagrams pdf bundle. Topics like projected cash flow can be discussed with this completely editable template. It is available for immediate download depending on the needs and requirements of the user.
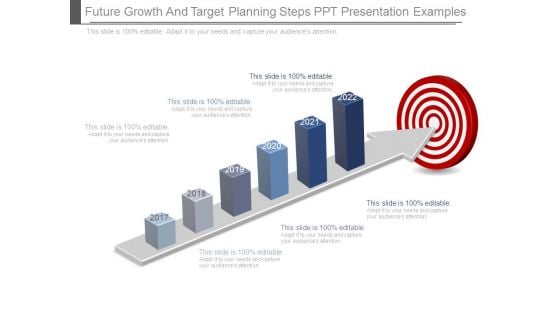
Future Growth And Target Planning Steps Ppt Presentation Examples
This is a future growth and target planning steps ppt presentation examples. This is a six stage process. The stages in this process are future, growth, target, arrow, year, business.
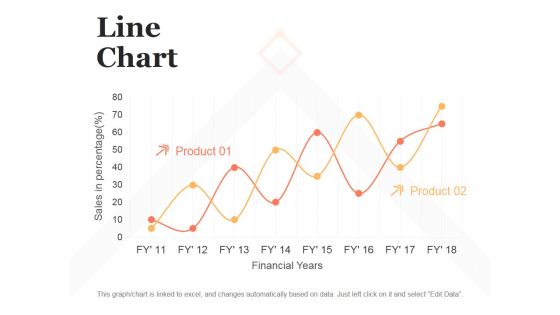
Line Chart Ppt PowerPoint Presentation Model Design Templates
This is a line chart ppt powerpoint presentation model design templates. This is a two stage process. The stages in this process are sales in percentage, financial years, product.
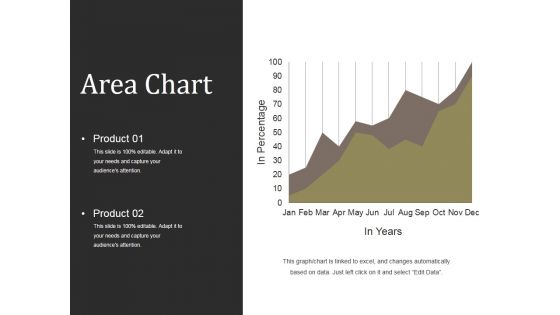
Area Chart Ppt PowerPoint Presentation Professional Designs
This is a area chart ppt powerpoint presentation professional designs. This is a two stage process. The stages in this process are in percentage, product, in years, strategy, business, marketing.

Scatter Bubble Chart Ppt PowerPoint Presentation Professional Graphics Pictures
This is a scatter bubble chart ppt powerpoint presentation professional graphics pictures. This is a one stage process. The stages in this process are profit in sales, financial year, highest profit, product.
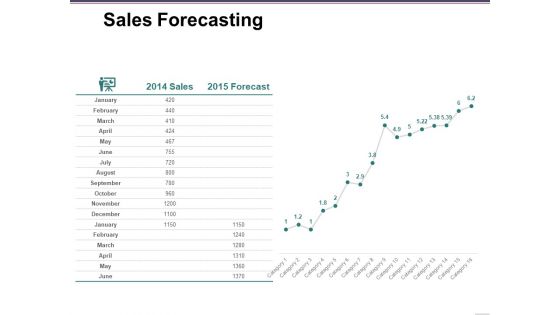
Sales Forecasting Template 1 Ppt PowerPoint Presentation Slides Download
This is a sales forecasting template 1 ppt powerpoint presentation slides download. This is a one stage process. The stages in this process are forecast, sales, years, business, icons.
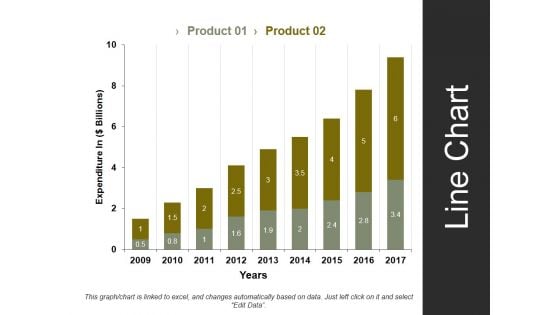
Line Chart Template 1 Ppt PowerPoint Presentation Styles Summary
This is a line chart template 1 ppt powerpoint presentation styles summary. This is a two stage process. The stages in this process are expenditure in, years, business, marketing, strategy.
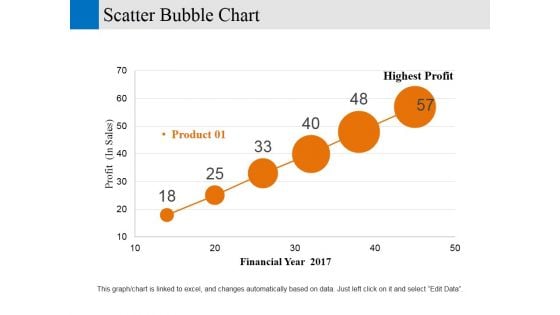
Scatter Bubble Chart Ppt PowerPoint Presentation Gallery Designs Download
This is a scatter bubble chart ppt powerpoint presentation gallery designs download. This is a six stage process. The stages in this process are financial year, profit, business, marketing, strategy.
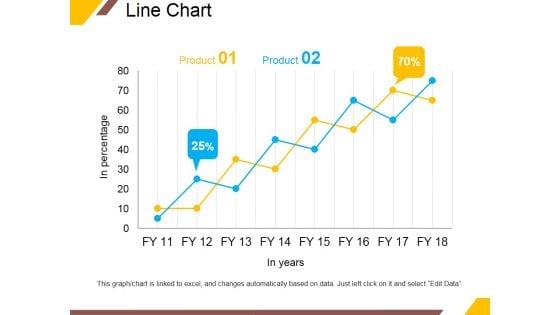
Line Chart Ppt PowerPoint Presentation Portfolio Infographic Template
This is a line chart ppt powerpoint presentation portfolio infographic template. This is a two stage process. The stages in this process are product, in years, business, percentage, growth.
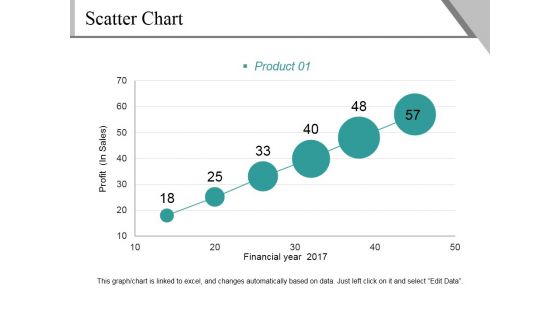
Scatter Chart Ppt PowerPoint Presentation File Background Image
This is a scatter chart ppt powerpoint presentation file background image. This is a six stage process. The stages in this process are profit, financial year, product, growth, success.
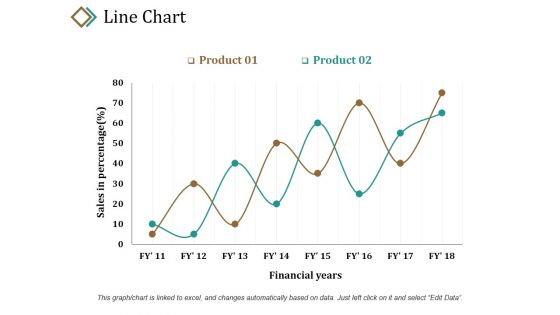
Line Chart Ppt PowerPoint Presentation Layouts Example
This is a line chart ppt powerpoint presentation layouts example. This is a two stage process. The stages in this process are sales in percentage, product, financial years, growth, success.
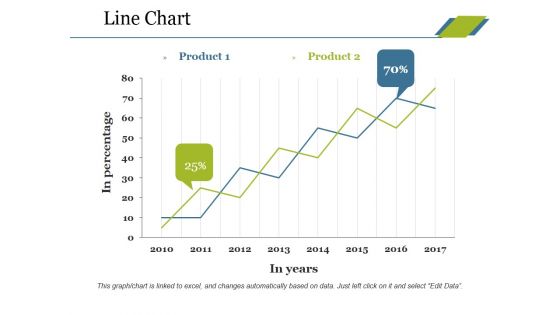
Line Chart Ppt PowerPoint Presentation Professional Tips
This is a line chart ppt powerpoint presentation professional tips. This is a two stage process. The stages in this process are product, in percentage, in years, growth, success.
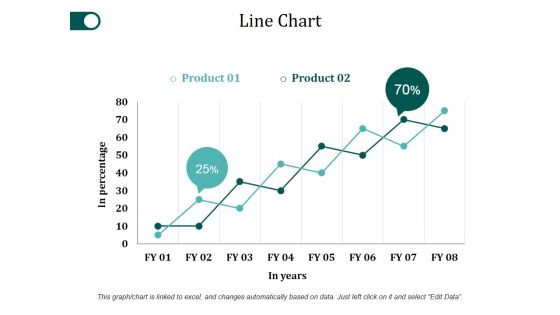
Line Chart Ppt PowerPoint Presentation Slides Ideas
This is a line chart ppt powerpoint presentation slides ideas. This is a two stage process. The stages in this process are product, in percentage, in years, growth, success.
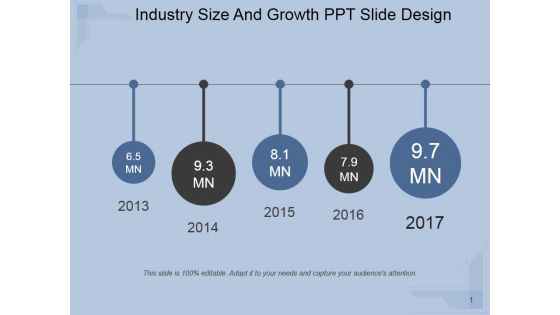
Industry Size And Growth Ppt PowerPoint Presentation Images
This is a industry size and growth ppt powerpoint presentation images. This is a five stage process. The stages in this process are year, growth, time planning, success, business.
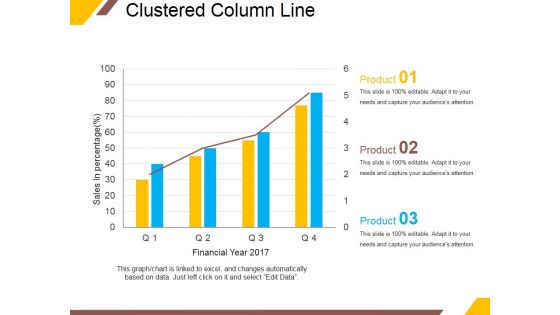
Clustered Column Line Ppt PowerPoint Presentation Portfolio Outline
This is a clustered column line ppt powerpoint presentation portfolio outline. This is a four stage process. The stages in this process are sales in percentage, financial year, product, graph, growth.
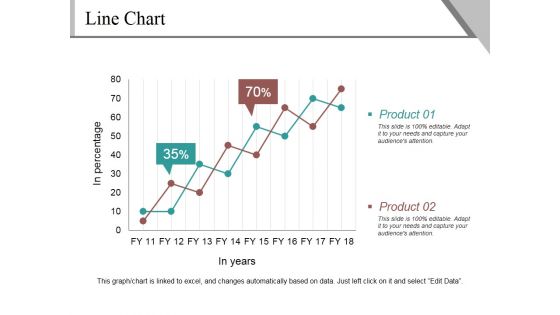
Line Chart Ppt PowerPoint Presentation Infographics Example
This is a line chart ppt powerpoint presentation infographics example. This is a two stage process. The stages in this process are product, in percentage, in years, finance, growth.
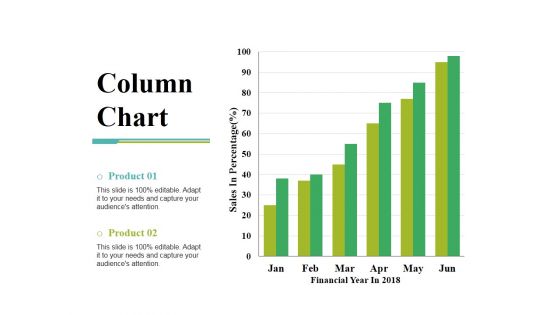
Column Chart Ppt PowerPoint Presentation Gallery Slide Portrait
This is a column chart ppt powerpoint presentation gallery slide portrait. This is a two stage process. The stages in this process are sales in percentage, financial year, product, bar graph, growth.
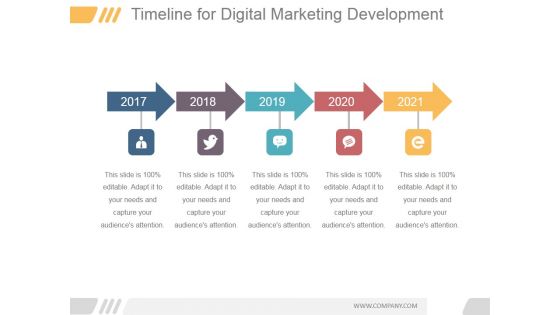
Timeline For Digital Marketing Development Ppt PowerPoint Presentation Visuals
This is a timeline for digital marketing development ppt powerpoint presentation visuals. This is a five stage process. The stages in this process are year, success, arrows, time planning, growth.
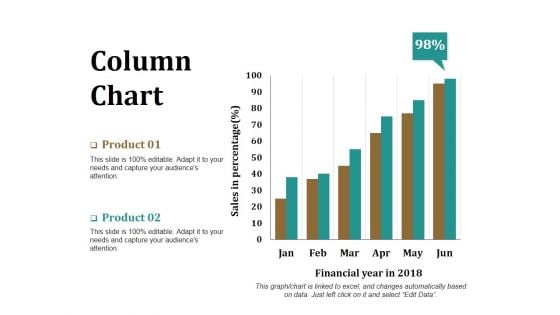
Column Chart Ppt PowerPoint Presentation Model Graphics Download
This is a column chart ppt powerpoint presentation model graphics download. This is a two stage process. The stages in this process are product, financial year, sales in percentage, bar graph, success.
Scatter Bubble Chart Ppt PowerPoint Presentation Icon Elements
This is a scatter bubble chart ppt powerpoint presentation icon elements. This is a six stage process. The stages in this process are highest profit, profit, financial year, product.
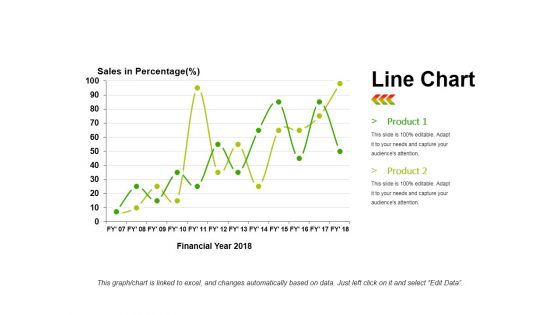
Line Chart Ppt PowerPoint Presentation Infographics Infographics
This is a line chart ppt powerpoint presentation infographics infographics. This is a two stage process. The stages in this process are product, sales in percentage, financial year, line chart, finance.
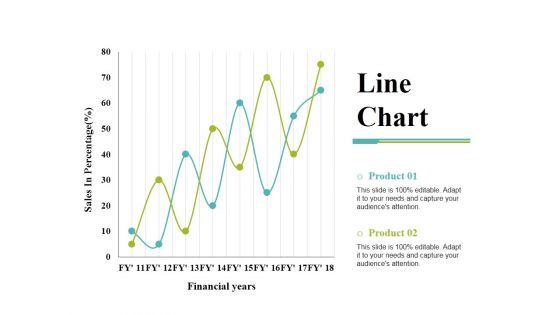
Line Chart Ppt PowerPoint Presentation Gallery Templates
This is a line chart ppt powerpoint presentation gallery templates. This is a two stage process. The stages in this process are product, financial years, sales in percentage, line chart.
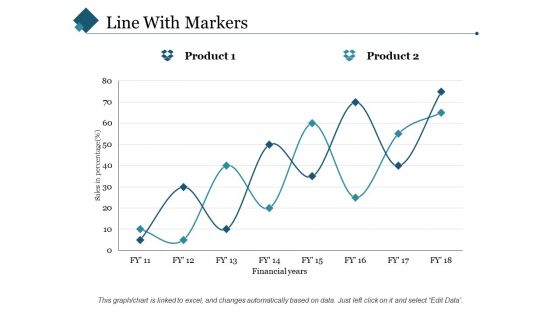
Line With Markers Ppt PowerPoint Presentation Styles Slide Portrait
This is a line with markers ppt powerpoint presentation styles slide portrait. This is a two stage process. The stages in this process are sales in percentage, financial years, product.
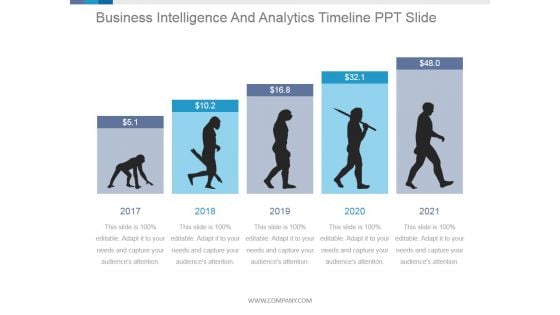
Business Intelligence And Analytics Timeline Ppt PowerPoint Presentation Shapes
This is a business intelligence and analytics timeline ppt powerpoint presentation shapes. This is a five stage process. The stages in this process are year, business, growth, success, timeline.

Line Chart Ppt PowerPoint Presentation Show Guide
This is a line chart ppt powerpoint presentation show guide. This is a two stage process. The stages in this process are product, sales in percentage, financial years, growth, success.
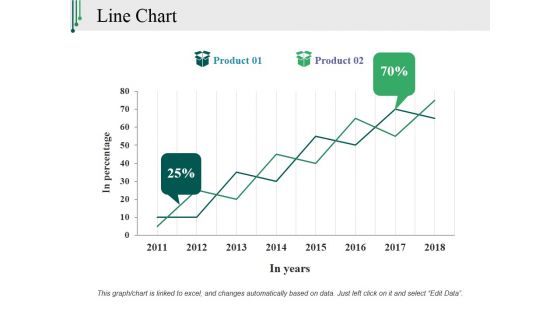
Line Chart Ppt PowerPoint Presentation Slides Mockup
This is a line chart ppt powerpoint presentation slides mockup. This is a two stage process. The stages in this process are in percentage, in years, product, growth, success.
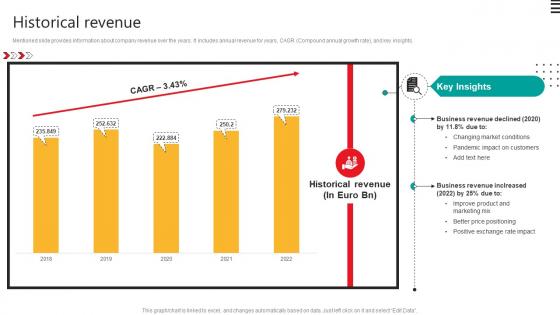
Historical Revenue Automobile Development Company Profile CP SS V
Mentioned slide provides information about company revenue over the years. It includes annual revenue for years, CAGR Compound annual growth rate, and key insights.Coming up with a presentation necessitates that the majority of the effort goes into the content and the message you intend to convey. The visuals of a PowerPoint presentation can only be effective if it supplements and supports the story that is being told. Keeping this in mind our experts created Historical Revenue Automobile Development Company Profile CP SS V to reduce the time that goes into designing the presentation. This way, you can concentrate on the message while our designers take care of providing you with the right template for the situation. Mentioned slide provides information about company revenue over the years. It includes annual revenue for years, CAGR Compound annual growth rate, and key insights.

Scatter Bubble Chart Ppt PowerPoint Presentation Professional Model
This is a scatter bubble chart ppt powerpoint presentation professional model. This is a six stage process. The stages in this process are sales in profit, financial year, growth, business, marketing, strategy.
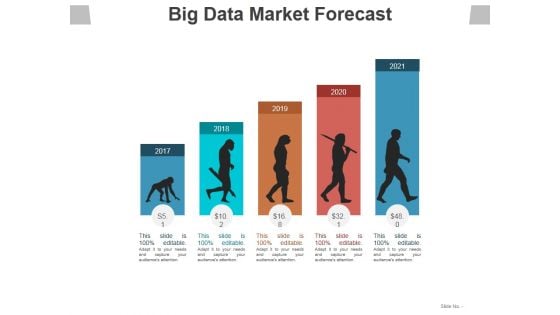
Big Data Market Forecast Ppt PowerPoint Presentation Ideas Information
This is a big data market forecast ppt powerpoint presentation ideas information. This is a five stage process. The stages in this process are years, planning, growth, business, marketing.
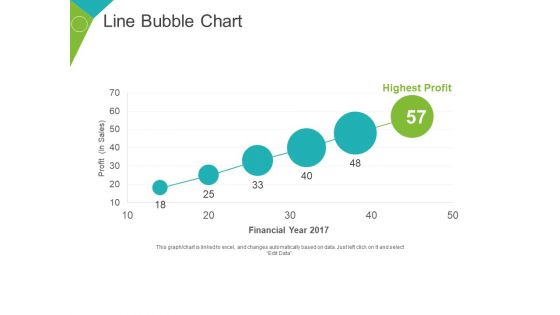
Line Bubble Chart Ppt PowerPoint Presentation Portfolio Slide Portrait
This is a line bubble chart ppt powerpoint presentation portfolio slide portrait. This is a six stage process. The stages in this process are highest profit, financial year, profit in sales, growth, business.
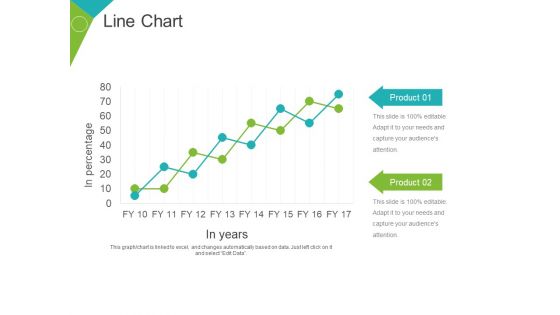
Line Chart Ppt PowerPoint Presentation Gallery Objects
This is a line chart ppt powerpoint presentation gallery objects. This is a two stage process. The stages in this process are product, business, marketing, growth, in years, in percentage.
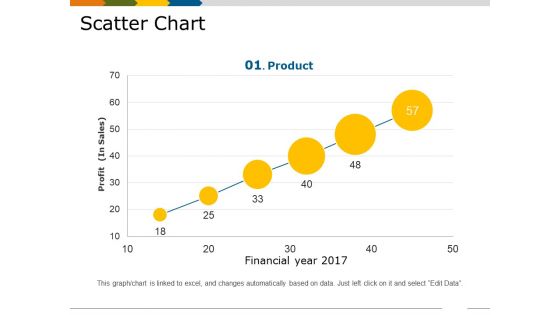
Scatter Chart Template 1 Ppt PowerPoint Presentation Show Slides
This is a scatter chart template 1 ppt powerpoint presentation show slides. This is a six stage process. The stages in this process are financial year, profit in sales, growth, business, marketing, product.
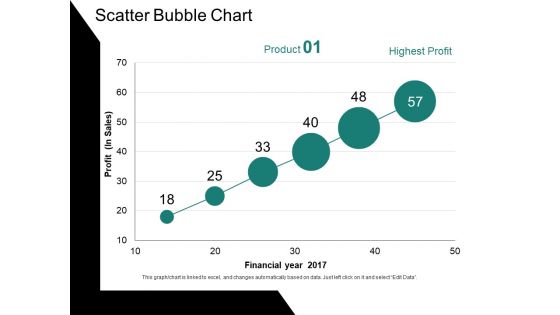
Scatter Bubble Chart Ppt PowerPoint Presentation Ideas Gallery
This is a scatter bubble chart ppt powerpoint presentation ideas gallery. This is a six stage process. The stages in this process are profit, financial year, chart, business, growth.
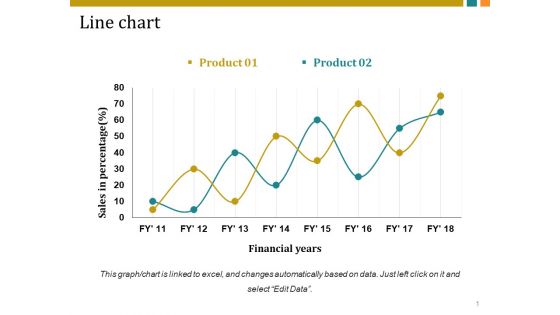
Line Chart Ppt PowerPoint Presentation Inspiration Vector
This is a line chart ppt powerpoint presentation inspiration vector. This is a two stage process. The stages in this process are sales in percentage, financial years, business, marketing, growth.

Line Chart Ppt PowerPoint Presentation Infographics Graphic Images
This is a line chart ppt powerpoint presentation infographics graphic images. This is a two stage process. The stages in this process are sales in percentage, financial years, growth, business, marketing.
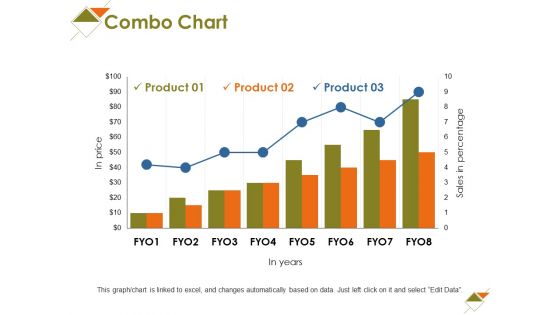
Combo Chart Ppt PowerPoint Presentation Show Elements
This is a combo chart ppt powerpoint presentation show elements. This is a three stage process. The stages in this process are in price, in years, business, marketing, growth.
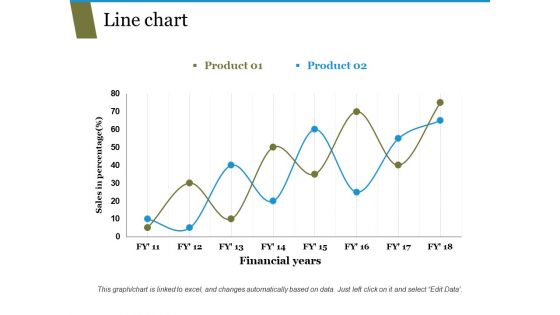
Line Chart Ppt PowerPoint Presentation Pictures Templates
This is a line chart ppt powerpoint presentation pictures templates. This is a two stage process. The stages in this process are sales in percentage, financial years, business, marketing, growth.
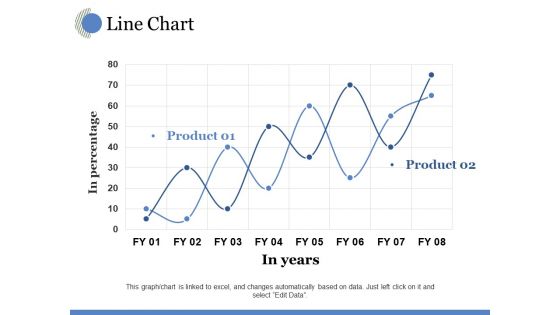
Line Chart Ppt PowerPoint Presentation Model Visual Aids
This is a line chart ppt powerpoint presentation model visual aids. This is a two stage process. The stages in this process are in years, in percentage, growth, business, marketing.
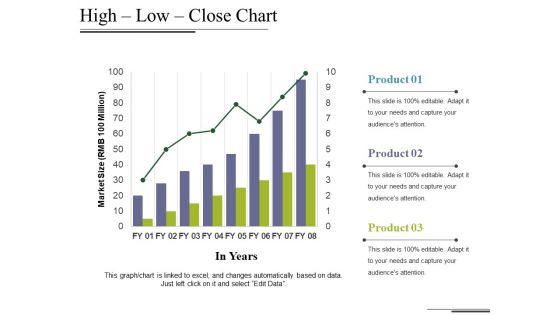
High Low Close Chart Ppt PowerPoint Presentation Styles Maker
This is a high low close chart ppt powerpoint presentation styles maker. This is a three stage process. The stages in this process are market size, in years, growth, business, marketing, graph.
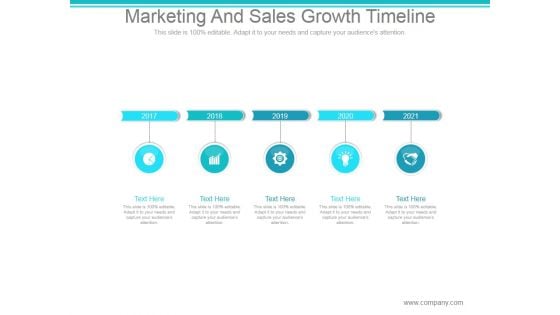
Marketing And Sales Growth Timeline Ppt PowerPoint Presentation Guidelines
This is a marketing and sales growth timeline ppt powerpoint presentation guidelines. This is a five stage process. The stages in this process are year, icons, strategy, business, growth.
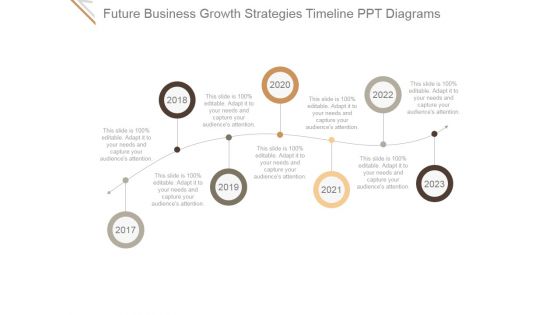
Future Business Growth Strategies Timeline Ppt PowerPoint Presentation Slides
This is a future business growth strategies timeline ppt powerpoint presentation slides. This is a seven stage process. The stages in this process are marketing, year, strategy, process, timeline.
Clustered Column Line Ppt PowerPoint Presentation Icon Good
This is a clustered column line ppt powerpoint presentation icon good. This is a three stage process. The stages in this process are product, financial year, bar graph, business, growth.
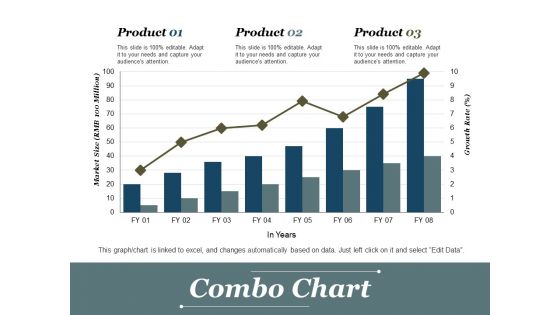
Combo Chart Ppt PowerPoint Presentation Slides Outline
This is a combo chart ppt powerpoint presentation slides outline. This is a three stage process. The stages in this process are combo chart, growth, product, financial year, business.
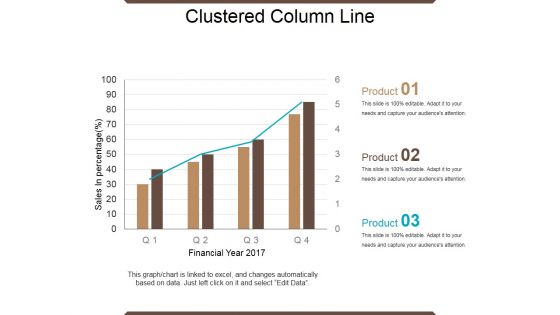
Clustered Column Line Ppt PowerPoint Presentation Show Influencers
This is a clustered column line ppt powerpoint presentation show influencers. This is a four stage process. The stages in this process are financial year, sales in percentage, product, growth, success.
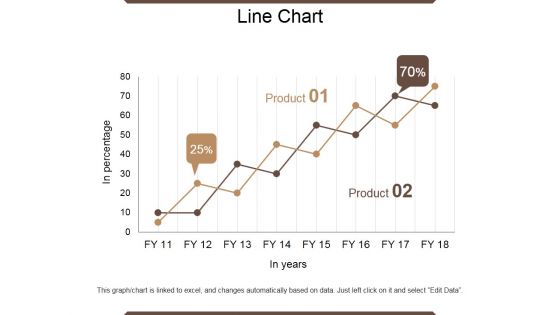
Line Chart Ppt PowerPoint Presentation Outline Infographic Template
This is a line chart ppt powerpoint presentation outline infographic template. This is a two stage process. The stages in this process are in percentage, product, in year, growth, success.
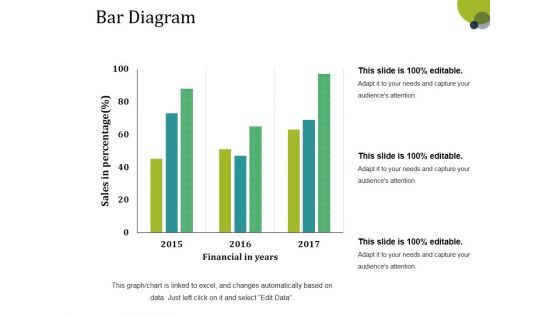
Bar Diagram Ppt PowerPoint Presentation Gallery Structure
This is a bar diagram ppt powerpoint presentation gallery structure. This is a three stage process. The stages in this process are financial in years, sales in percentage, bar graph, growth, success.
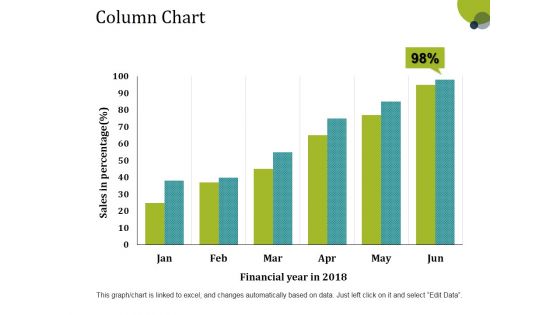
Column Chart Ppt PowerPoint Presentation Layouts Tips
This is a column chart ppt powerpoint presentation layouts tips. This is a six stage process. The stages in this process are sales in percentage, financial year, bar graph, growth, success.
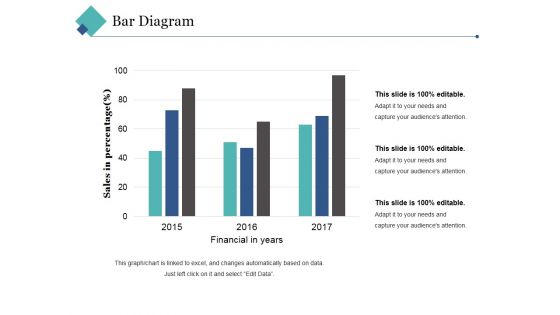
Bar Diagram Ppt PowerPoint Presentation Pictures Background Image
This is a bar diagram ppt powerpoint presentation pictures background image. This is a three stage process. The stages in this process are financial in years, sales in percentage, bar graph, growth, success.

Column Chart Ppt PowerPoint Presentation Styles Graphics Design
This is a column chart ppt powerpoint presentation styles graphics design. This is a two stage process. The stages in this process are expenditure in, product, years, growth, success.
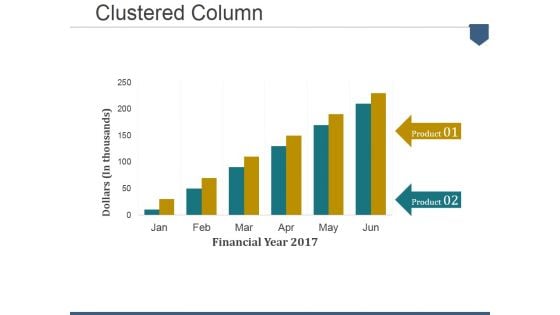
Clustered Column Ppt PowerPoint Presentation File Designs Download
This is a clustered column ppt powerpoint presentation file designs download. This is a six stage process. The stages in this process are dollars in thousands, financial year, product.
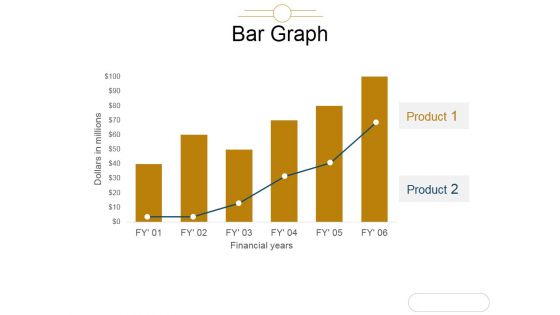
Bar Graph Ppt PowerPoint Presentation Model Graphic Tips
This is a bar graph ppt powerpoint presentation model graphic tips. This is a two stage process. The stages in this process are we are dollars in millions, financials years, bar graph, product, business.

Combo Chart Ppt PowerPoint Presentation Summary Design Templates
This is a combo chart ppt powerpoint presentation summary design templates. This is a four stage process. The stages in this process are units sold, product, combo chart, years, planning.


 Continue with Email

 Home
Home


