accomplishments
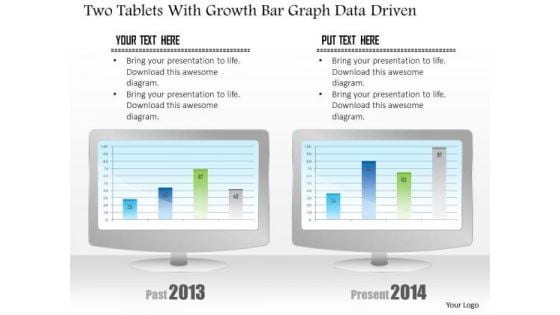
Business Diagram Two Tablets With Growth Bar Graph Data Driven PowerPoint Slide
This business diagram has been designed with comparative charts on tablets. This slide suitable for data representation. You can also use this slide to present business reports and information. Use this diagram to present your views in a wonderful manner.
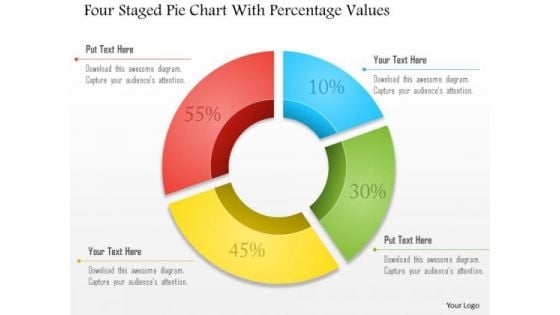
Business Diagram Four Staged Pie Chart With Percentage Values Presentation Template
Four staged pie chart and percentage values are used to design this business slide. Download this diagram to make business and financial reports. Use our above diagram to express information in a visual way.
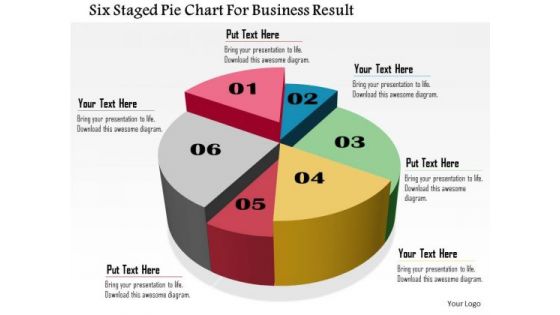
Business Daigram Six Staged Pie Chart For Business Result Presentation Templets
Six staged pie chart is used to design this business slide. Download this diagram to make business and financial reports. Use our above diagram to express information in a visual way.
Business Diagram Icons And Charts For Business Growth Presentation Template
Our above slide contains graphics of business charts and icons. It helps to display business reports and analysis. Use this diagram to impart more clarity to data and to create more sound impact on viewers.
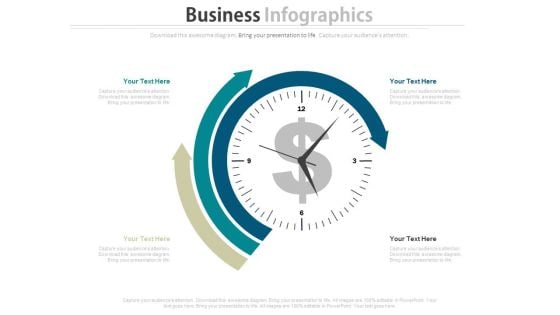
Dashboard Diagram For Finance And Strategic Analysis Powerpoint Slides
This PowerPoint template display graphics of clock with arrows around it and dollar symbol in center. You may use this PPT slide for financial and strategic analysis. This dashboard slide may useful for multilevel status report creation and approval process.
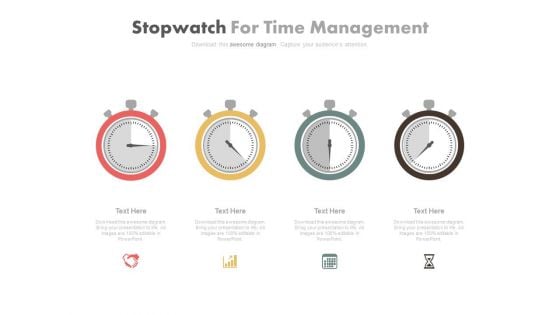
Dashboard Diagram For Time Management Powerpoint Slides
This PPT slide has been designed with graphics of four stop watches. You may sue this PowerPoint template for time management. This dashboard slide may useful for multilevel status report creation and approval process.
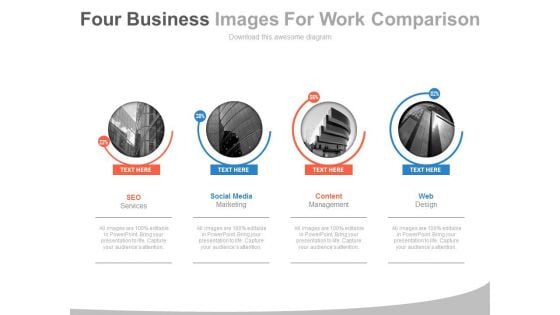
Four Companies With Web Services Powerpoint Slides
This PowerPoint template display graphics of four corporate buildings. You may use this PPT slide for financial and strategic analysis for web services companies. This dashboard slide may useful for multilevel status report creation and approval process.
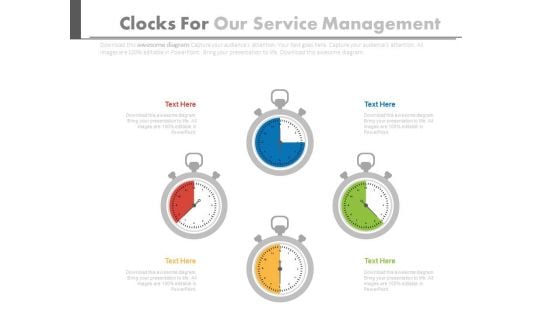
Four Stopwatches In Pie Chart Style Powerpoint Slides
This PPT slide has been designed with graphics of four stop watches in pie chart style. You may sue this PowerPoint template for time management. This dashboard slide may useful for multilevel status report creation and approval process.
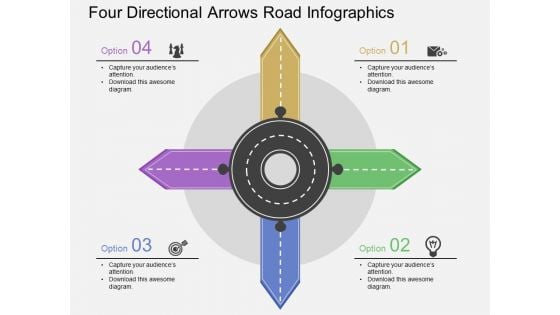
Four Directional Arrows Road Infographics Powerpoint Template
Download this exclusive business diagram to present four steps of financial reporting. This slide contains the four directional arrows road infographic. This PPT diagram slide is useful for business presentations.
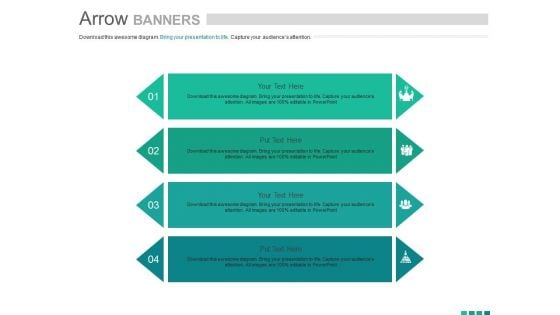
Banners For Income Statement And Balance Sheet Powerpoint Template
This PowerPoint contains four infographic banners. Download this diagram slide to display finance report. This template is editable, You can edit text, color, shade and style of this diagram as per you need.
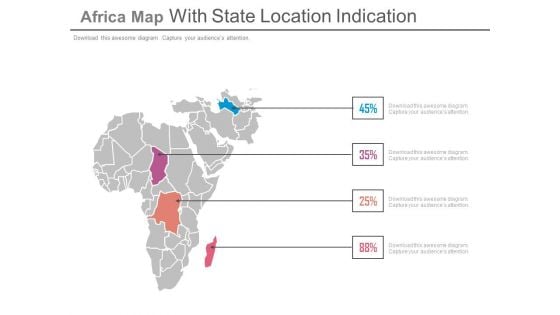
State Location On Africa Map With Percentage Data Powerpoint Slides
This PowerPoint template displays state location on Africa map with percentage data. This Map template can be used for annual growth report. This slide can also be used by school students for educational projects.
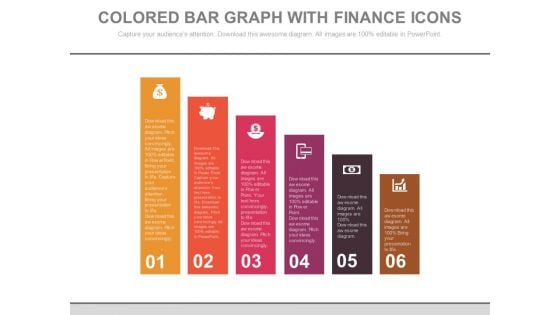
Bar Graph For Marketing Research Data Powerpoint Slides
This PowerPoint template has been designed with diagram of bar graph. This PPT slide can be used to prepare presentations for profit growth report and also for financial data analysis. You can download finance PowerPoint template to prepare awesome presentations.
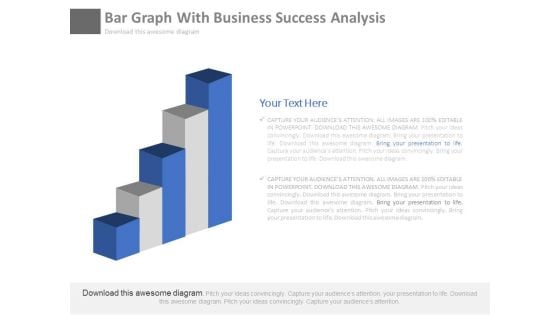
Bar Graph For Marketing Research Process Powerpoint Slides
This PowerPoint template has been designed with diagram of bar graph. This PPT slide can be used to prepare presentations for profit growth report and also for financial data analysis. You can download finance PowerPoint template to prepare awesome presentations.
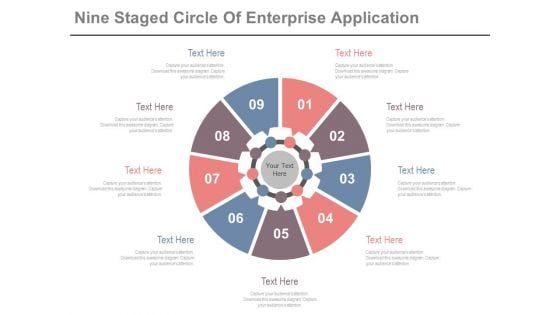
Circle Diagram For Business Marketing Mix Powerpoint Slides
This PowerPoint template has been designed with nine steps circle chart. This PPT slide can be used to prepare presentations for profit growth report and also for financial data analysis. You can download finance PowerPoint template to prepare awesome presentations.
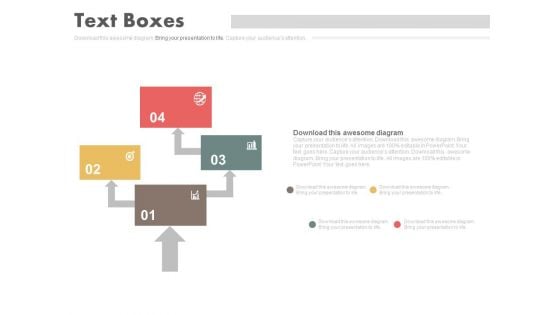
Four Steps Arrow Chart Design Powerpoint Slides
This PowerPoint template has been designed with four steps arrow chart. This PPT slide can be used to prepare presentations for marketing reports and also for financial data analysis. You can download finance PowerPoint template to prepare awesome presentations.
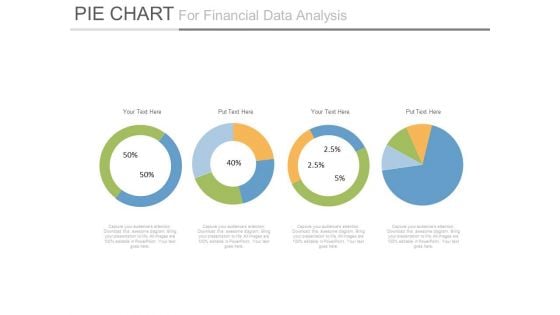
Pie Charts For Financial Ratio Analysis Powerpoint Slides
This PowerPoint template has been designed with diagram of pie charts. This PPT slide can be used to prepare presentations for profit growth report and also for financial data analysis. You can download finance PowerPoint template to prepare awesome presentations.
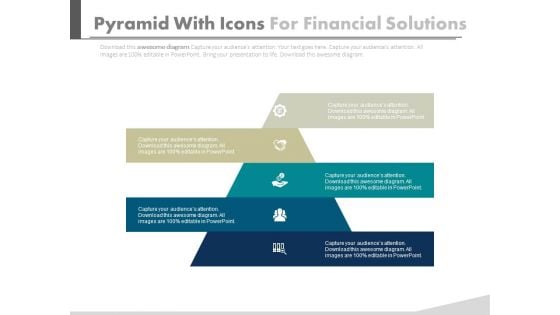
Pyramid For Financial Accounting Information Powerpoint Slides
This PowerPoint template has been designed with graphics of pyramid chart. This PPT slide can be used to prepare presentations for profit growth report and also for financial data analysis. You can download finance PowerPoint template to prepare awesome presentations.
Map Of Czech With Percentage Data And Icons Powerpoint Slides
This PowerPoint template displays map of Czech with percentage data and icons. This Map template can be used for annual growth report. This slide can also be used by school students for educational projects.
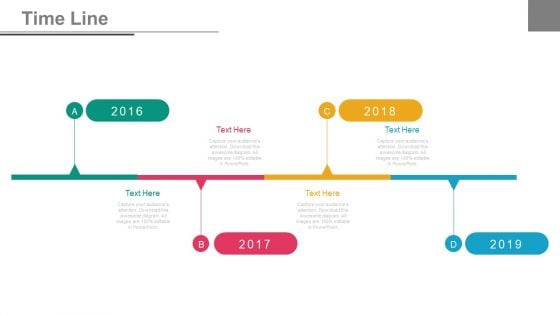
Four Years Tags Timeline Diagram Powerpoint Slides
This PowerPoint timeline slide design can be used to display yearly business report. This timeline template has been designed with four years tags. Download this PowerPoint timeline template to make impressive presentations.
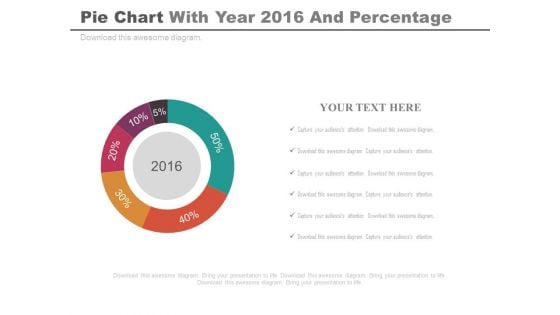
Pie Chart For Projected Profit Of 2016 Powerpoint Slides
Our above PPT slide displays graphics of Pie chart. This PowerPoint template may be used to display projected profit report of 2016. Download this template to leave permanent impression on your audience.
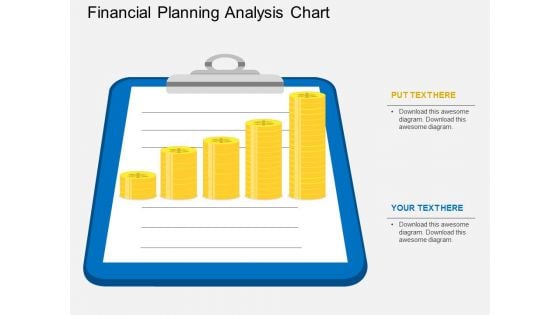
Financial Planning Analysis Chart Powerpoint Template
This PowerPoint slide contains graphics of note pad with gold coins. This professional slide may be used to display financial planning, report and analysis. Adjust the above diagram in your business presentations to give professional impact.
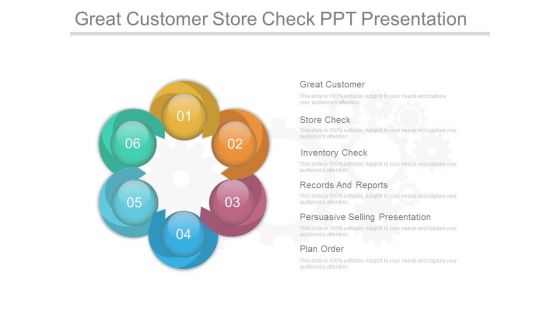
Great Customer Store Check Ppt Presentation
This is a great customer store check ppt presentation. This is a six stage process. The stages in this process are great customer, store check, inventory check, records and reports, persuasive selling presentation, plan order.
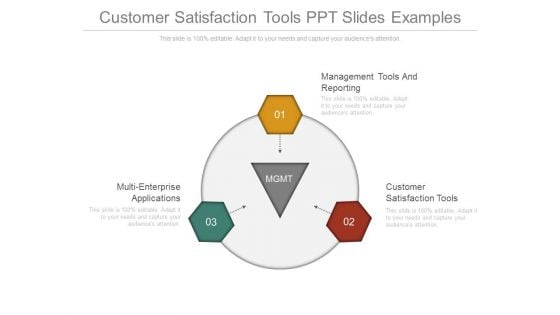
Customer Satisfaction Tools Ppt Slides Examples
This is a customer satisfaction tools ppt slides examples. This is a three stage process. The stages in this process are management tools and reporting, multi-enterprise applications, customer satisfaction tools.
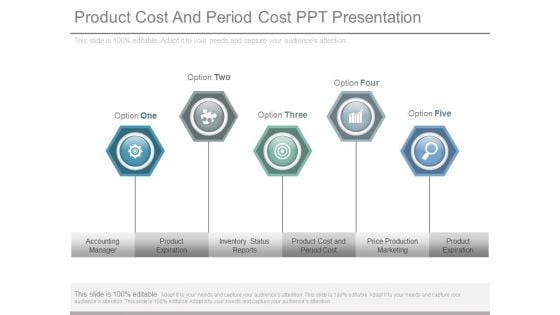
Product Cost And Period Cost Ppt Presentation
This is a product cost and period cost ppt presentation. This is a five stage process. The stages in this process are accounting manager, product expiration, inventory status reports, product cost and period cost, price production marketing, product expiration.
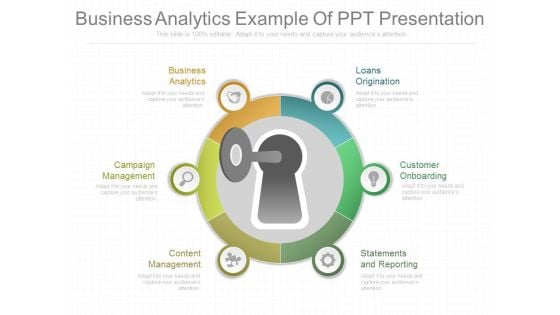
Business Analytics Example Of Ppt Presentation
This is a business analytics example of ppt presentation. This is a six stage process. The stages in this process are loans origination, customer onboarding, statements and reporting, content management, campaign management, business analytics.
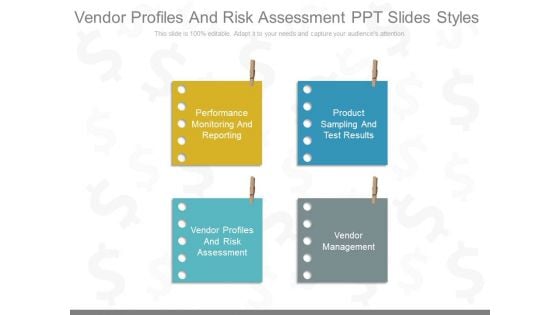
Vendor Profiles And Risk Assessment Ppt Slides Styles
This is a vendor profiles and risk assessment ppt slides styles. This is a four stage process. The stages in this process are performance monitoring and reporting, product sampling and test results, vendor profiles and risk assessment, vendor management.
Parties Apply To Participate Presentation Portfolio
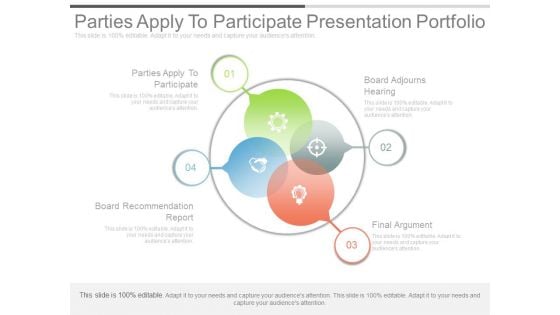
This is a parties apply to participate presentation portfolio. This is a four stage process. The stages in this process are parties apply to participate, board recommendation report, board adjourns hearing, final argument.
Analytics Solutions Sample Of Ppt Presentation
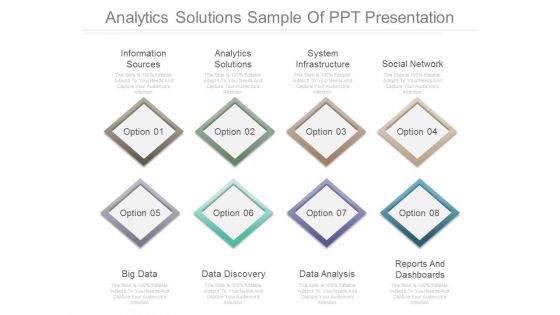
This is a analytics solutions sample of ppt presentation. This is a eight stage process. The stages in this process are information sources, analytics solutions, system infrastructure, social network, big data, data discovery, data analysis, reports and dashboards.
Increase Employee Satisfaction Powerpoint Slide Background
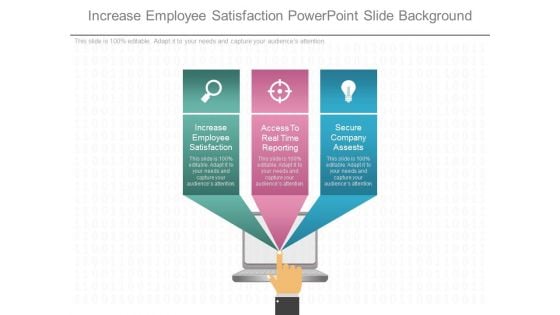
This is a increase employee satisfaction powerpoint slide background. This is a three stage process. The stages in this process are increase employee satisfaction, access to real time reporting, secure company assests.
Knowledge Base Threshold Monitoring Ppt Slides
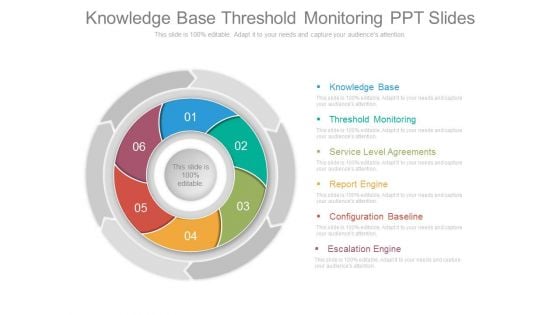
This is a knowledge base threshold monitoring ppt slides. This is a six stage process. The stages in this process are knowledge base, threshold monitoring, service level agreements, report engine, configuration baseline, escalation engine.
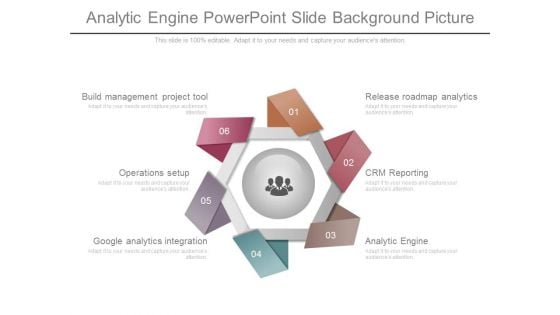
Analytic Engine Powerpoint Slide Background Picture
This is a analytic engine powerpoint slide background picture. This is a six stage process. The stages in this process are release roadmap analytics, crm reporting, analytic engine, build management project tool, operations setup, build management project tool.
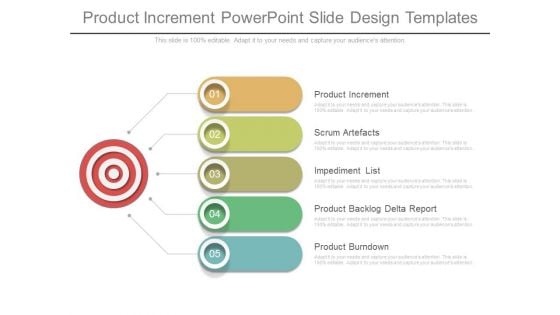
Product Increment Powerpoint Slide Design Templates
This is a product increment powerpoint slide design templates. This is a five stage process. The stages in this process are product increment, scrum artefacts, impediment list, product backlog delta report, product burndown.
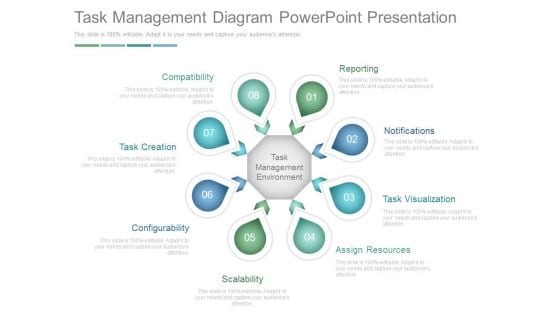
Task Management Diagram Powerpoint Presentation
This is a task management diagram powerpoint presentation. This is a eight stage process. The stages in this process are compatibility, task creation, configurability, scalability, assign resources, task visualization, notifications, reporting.
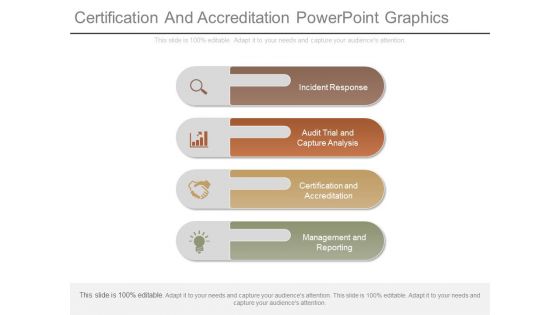
Certification And Accreditation Powerpoint Graphics
This is a certification and accreditation powerpoint graphics. This is a four stage process. The stages in this process are incident response, audit trial and capture analysis, certification and accreditation, management and reporting.
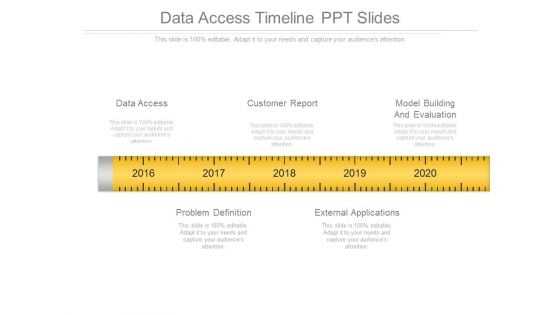
Data Access Timeline Ppt Slides
This is a data access timeline ppt slides. This is a five stage process. The stages in this process are data access, customer report, model building and evaluation, problem definition, external applications.
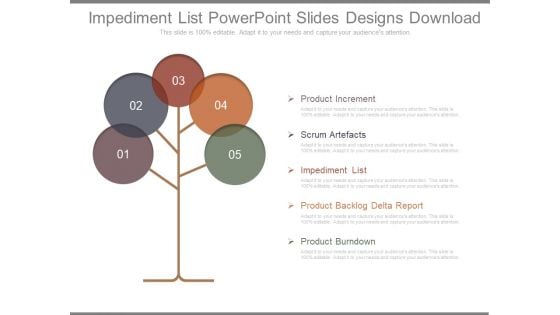
Impediment List Powerpoint Slides Designs Download

Industrial Marketing Research Ppt Background Template
This is a industrial marketing research ppt background template. This is a five stage process. The stages in this process are identify the problem, develop research design, collect data or info, process and analyze the data, create a report.
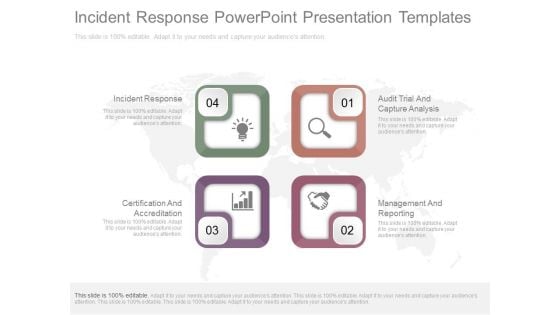
Incident Response Powerpoint Presentation Templates
This is a incident response powerpoint presentation templates. This is a four stage process. The stages in this process are incident response, audit trial and capture analysis, management and reporting, certification and accreditation.
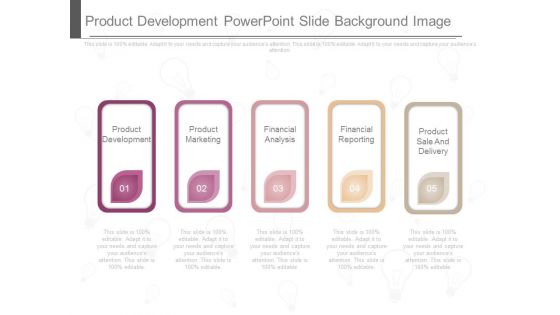
Product Development Powerpoint Slide Background Image
This is a product development powerpoint slide background image. This is a five stage process. The stages in this process are product development, product marketing, financial analysis, financial reporting, product sale and delivery.
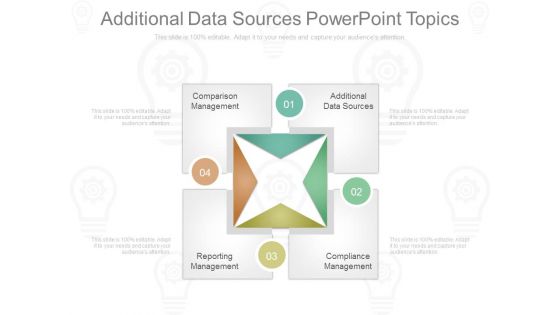
Additional Data Sources Powerpoint Topics
This is a additional data sources powerpoint topics. This is a four stage process. The stages in this process are additional data sources, compliance management, reporting management, comparison management.
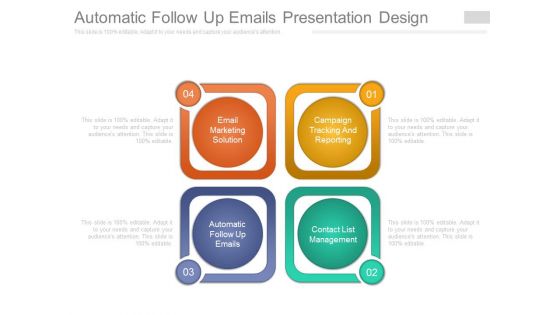
Automatic Follow Up Emails Presentation Design
This is a automatic follow up emails presentation design. This is a four stage process. The stages in this process are email marketing solution, automatic follow up emails, campaign tracking and reporting, contact list management.
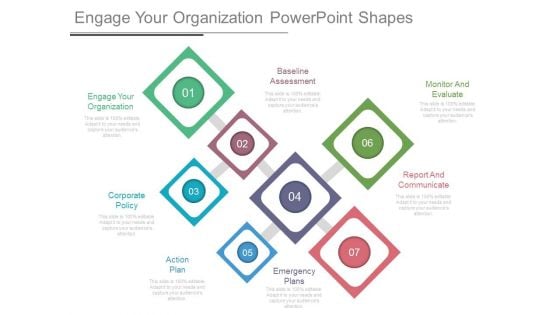
Engage Your Organization Powerpoint Shapes
This is a engage your organization powerpoint shapes. This is a seven stage process. The stages in this process are engage your organization, baseline assessment, corporate policy, emergency plans, action plan, monitor and evaluate, report and communicate.
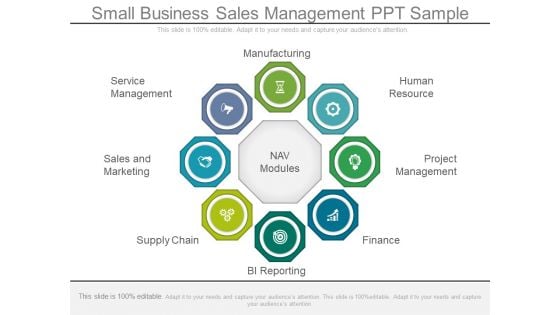
Small Business Sales Management Ppt Sample

Kpi Engineering Process Cycle Diagram Ppt Sample
This is a kpi engineering process cycle diagram ppt sample. This is a six stage process. The stages in this process are program discovery, database optimization, program implementation, program delivery, program maintenance, analysis and reporting.
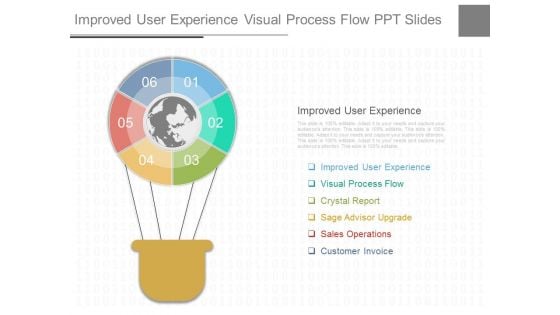
Improved User Experience Visual Process Flow Ppt Slides
This is a improved user experience visual process flow ppt slides. This is a six stage process. The stages in this process are improved user experience, visual process flow, crystal report, sage advisor upgrade, sales operations, customer invoice.

Order Fulfillment Cycle Diagram Ppt Sample
This is an order fulfillment cycle diagram ppt sample. This is a four stage process. The stages in this process are storage, incoming orders, picking, packing and despatch, reporting, stock control, incoming shipments.
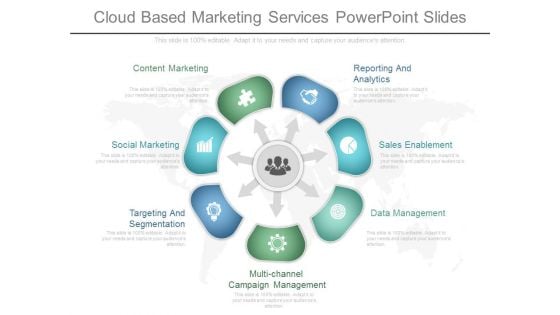
Cloud Based Marketing Services Powerpoint Slides
This is a cloud based marketing services powerpoint slides. This is a seven stage process. The stages in this process are content marketing, social marketing, targeting and segmentation, multi channel campaign management, data management, sales enablement, reporting and analytics.
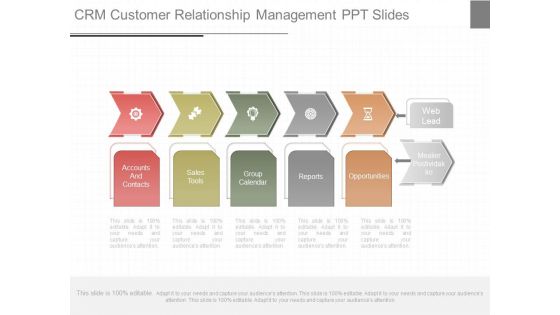
Crm Customer Relationship Management Ppt Slides
This is a crm customer relationship management ppt slides. This is a five stage process. The stages in this process are accounts and contacts, sales tools, group calendar, reports, opportunities, web lead, mealier postividakko.
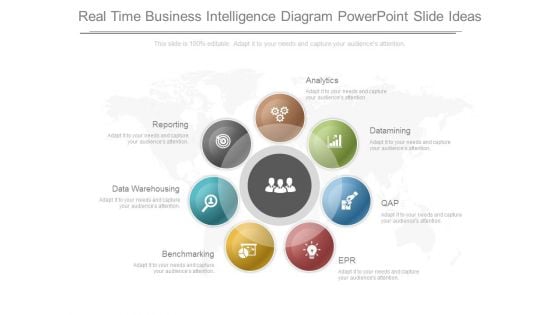
Real Time Business Intelligence Diagram Powerpoint Slide Ideas
This is a real time business intelligence diagram powerpoint slide ideas. This is a seven stage process. The stages in this process are data warehousing, reporting, analytics, datamining, qap, epr, benchmarking.
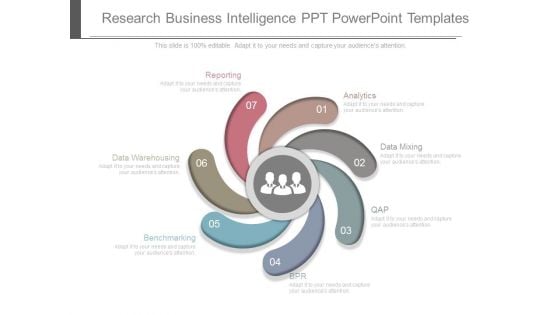
Research Business Intelligence Ppt Powerpoint Templates
This is a research business intelligence ppt powerpoint templates. This is a seven stage process. The stages in this process are data warehousing, reporting, analytics, datamining, qap, epr, benchmarking.
Search Engine Optimization Layout Ppt Icon
This is a search engine optimization layout ppt icon. This is a six stage process. The stages in this process are link building, keywords, reporting, development, research, site analysis.
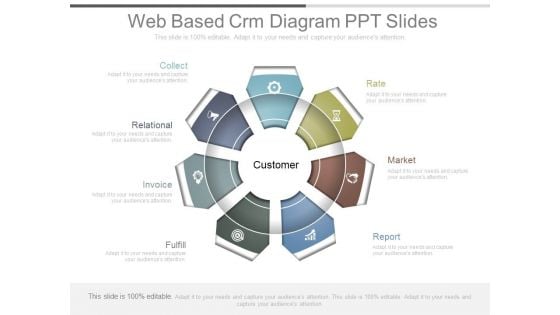
Web Based Crm Diagram Ppt Slides
This is a web based crm diagram ppt slides. This is a five stage process. The stages in this process are collect, relational, invoice, fulfill, rate, market, report, customer.
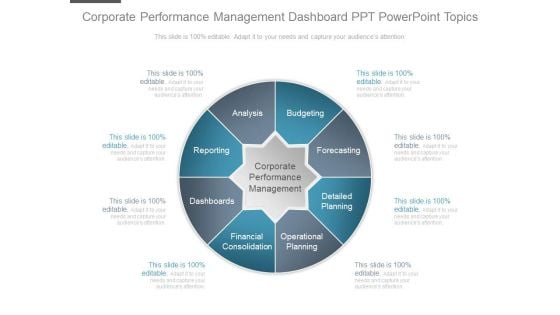
Corporate Performance Management Dashboard Ppt Powerpoint Topics
This is a corporate performance management dashboard ppt powerpoint topics. This is a eight stage process. The stages in this process are analysis, reporting, dashboards, financial consolidation, budgeting, forecasting, detailed planning, operational planning, corporate performance management.
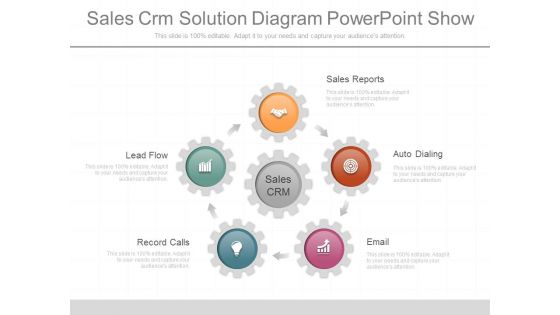
Sales Crm Solution Diagram Powerpoint Show
This is a sales crm solution diagram powerpoint show. This is a five stage process. The stages in this process are lead flow, record calls, email, auto dialing, sales reports, sales crm.
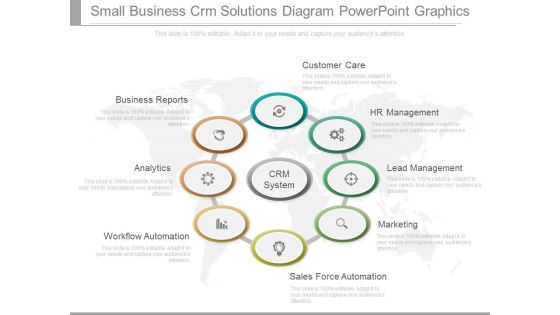
Small Business Crm Solutions Diagram Powerpoint Graphics
This is a small business crm solutions diagram powerpoint graphics. This is a eight stage process. The stages in this process are business reports, analytics, workflow automation, sales force automation, marketing, lead management, hr management, customer care, crm system.
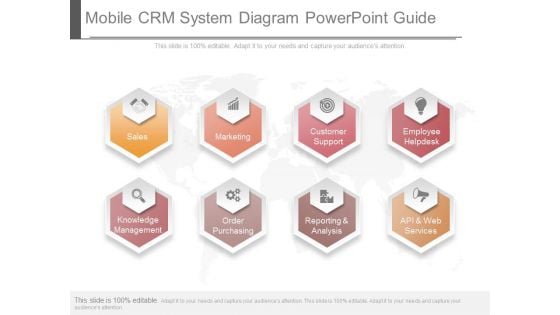
Mobile Crm System Diagram Powerpoint Guide
This is a mobile crm system diagram powerpoint guide. This is a eight stage process. The stages in this process are sales, marketing, customer support, employee helpdesk, knowledge management, order purchasing, reporting and analysis, api and web services.
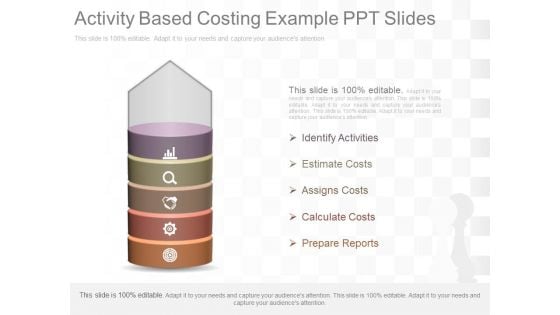
Activity Based Costing Example Ppt Slides
This is a activity based costing example ppt slides. This is a five stage process. The stages in this process are identify activities, estimate costs, assigns costs, calculate costs, prepare reports.
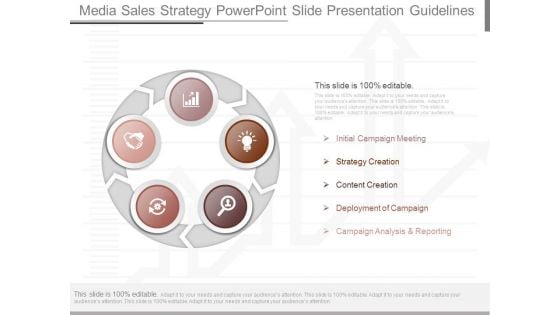
Media Sales Strategy Powerpoint Slide Presentation Guidelines
This is a media sales strategy powerpoint slide presentation guidelines. This is a five stage process. The stages in this process are initial campaign meeting, strategy creation, content creation, deployment of campaign, campaign analysis and reporting.
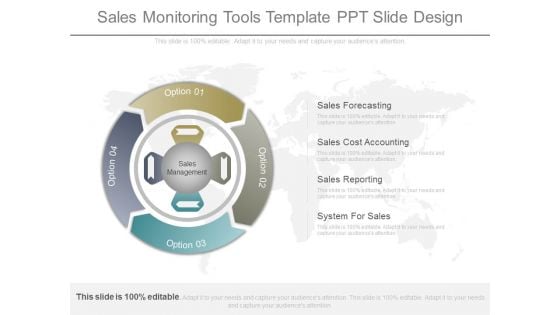
Sales Monitoring Tools Template Ppt Slide Design
This is a sales monitoring tools template ppt slide design. This is a four stage process. The stages in this process are sales forecasting, sales cost accounting, sales reporting, system for sales.
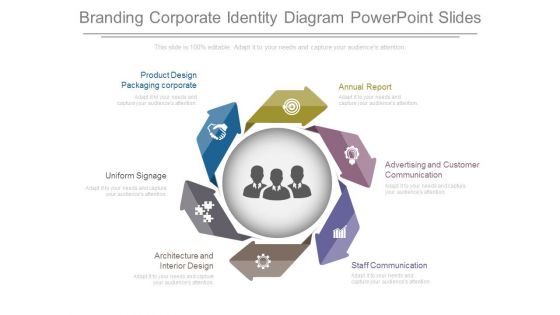
Branding Corporate Identity Diagram Powerpoint Slides
This is a branding corporate identity diagram powerpoint slides. This is a six stage process. The stages in this process are annual report, advertising and customer communication, staff communication, architecture and interior design uniform signage, product design packaging corporate.


 Continue with Email

 Home
Home


