data analysis

Detail Impact Security Awareness Training Can Reduce The Risk Of A Data Breach Hacking Prevention Awareness Training For IT Security Professional PDF
This slide covers the impact of data breaching threats such as phishing breakdown, network intrusion breakdown, system misconfiguration, stolen or lost devices or records and inadvertent disclosure. Deliver and pitch your topic in the best possible manner with this detail impact security awareness training can reduce the risk of a data breach hacking prevention awareness training for it security professional pdf. Use them to share invaluable insights on system misconfiguration, network intrusion breakdown, phishing breakdown and impress your audience. This template can be altered and modified as per your expectations. So, grab it now.
Manufacturing Plan Ppt PowerPoint Presentation Infographic Template Icons
This is a manufacturing plan ppt powerpoint presentation infographic template icons. This is a seven stage process. The stages in this process are table, marketing, planning, strategy, data analysis.
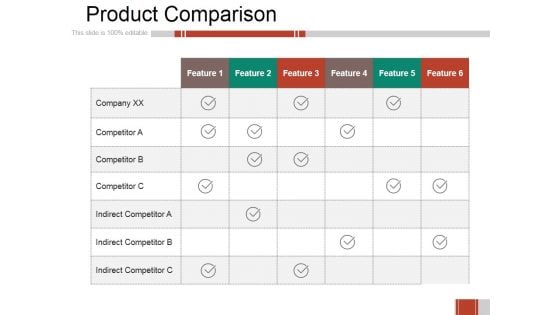
Product Comparison Ppt PowerPoint Presentation Visual Aids Gallery
This is a product comparison ppt powerpoint presentation visual aids gallery. This is a six stage process. The stages in this process are business, table, marketing, data analysis, feature.
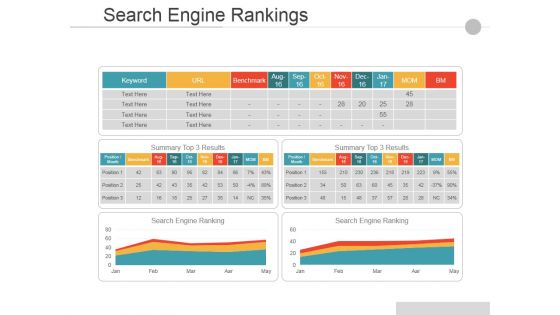
Search Engine Rankings Ppt PowerPoint Presentation Layouts Gridlines
This is a Search Engine Rankings Ppt PowerPoint Presentation Layouts Gridlines. This is a three stage process. The stages in this process are Business, Marketing, Table, Data Analysis, Finance.
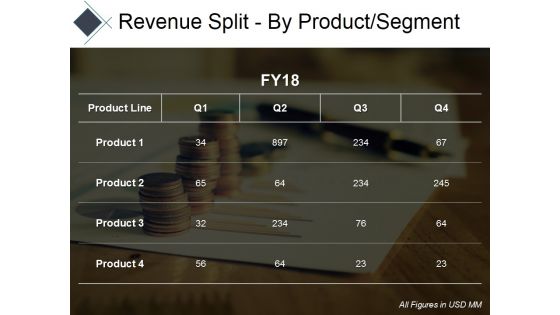
Revenue Split By Product Segment Template Ppt PowerPoint Presentation Pictures Professional
This is a revenue split by product segment template ppt powerpoint presentation pictures professional. This is a four stage process. The stages in this process are table, data analysis, business, marketing, compare.
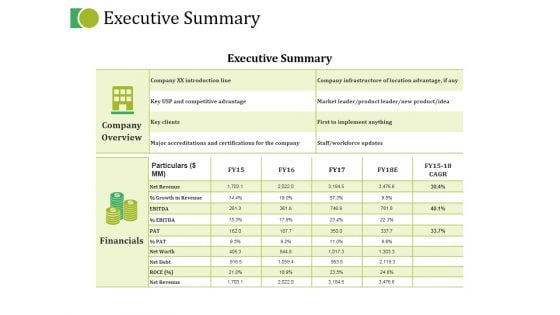
Executive Summary Ppt PowerPoint Presentation Portfolio Maker
This is a executive summary ppt powerpoint presentation portfolio maker. This is a two stage process. The stages in this process are company overview, financials, tables, management, data analysis.
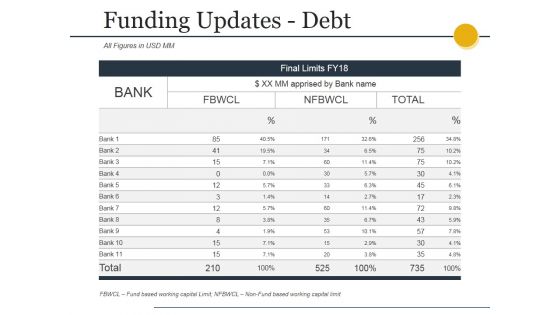
Funding Updates Debt Ppt PowerPoint Presentation Infographic Template Picture
This is a funding updates debt ppt powerpoint presentation infographic template picture. This is a six stage process. The stages in this process are funding, tables, data, analysis, planning.
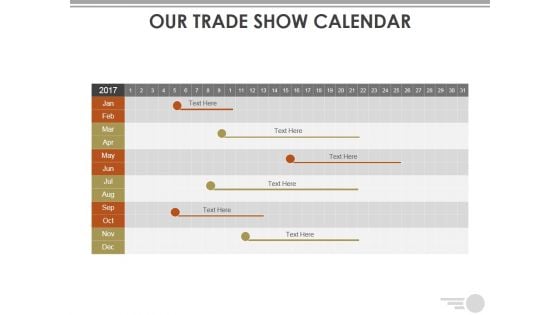
Our Trade Show Calendar Ppt PowerPoint Presentation Styles Tips
This is a our trade show calendar ppt powerpoint presentation styles tips. This is a six stage process. The stages in this process are table, data, analysis, marketing, business.
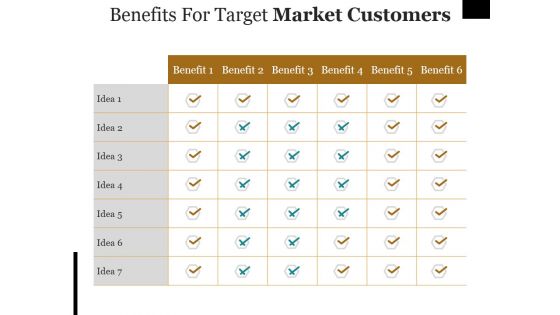
Benefits For Target Market Customers Ppt PowerPoint Presentation Professional Outfit
This is a benefits for target market customers ppt powerpoint presentation professional outfit. This is a six stage process. The stages in this process are tables, benefits, data, analysis, marketing.
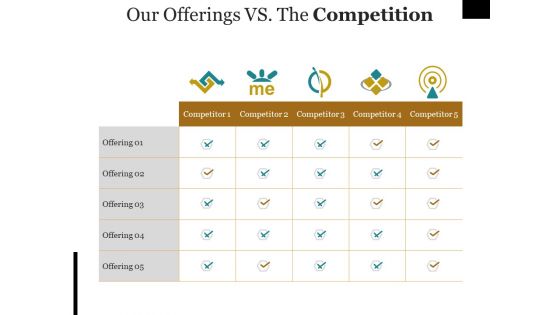
Our Offerings Vs The Competition Ppt PowerPoint Presentation Professional Grid
This is a our offerings vs the competition ppt powerpoint presentation professional grid. This is a five stage process. The stages in this process are tables, data, analysis, marketing, business.
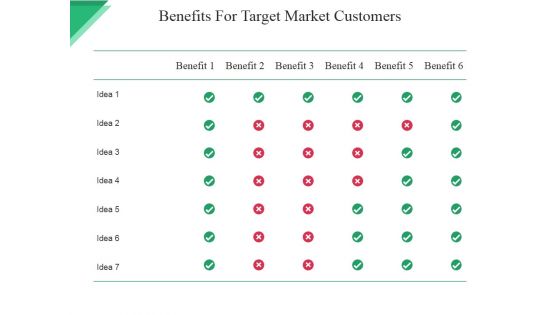
Benefits For Target Market Customers Ppt PowerPoint Presentation Summary Example Introduction
This is a benefits for target market customers ppt powerpoint presentation summary example introduction. This is a six stage process. The stages in this process are benefits, table, compare, data, analysis.
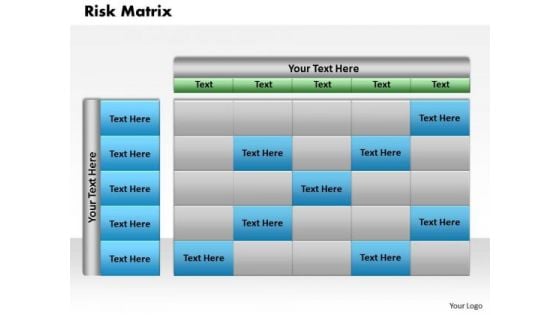
Business Framework Matrix PowerPoint Presentation
This business framework power point template has been designed with graphic of matrix. This two variable matrix can be used for data manipulation and analysis. Use this template to show business data analysis and create an impact on viewers.
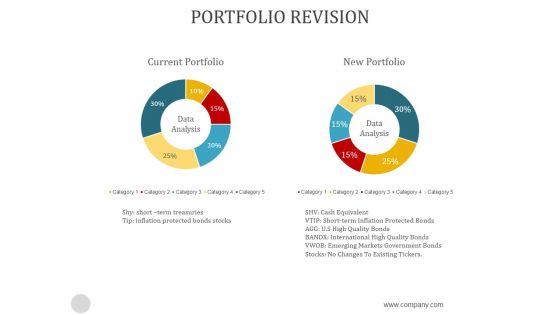
Portfolio Revision Ppt PowerPoint Presentation Template
This is a portfolio revision ppt powerpoint presentation template. This is a two stage process. The stages in this process are data analysis, current portfolio, new portfolio.
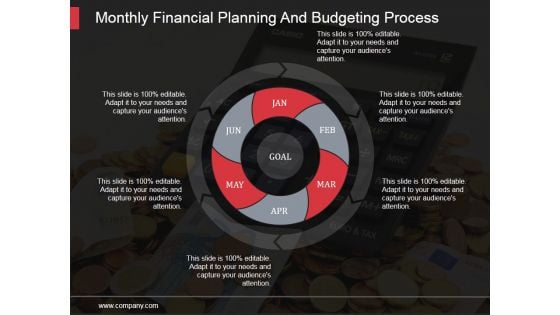
Monthly Financial Planning And Budgeting Process Ppt PowerPoint Presentation Visuals
This is a monthly financial planning and budgeting process ppt powerpoint presentation visuals. This is a six stage process. The stages in this process are growth, finance, development, financial development, economic growth, data analysis.

Strategy Analytics Ppt Layout Powerpoint Slide
This is a strategy analytics ppt layout powerpoint slide. This is a four stage process. The stages in this process are team, data, processes, data analysis.
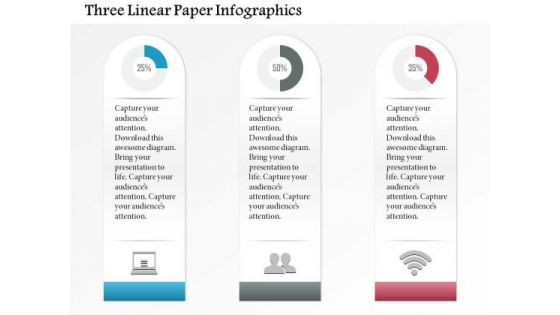
Business Diagram Three Linear Paper Infographics Presentation Template
Three linear paper info graphics has been used to design this power point template slide. This PPT slide contains the concept of data analysis and business data flow. Use this PPT slide for your business and marketing related presentations.
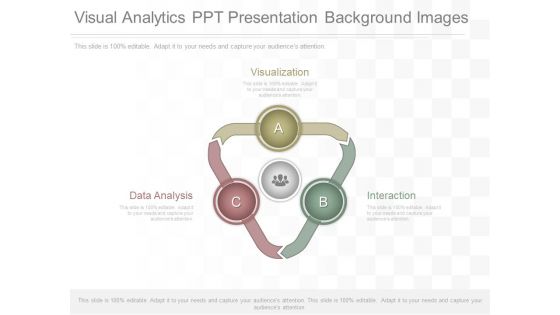
Visual Analytics Ppt Presentation Background Images
This is a visual analytics ppt presentation background images. This is a three stage process. The stages in this process are visualization, interaction, data analysis.
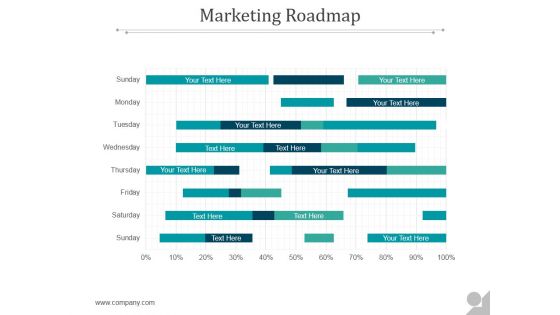
Marketing Roadmap Ppt PowerPoint Presentation Templates
This is a marketing roadmap ppt powerpoint presentation templates. This is a eight stage process. The stages in this process are business, marketing, success, data analysis, presentation.
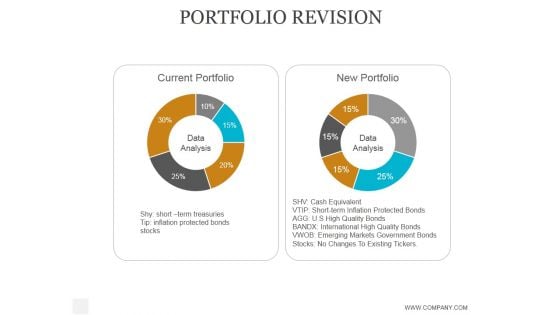
Portfolio Revision Ppt PowerPoint Presentation Templates
This is a portfolio revision ppt powerpoint presentation templates. This is a two stage process. The stages in this process are current portfolio, new portfolio, data analysis.
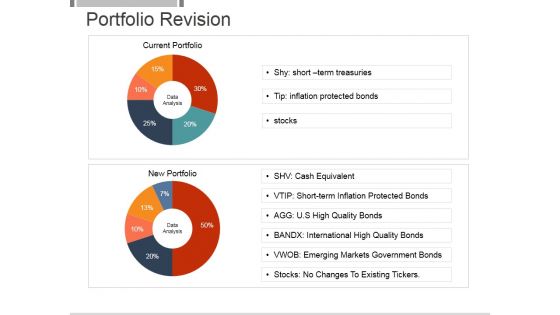
Portfolio Revision Ppt PowerPoint Presentation Rules
This is a portfolio revision ppt powerpoint presentation rules. This is a two stage process. The stages in this process are current portfolio, new portfolio, data analysis.
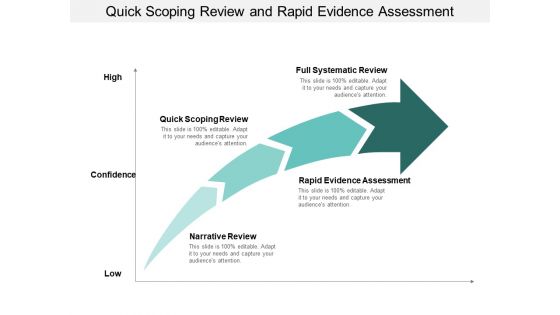
Quick Scoping Review And Rapid Evidence Assessment Ppt PowerPoint Presentation Outline Skills
This is a quick scoping review and rapid evidence assessment ppt powerpoint presentation outline skills. This is a four stage process. The stages in this process are data analysis, data review, data evaluation.
Business Performance Review Taking Actions And Improving Ppt PowerPoint Presentation Icon Background
This is a business performance review taking actions and improving ppt powerpoint presentation icon background. This is a four stage process. The stages in this process are data analysis, data review, data evaluation.
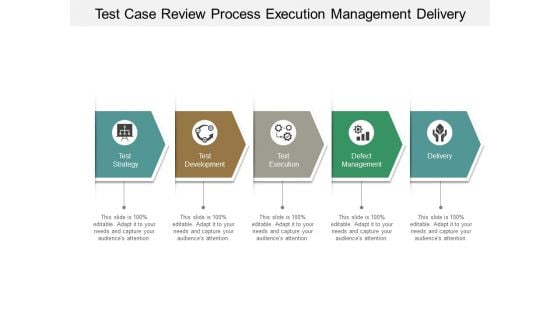
Test Case Review Process Execution Management Delivery Ppt PowerPoint Presentation Ideas Graphics Tutorials
This is a test case review process execution management delivery ppt powerpoint presentation ideas graphics tutorials. This is a five stage process. The stages in this process are data analysis, data review, data evaluation.
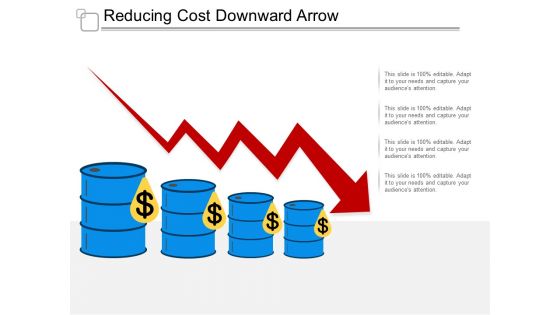
Reducing Cost Downward Arrow Ppt Powerpoint Presentation Outline Inspiration
This is a reducing cost downward arrow ppt powerpoint presentation outline inspiration. This is a four stage process. The stages in this process are data analysis, data science, information science.

Reducing Cost Dollar Sign With Cloud On Mobile Ppt Powerpoint Presentation Styles File Formats
This is a reducing cost dollar sign with cloud on mobile ppt powerpoint presentation styles file formats. This is a four stage process. The stages in this process are data analysis, data science, information science.
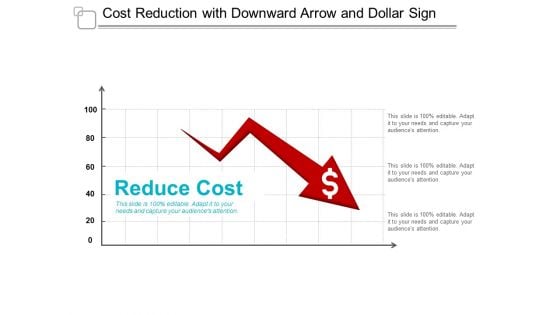
Cost Reduction With Downward Arrow And Dollar Sign Ppt Powerpoint Presentation Infographics Templates
This is a cost reduction with downward arrow and dollar sign ppt powerpoint presentation infographics templates. This is a three stage process. The stages in this process are data analysis, data science, information science.

Minimize Expenses To Reduce Business Cost Ppt Powerpoint Presentation Inspiration Pictures
This is a minimize expenses to reduce business cost ppt powerpoint presentation inspiration pictures. This is a four stage process. The stages in this process are data analysis, data science, information science.

Reducing Cost Vector Dollar Sign With Down Arrow Ppt Powerpoint Presentation Model Outline
This is a reducing cost vector dollar sign with down arrow ppt powerpoint presentation model outline. This is a four stage process. The stages in this process are data analysis, data science, information science.

Ways To Reduce Business Costs Ppt Powerpoint Presentation Portfolio Images
This is a ways to reduce business costs ppt powerpoint presentation portfolio images. This is a four stage process. The stages in this process are data analysis, data science, information science.
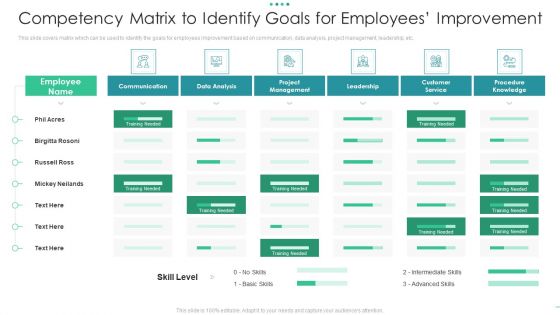
Competency Matrix To Identify Goals For Employees Improvement Template Pdf
This slide covers matrix which can be used to identify the goals for employees improvement based on communication, data analysis, project management, leadership, etc. Deliver and pitch your topic in the best possible manner with this competency matrix to identify goals for employees improvement template pdf. Use them to share invaluable insights on project management, customer, service, data analysis, communication and impress your audience. This template can be altered and modified as per your expectations. So, grab it now.
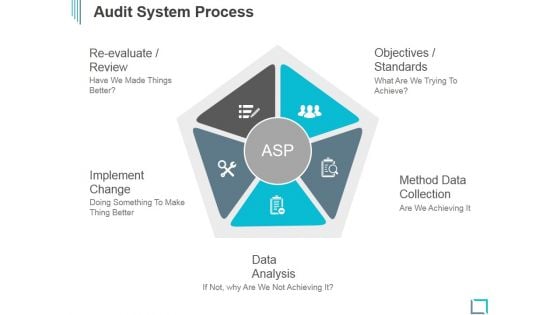
Audit System Process Ppt PowerPoint Presentation Good
This is a audit system process ppt powerpoint presentation good. This is a five stage process. The stages in this process are re evaluate review, objectives standards, implement change, method data collection, data analysis.
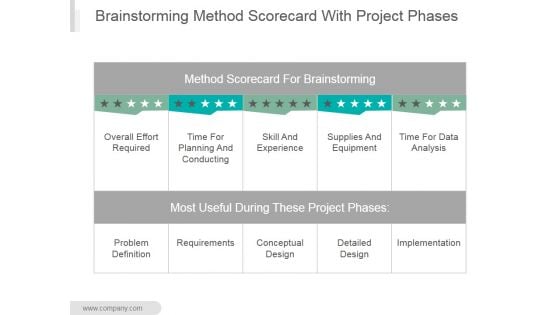
Brainstorming Method Scorecard With Project Phases Ppt PowerPoint Presentation Sample
This is a brainstorming method scorecard with project phases ppt powerpoint presentation sample. This is a five stage process. The stages in this process are method scorecard for brainstorming, overall effort required, time for planning and conducting, skill and experience, supplies and equipment, time for data analysis.
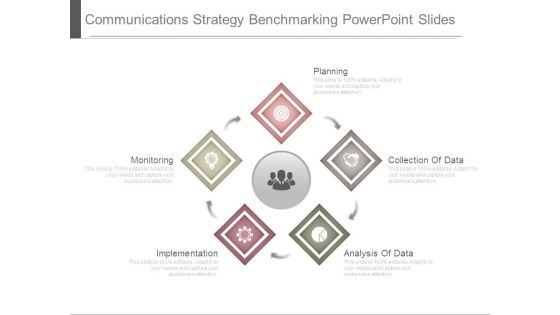
Communications Strategy Benchmarking Powerpoint Slides
This is a communications strategy benchmarking powerpoint slides. This is a five stage process. The stages in this process are planning, collection of data, analysis of data, implementation, monitoring.
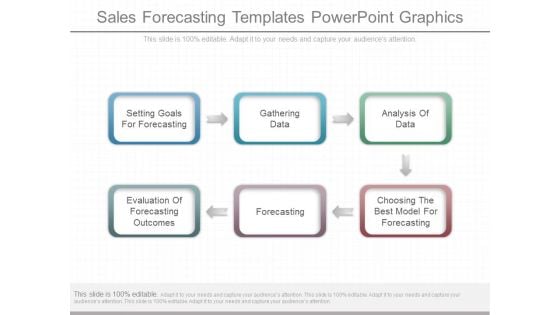
Sales Forecasting Templates Powerpoint Graphics
This is a sales forecasting templates powerpoint graphics. This is a six stage process. The stages in this process are setting goals for forecasting, gathering data, analysis of data, evaluation of forecasting outcomes, forecasting, choosing the best model for forecasting.
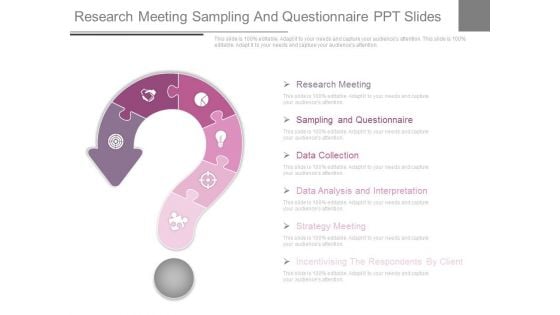
Research Meeting Sampling And Questionnaire Ppt Slides
This is a research meeting sampling and questionnaire ppt slides. This is a six stage process. The stages in this process are sampling and questionnaire, research meeting, data collection, data analysis and interpretation, strategy meeting, incentivising the respondents by client.

Web Based Crm Applications Ppt Powerpoint Ideas
This is a web based crm applications ppt powerpoint ideas. This is a three stage process. The stages in this process are industry information portal, data collection, decision support, integrated management, data analysis and statistics, information service, central database.
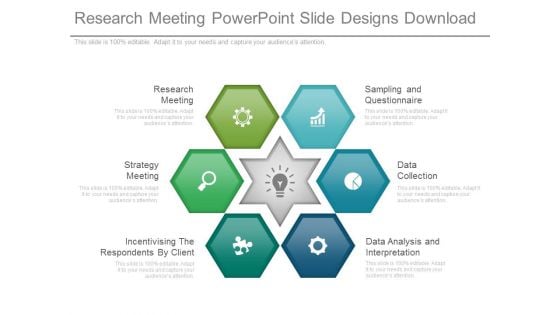
Research Meeting Powerpoint Slide Designs Download
This is a research meeting powerpoint slide designs download. This is a six stage process. The stages in this process are research meeting, sampling and questionnaire, strategy meeting, data collection, incentivising the respondents by client, data analysis and interpretation.
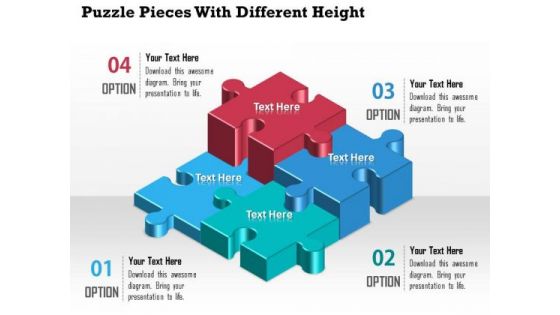
Business Diagram Puzzle Pieces With Different Height Presentation Template
A professional bar graph has been crafted with graphic of puzzles. All these puzzles are in different heights which shows the various levels of any data result representations. Use this diagram for your business result and data analysis related topics.
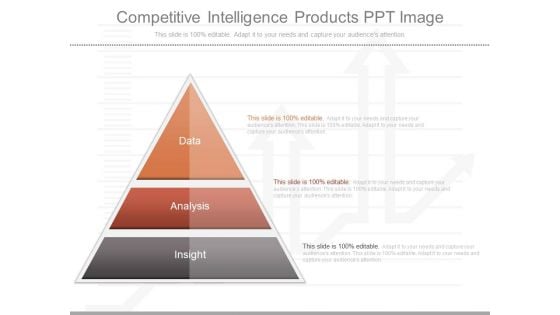
Competitive Intelligence Products Ppt Image
This is a competitive intelligence products ppt image. This is a three stage process. The stages in this process are data, analysis, insight.
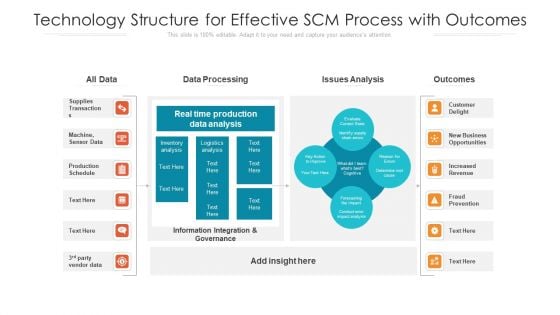
Technology Structure For Effective SCM Process With Outcomes Ppt PowerPoint Presentation File Gridlines PDF
Showcasing this set of slides titled technology structure for effective scm process with outcomes ppt powerpoint presentation file gridlines pdf. The topics addressed in these templates are data analysis, data processing, business opportunities. All the content presented in this PPT design is completely editable. Download it and make adjustments in color, background, font etc. as per your unique business setting.
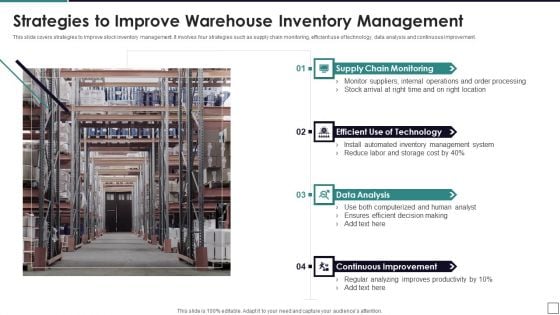
Strategies To Improve Warehouse Inventory Management Summary PDF
This slide covers strategies to improve stock inventory management. It involves four strategies such as supply chain monitoring, efficient use of technology, data analysis and continuous improvement. Presenting Strategies To Improve Warehouse Inventory Management Summary PDF to dispense important information. This template comprises four stages. It also presents valuable insights into the topics including Supply Chain Monitoring, Data Analysis, Continuous Improvement. This is a completely customizable PowerPoint theme that can be put to use immediately. So, download it and address the topic impactfully.
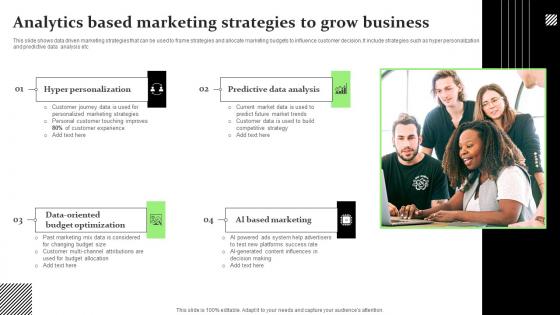
Analytics Based Marketing Strategies To Grow Business Themes Pdf
This slide shows data driven marketing strategies that can be used to frame strategies and allocate marketing budgets to influence customer decision. It include strategies such as hyper personalization and predictive data analysis etc.Showcasing this set of slides titled Analytics Based Marketing Strategies To Grow Business Themes Pdf The topics addressed in these templates are Hyper Personalization, Predictive Data Analysis, Budget Optimization All the content presented in this PPT design is completely editable. Download it and make adjustments in color, background, font etc. as per your unique business setting. This slide shows data driven marketing strategies that can be used to frame strategies and allocate marketing budgets to influence customer decision. It include strategies such as hyper personalization and predictive data analysis etc.
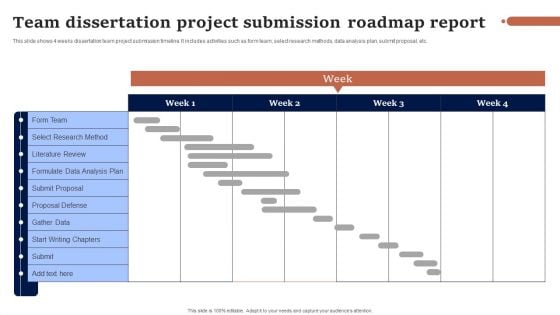
Team Dissertation Project Submission Roadmap Report Microsoft PDF
This slide shows 4 weeks dissertation team project submission timeline. It includes activities such as form team, select research methods, data analysis plan, submit proposal, etc. Pitch your topic with ease and precision using this Team Dissertation Project Submission Roadmap Report Microsoft PDF. This layout presents information on Team, Gather Data, Formulate Data Analysis Plan. It is also available for immediate download and adjustment. So, changes can be made in the color, design, graphics or any other component to create a unique layout.
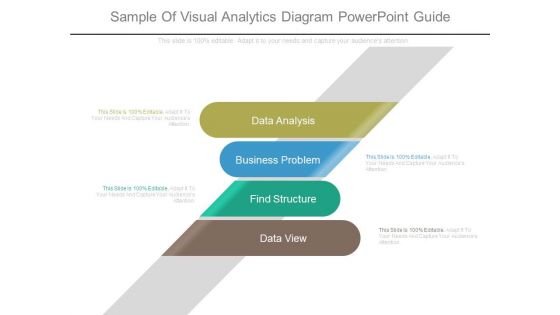
Sample Of Visual Analytics Diagram Powerpoint Guide
This is a sample of visual analytics diagram powerpoint guide. This is a four stage process. The stages in this process are data analysis, business problem, find structure, data view.
Database System PowerPoint Icon F
Microsoft PowerPoint Template and Background with database system for reports and data analysis Give them a big deal with our Database System PowerPoint Icon F. The audience will be unabashedly appreciative.

Stock Photo Golden Dollar Symbol With Pie Graph PowerPoint Slide
This Power Point template has been crafted with graphic of golden dollar symbol and pie chart on a tablet. Display the concept of financial data analysis with this image. Use this image to present financial reports in business presentations.
Database System PowerPoint Icon Cc
Microsoft PowerPoint Template and Background with database system for reports and data analysis Underline your erudition with our Database System PowerPoint Icon Cc. They will project your considerable expertise.
Database System PowerPoint Icon R
Microsoft PowerPoint Template and Background with database system for reports and data analysis Our Database System PowerPoint Icon R are self explanatory. What you get is what you see.
Database System PowerPoint Icon C
Microsoft PowerPoint Template and Background with database system for reports and data analysis Our Database System PowerPoint Icon C have fantastic ability. They will have an astounding effect on the audience.
Database System PowerPoint Icon S
Microsoft PowerPoint Template and Background with database system for reports and data analysis Never fail to impress with our Database System PowerPoint Icon S. You will be at the top of your game.
Battery Icons For Business Growth Levels Powerpoint Template
Levels of business growth can be displayed with this diagram. This PowerPoint template contains graphics of seven battery icons. You can use this design for data analysis in business presentations
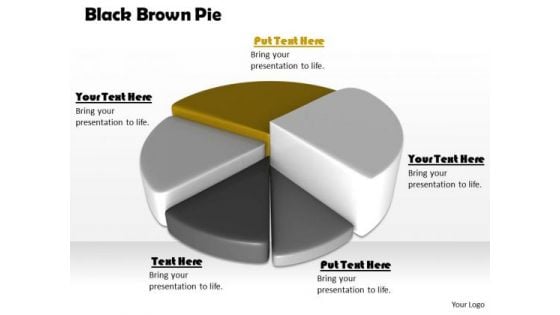
Stock Photo Black Brown Pie Chart For Business Result PowerPoint Slide
This high quality image is designed with pie chart. Use this image to make business reports. Use this outstanding image in presentations relating to data analysis and reports. Go ahead and add charm to your presentations.
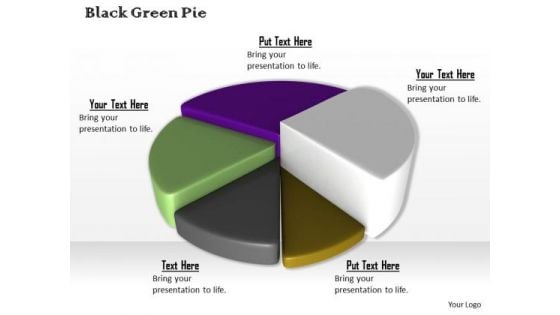
Stock Photo Colorful 3d Pie Chart For Business Result PowerPoint Slide
This high quality image is designed with pie chart. Use this image to make business reports. Use this outstanding image in presentations relating to data analysis and reports. Go ahead and add charm to your presentations.
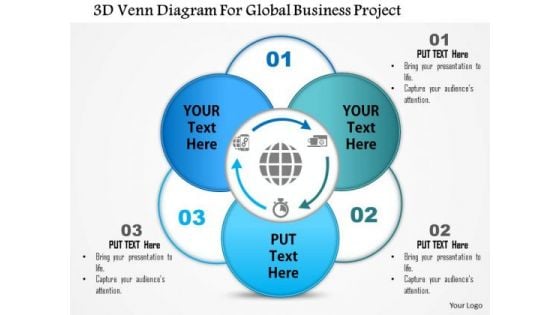
Business Diagram 3d Venn Diagram For Global Business Project Presentation Template
This business diagram displays 3d Venn diagram. This editable slide is suitable to present business reports. Use this diagram for business and finance related topics and display complete data analysis in your presentation.
Six Staged Infographics Square With Business Icons Powerpoint Templates
This business diagram displays circular puzzle infographic. This editable slide is suitable to present global communication. Use this diagram for business and finance related topics and display complete data analysis in your presentation.
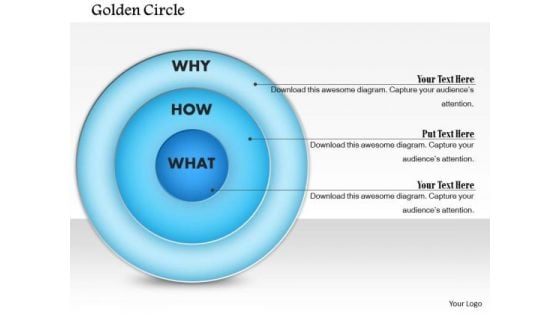
Business Framework Golden Circle PowerPoint Presentation
This business diagram has been designed with graphic of blue colored circle. This business slide is suitable to display data analysis in any business presentation. Use this slide to build a unique presentations for your viewers
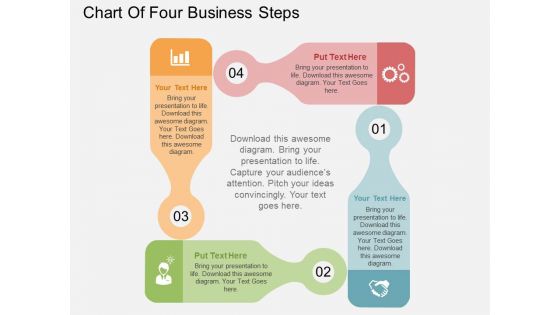
Chart Of Four Business Steps Powerpoint Templates
This business diagram displays flow of four business steps. This editable slide is suitable to present growth management. Use this diagram for business and finance related topics and display complete data analysis in your presentation.
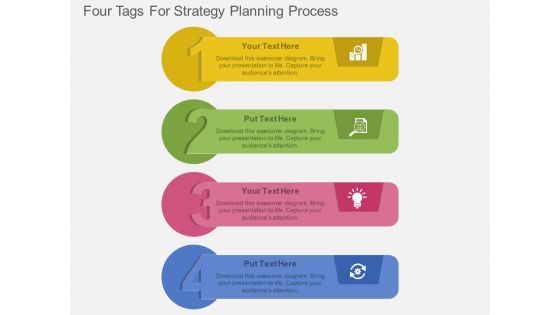
Four Tags For Strategy Planning Process Powerpoint Template
Steps for strategy planning can be explained with this diagram. This PowerPoint template contains diagram of four infographic tags. You can also use this design for data analysis in business presentations
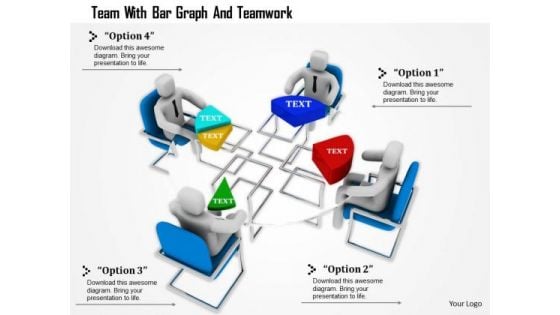
Team With Bar Graph And Teamwork
This Power Point template has been designed with graphic of 3d team forming a pie chart. In this slide team is displaying data analysis and comparison. Use this editable slide to build innovative presentation for your viewers.
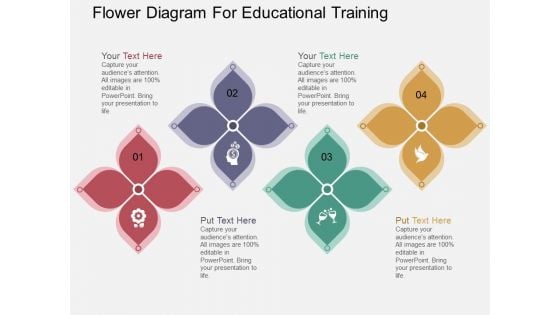
Flower Diagram For Educational Training Powerpoint Template
Colorful flowers have been used to design this PowerPoint diagram. This colorful PPT slide may be used for educational training. You can use this design for data analysis in business presentations


 Continue with Email

 Home
Home


