data analytics
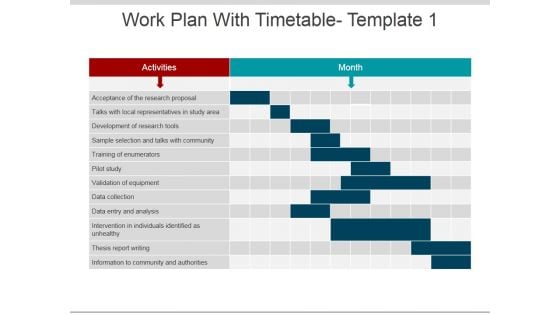
Work Plan With Timetable Template 1 Ppt PowerPoint Presentation Layouts Example File
This is a work plan with timetable template 1 ppt powerpoint presentation layouts example file. This is a two stage process. The stages in this process are activities, month, thesis report writing, data collection, pilot study.
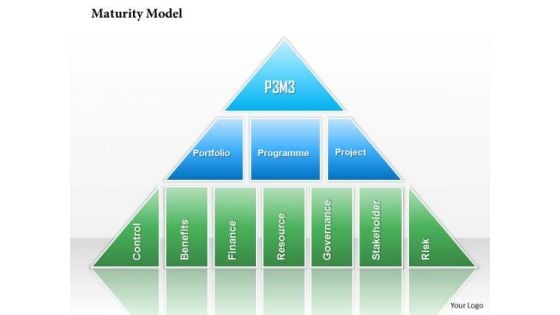
Business Framework Maturity Model PowerPoint Presentation
Graphic of CMM is used to design this business framework power point template. This PPT contains the maturity model for analysis based on the data collected from organization. Use this PPT and create a curve for analysis.
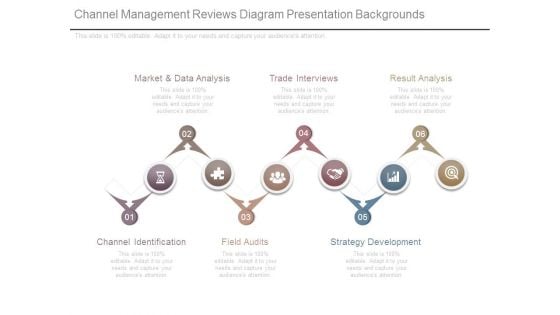
Channel Management Reviews Diagram Presentation Backgrounds
This is a channel management reviews diagram presentation backgrounds. This is a six stage process. The stages in this process are channel identification, market and data analysis, trade interviews, result analysis, strategy development, field audits.

Business Operations Strategy Model Ppt PowerPoint Presentation Complete Deck With Slides
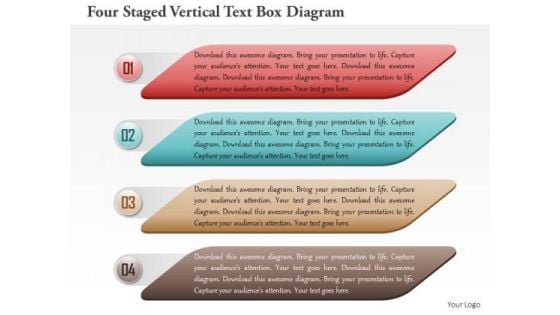
Business Diagram Four Staged Vertical Text Box Diagram Presentation Template
This PPT slide contains the concept of business data analysis. This Power Point template slide has been designed with graphic of four staged vertical text boxes diagram. Use this PPT slide and build an innovative presentation for your viewers.
Corporate Intelligence Model With Channel Assessment Ppt Icon Outline PDF
This is a corporate intelligence model with channel assessment ppt icon outline pdf template with various stages. Focus and dispense information on five stages using this creative set, that comes with editable features. It contains large content boxes to add your information on topics like strategic planning and direction, analysis and reporting, data collection, data gathering. You can also showcase facts, figures, and other relevant content using this PPT layout. Grab it now.
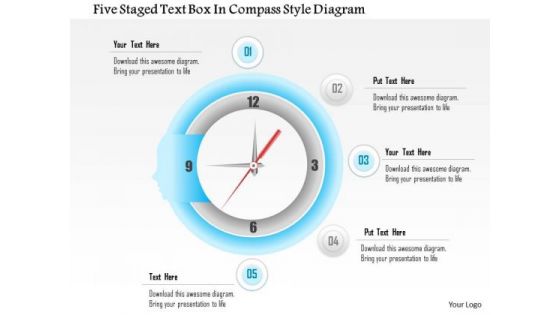
Business Diagram Five Staged Text Box In Compass Style Diagram Presentation Template
This Power Point template slide has been designed with graphic of five staged text boxes. This PPT slide contains the compass style diagram. This PPT slide can display data analysis. Use this PPT slide for your business presentations.

Business Diagram Seven Staged Circular Ribbon Text Box Diagram Presentation Template
This Power Point template slide has been used to display the concept of business data analysis. This PPT slide contains the graphic of seven staged circular ribbon style text boxes. Use this PPT slide for your business presentations.
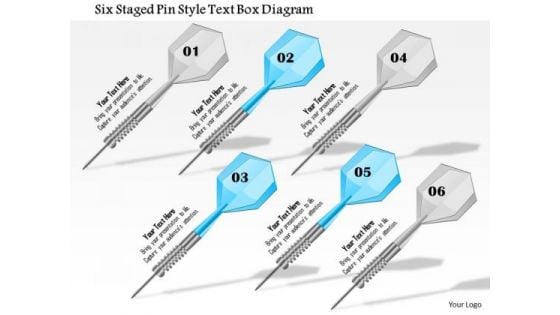
Business Diagram Six Staged Pin Style Text Box Diagram Presentation Template
This Power Point template slide has been crafted with graphic of six staged pin style text boxes. This PPT slide contain the concept of sales data analysis. Use this PPT slide for your business and sales related presentations.
Criteria Checklist Select Billing Enhancing Customer Service Operations Using CRM Technology Portrait Pdf
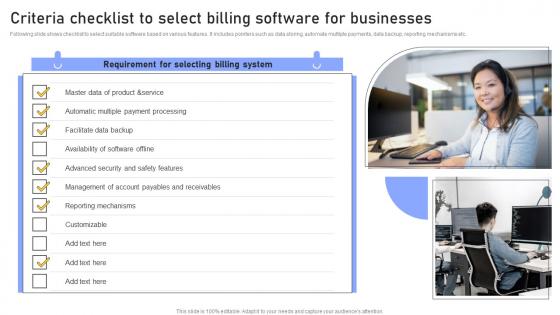
Following slide shows checklist to select suitable software based on various features. It includes pointers such as data storing, automate multiple payments, data backup, reporting mechanisms etc. From laying roadmaps to briefing everything in detail, our templates are perfect for you. You can set the stage with your presentation slides. All you have to do is download these easy to edit and customizable templates. Criteria Checklist Select Billing Enhancing Customer Service Operations Using CRM Technology Portrait Pdf will help you deliver an outstanding performance that everyone would remember and praise you for. Do download this presentation today. Following slide shows checklist to select suitable software based on various features. It includes pointers such as data storing, automate multiple payments, data backup, reporting mechanisms etc.
Optimizing Educational Technology Example Of Ppt
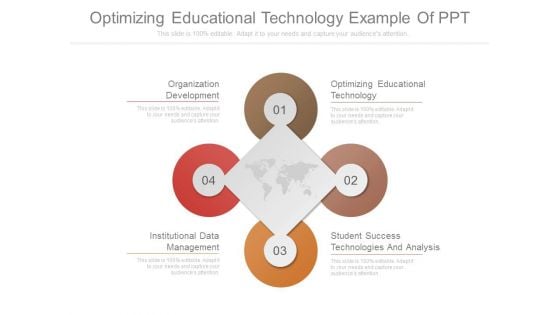
This is a optimizing educational technology example of ppt. This is a four stage process. The stages in this process are organization development, institutional data management, student success technologies and analysis, optimizing educational technology.
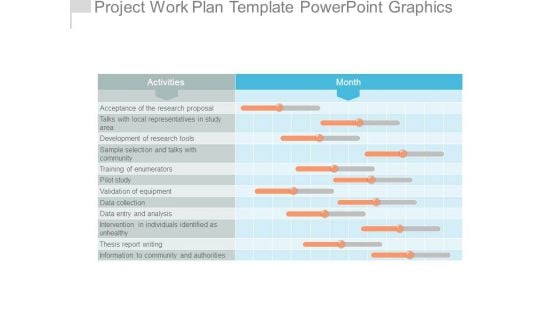
Project Work Plan Template Powerpoint Graphics
This is a project work plan template powerpoint graphics. This is a twelve stage process. The stages in this process are acceptance of the research proposal, talks with local representatives in study area, development of research tools, sample selection and talks with community, training of enumerators, pilot study, validation of equipment, data collection, data entry and analysis, intervention in individuals identified as unhealthy, thesis report writing, information to community and authorities.
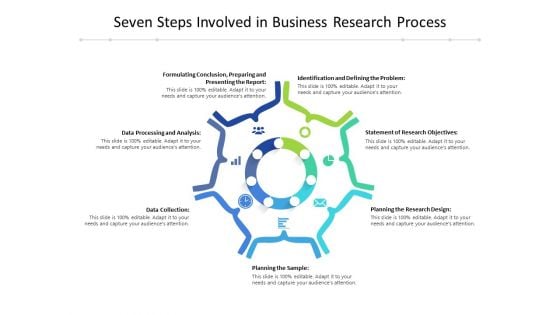
Seven Steps Involved In Business Research Process Ppt PowerPoint Presentation Ideas Pictures PDF
Presenting seven steps involved in business research process ppt powerpoint presentation ideas pictures pdf to dispense important information. This template comprises seven stages. It also presents valuable insights into the topics including identification and defining the problem, statement of research objectives, planning the research design, data collection, planning the sample, data processing and analysis, formulating conclusion, preparing and presenting the report. This is a completely customizable PowerPoint theme that can be put to use immediately. So, download it and address the topic impactfully.
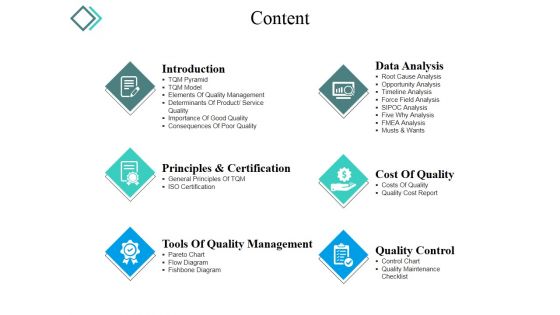
Content Ppt PowerPoint Presentation File Display
This is a content ppt powerpoint presentation file display. This is a six stage process. The stages in this process are introduction, data analysis, cost of quality, quality control.
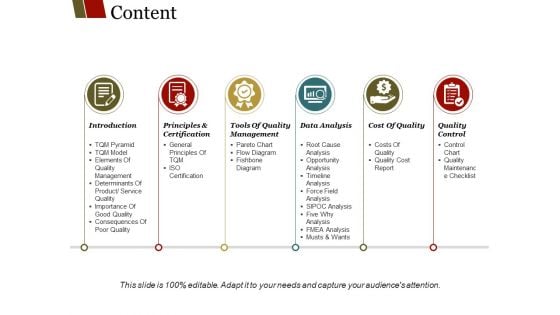
Content Ppt PowerPoint Presentation Show Slides
This is a content ppt powerpoint presentation show slides. This is a six stage process. The stages in this process are introduction, tools of quality management, data analysis, cost of quality, quality control.
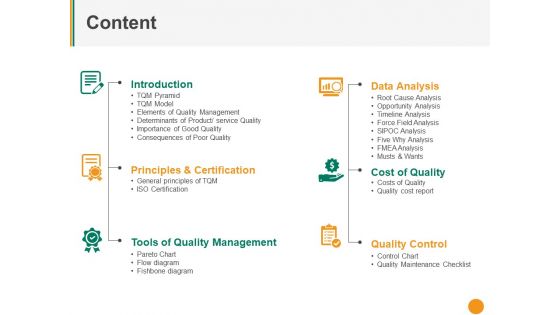
Content Ppt PowerPoint Presentation Layouts Elements
This is a content ppt powerpoint presentation layouts elements. This is a six stage process. The stages in this process are introduction, data analysis, cost of quality, quality control, tools of quality management.
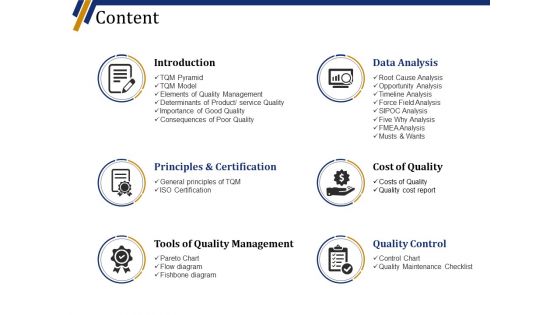
Content Ppt PowerPoint Presentation Pictures Background
This is a content ppt powerpoint presentation pictures background. This is a six stage process. The stages in this process are introduction, principles and certification, tools of quality management, data analysis, cost of quality, quality control.
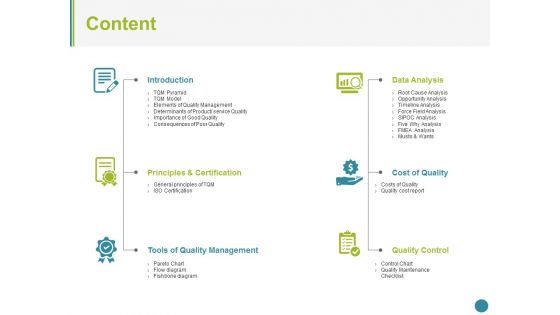
Content Ppt PowerPoint Presentation Inspiration Microsoft
This is a Content Ppt PowerPoint Presentation Inspiration Microsoft. This is a six stage process. The stages in this process are introduction, principles and certification, tools of quality management, data analysis, cost of quality, quality control.
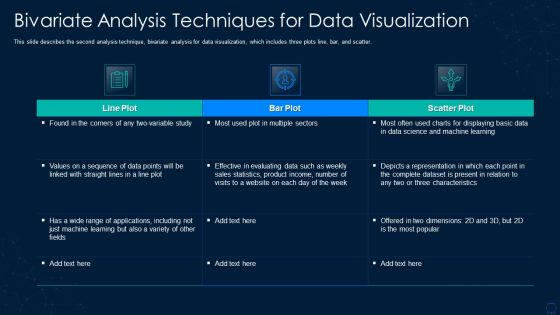
Graphical Representation Of Research IT Bivariate Analysis Techniques Formats PDF
This slide describes the second analysis technique, bivariate analysis for data visualization, which includes three plots line, bar, and scatter. Deliver and pitch your topic in the best possible manner with this graphical representation of research it bivariate analysis techniques formats pdf. Use them to share invaluable insights on bivariate analysis techniques for data visualization and impress your audience. This template can be altered and modified as per your expectations. So, grab it now.
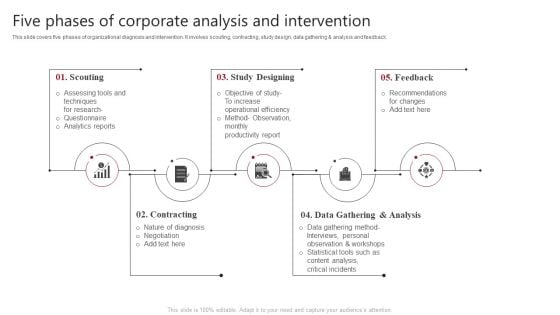
Five Phases Of Corporate Analysis And Intervention Clipart PDF
This slide covers five phases of organizational diagnosis and intervention. It involves scouting, contracting, study design, data gathering and analysis and feedback. Presenting Five Phases Of Corporate Analysis And Intervention Clipart PDF to dispense important information. This template comprises five stages. It also presents valuable insights into the topics including Contracting, Data Gathering, Analysis. This is a completely customizable PowerPoint theme that can be put to use immediately. So, download it and address the topic impactfully.
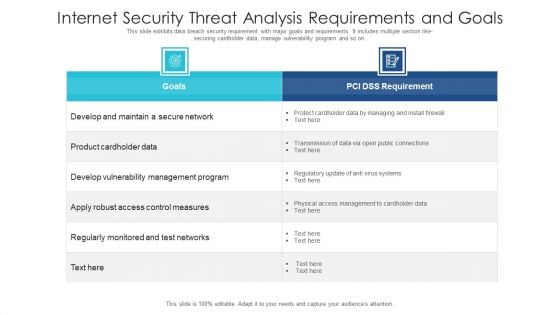
Internet Security Threat Analysis Requirements And Goals Ideas PDF
This slide exhibits data breach security requirement with major goals and requirements. It includes multiple section like- securing cardholder data, manage vulnerability program and so on. Showcasing this set of slides titled internet security threat analysis requirements and goals ideas pdf. The topics addressed in these templates are internet security threat analysis requirements and goals. All the content presented in this PPT design is completely editable. Download it and make adjustments in color, background, font etc. as per your unique business setting.
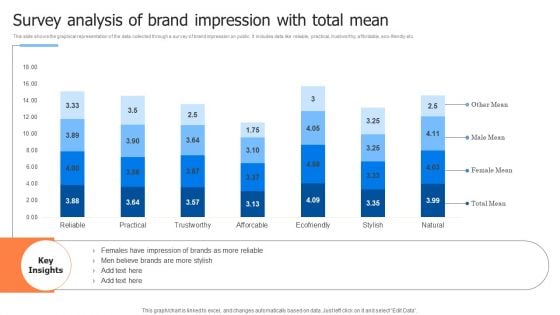
Survey Analysis Of Brand Impression With Total Mean Template PDF
This slide shows the graphical representation of the data collected through a survey of brand impression on public. It includes data like reliable, practical, trustworthy, affordable, eco friendly etc. Showcasing this set of slides titled Survey Analysis Of Brand Impression With Total Mean Template PDF. The topics addressed in these templates are Brand Impression, Survey Analysis. All the content presented in this PPT design is completely editable. Download it and make adjustments in color, background, font etc. as per your unique business setting.
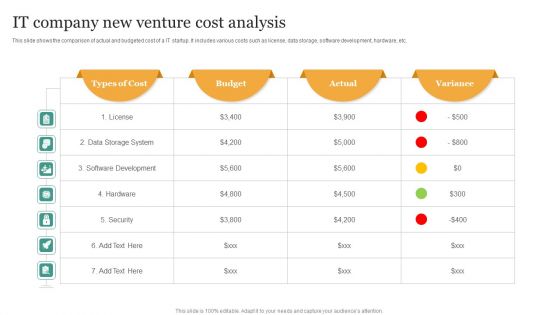
IT Company New Venture Cost Analysis Ideas PDF
This slide shows the comparison of actual and budgeted cost of a IT startup. It includes various costs such as license, data storage, software development, hardware, etc. Showcasing this set of slides titled IT Company New Venture Cost Analysis Ideas PDF. The topics addressed in these templates are Data Storage System, Software Development, Budget. All the content presented in this PPT design is completely editable. Download it and make adjustments in color, background, font etc. as per your unique business setting.

Seed Funding Ppt PowerPoint Presentation Complete Deck With Slides
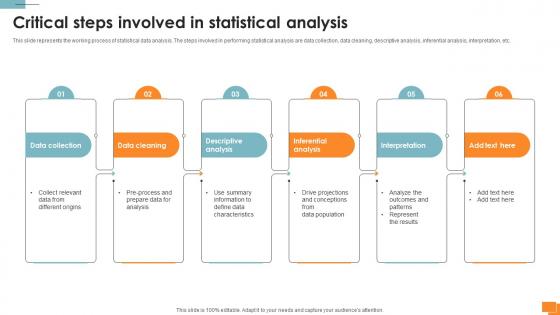
Statistical Tools For Evidence Critical Steps Involved In Statistical Analysis
This slide represents the working process of statistical data analysis. The steps involved in performing statistical analysis are data collection, data cleaning, descriptive analysis, inferential analysis, interpretation, etc. If you are looking for a format to display your unique thoughts, then the professionally designed Statistical Tools For Evidence Critical Steps Involved In Statistical Analysis is the one for you. You can use it as a Google Slides template or a PowerPoint template. Incorporate impressive visuals, symbols, images, and other charts. Modify or reorganize the text boxes as you desire. Experiment with shade schemes and font pairings. Alter, share or cooperate with other people on your work. Download Statistical Tools For Evidence Critical Steps Involved In Statistical Analysis and find out how to give a successful presentation. Present a perfect display to your team and make your presentation unforgettable. This slide represents the working process of statistical data analysis. The steps involved in performing statistical analysis are data collection, data cleaning, descriptive analysis, inferential analysis, interpretation, etc.
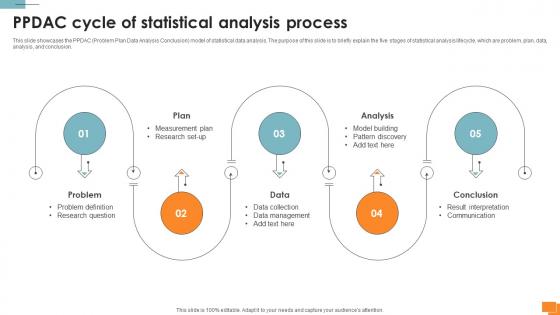
Statistical Tools For Evidence PPDAC Cycle Of Statistical Analysis Process
This slide showcases the PPDAC Problem Plan Data Analysis Conclusion model of statistical data analysis. The purpose of this slide is to briefly explain the five stages of statistical analysis lifecycle, which are problem, plan, data, analysis, and conclusion. Here you can discover an assortment of the finest PowerPoint and Google Slides templates. With these templates, you can create presentations for a variety of purposes while simultaneously providing your audience with an eye-catching visual experience. Download Statistical Tools For Evidence PPDAC Cycle Of Statistical Analysis Process to deliver an impeccable presentation. These templates will make your job of preparing presentations much quicker, yet still, maintain a high level of quality. Slidegeeks has experienced researchers who prepare these templates and write high-quality content for you. Later on, you can personalize the content by editing the Statistical Tools For Evidence PPDAC Cycle Of Statistical Analysis Process. This slide showcases the PPDAC Problem Plan Data Analysis Conclusion model of statistical data analysis. The purpose of this slide is to briefly explain the five stages of statistical analysis lifecycle, which are problem, plan, data, analysis, and conclusion.
Battery Icons For Business Growth Levels Powerpoint Template
Levels of business growth can be displayed with this diagram. This PowerPoint template contains graphics of seven battery icons. You can use this design for data analysis in business presentations

Overview Of Key Insights From Cyber Threat Statistics Themes PDF
This slide covers statistics based on cyber crime trends. It includes stats on data thefts, mobile securities, security skills, data breach cost, etc. Showcasing this set of slides titled Overview Of Key Insights From Cyber Threat Statistics Themes PDF. The topics addressed in these templates are Overview Of Key Insights, Cyber Threat Statistics . All the content presented in this PPT design is completely editable. Download it and make adjustments in color, background, font etc. as per your unique business setting.
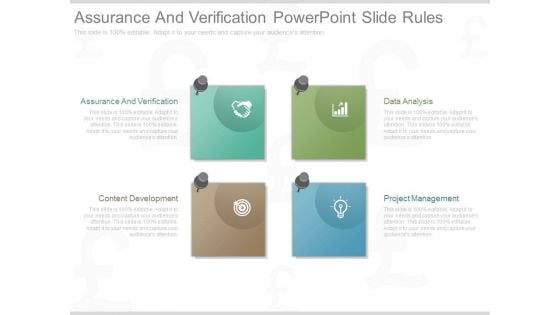
Assurance And Verification Powerpoint Slide Rules
This is a assurance and verification powerpoint slide rules. This is a four stage process. The stages in this process are assurance and verification, content development, data analysis, project management.
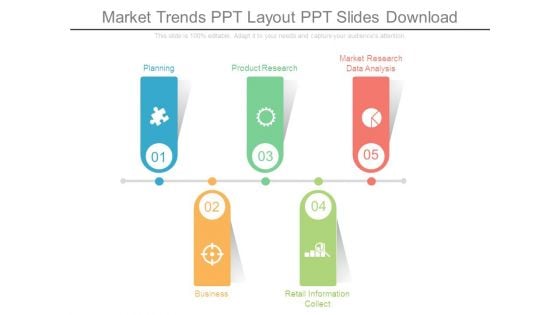
Market Trends Ppt Layout Ppt Slides Download
This is a market trends ppt layout ppt slides download. This is a five stage process. The stages in this process are planning, business, product research, retail information collect, market research data analysis.
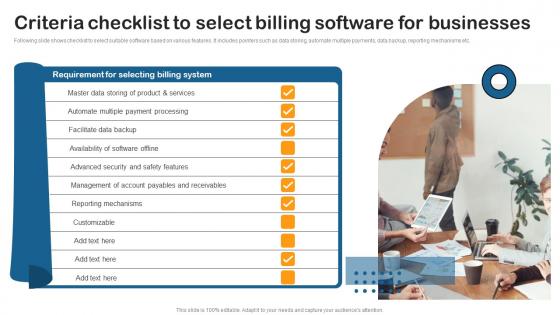
Criteria Checklist Select Billing Building Utility Billing And Invoicing Management System Download Pdf
Following slide shows checklist to select suitable software based on various features. It includes pointers such as data storing, automate multiple payments, data backup, reporting mechanisms etc. Slidegeeks is here to make your presentations a breeze with Criteria Checklist Select Billing Building Utility Billing And Invoicing Management System Download Pdf With our easy to use and customizable templates, you can focus on delivering your ideas rather than worrying about formatting. With a variety of designs to choose from, you are sure to find one that suits your needs. And with animations and unique photos, illustrations, and fonts, you can make your presentation pop. So whether you are giving a sales pitch or presenting to the board, make sure to check out Slidegeeks first Following slide shows checklist to select suitable software based on various features. It includes pointers such as data storing, automate multiple payments, data backup, reporting mechanisms etc.
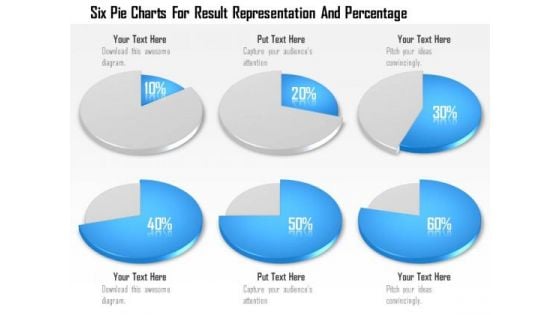
Business Diagram Six Pie Charts For Result Representation And Percentage Presentation Template
Display the concept of result analysis in your business presentation. This PPT slide contains the graphic of six pie charts. Use this PPT slide for your business and marketing data related presentations.
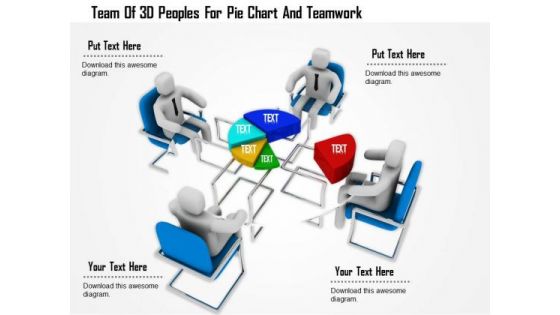
Team Of 3d Peoples For Pie Chart And Teamwork
This Power Point template has been designed with graphic of 3d team forming a pie chart. In this slide team is displaying data analysis. Use this editable slide to build innovative presentation for your viewers.
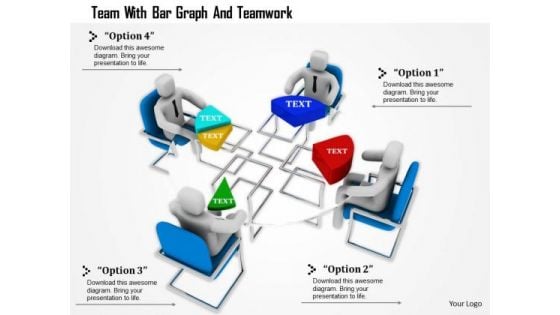
Team With Bar Graph And Teamwork
This Power Point template has been designed with graphic of 3d team forming a pie chart. In this slide team is displaying data analysis and comparison. Use this editable slide to build innovative presentation for your viewers.
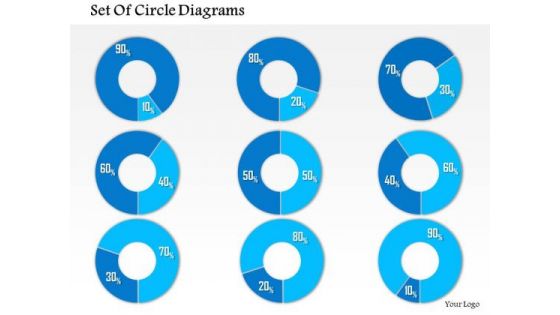
Business Framework 10 Percent To 90 Percent PowerPoint Presentation
This business diagram has been designed with graphic of multiple pie graphs. This diagram slide contains the concept of result analysis with percentage values. Use this diagram to present and compare data in an impressive manner
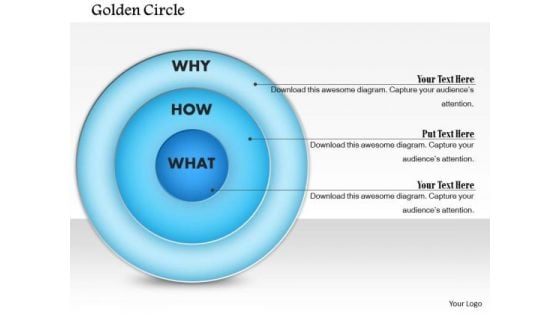
Business Framework Golden Circle PowerPoint Presentation
This business diagram has been designed with graphic of blue colored circle. This business slide is suitable to display data analysis in any business presentation. Use this slide to build a unique presentations for your viewers
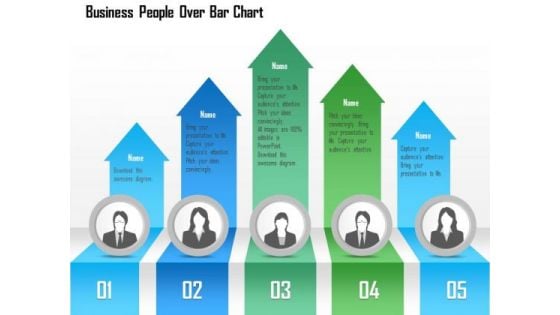
Business Diagram Business People Over Bar Chart PowerPoint Template
This Power Point template has been designed with graphic of business people and bar chart. This PPT contains the concept of result analysis and business data display. Use this PPT slide for your business and marketing related presentations.
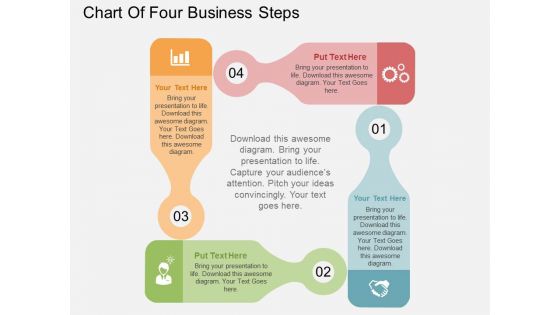
Chart Of Four Business Steps Powerpoint Templates
This business diagram displays flow of four business steps. This editable slide is suitable to present growth management. Use this diagram for business and finance related topics and display complete data analysis in your presentation.
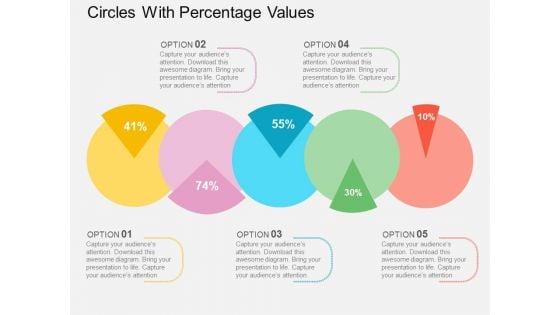
Circles With Percentage Values Powerpoint Templates
This PowerPoint template displays circles with percentage values. This business diagram is suitable for financial data analysis. Use this business diagram slide to highlight the key issues of your presentation.
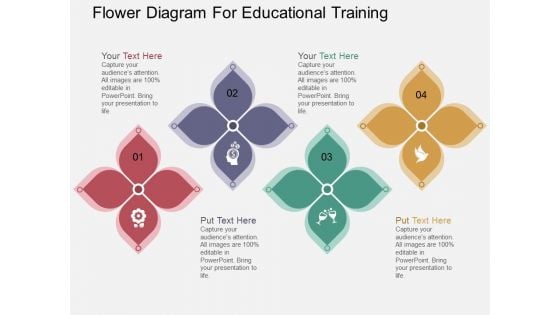
Flower Diagram For Educational Training Powerpoint Template
Colorful flowers have been used to design this PowerPoint diagram. This colorful PPT slide may be used for educational training. You can use this design for data analysis in business presentations
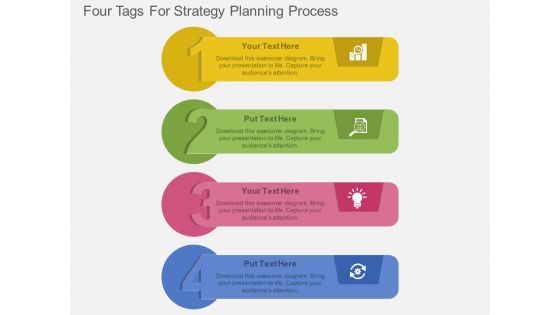
Four Tags For Strategy Planning Process Powerpoint Template
Steps for strategy planning can be explained with this diagram. This PowerPoint template contains diagram of four infographic tags. You can also use this design for data analysis in business presentations
Six Staged Infographics Square With Business Icons Powerpoint Templates
This business diagram displays circular puzzle infographic. This editable slide is suitable to present global communication. Use this diagram for business and finance related topics and display complete data analysis in your presentation.
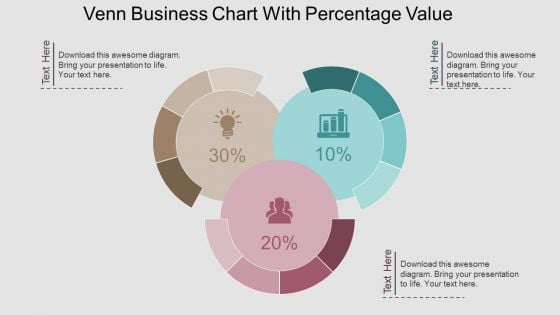
Venn Business Chart With Percentage Value Powerpoint Template
This PPT slide contains Venn business chart with percentage values. This PPT diagram is suitable to present data comparison and analysis. Enlighten others on the process with this innovative PowerPoint template.
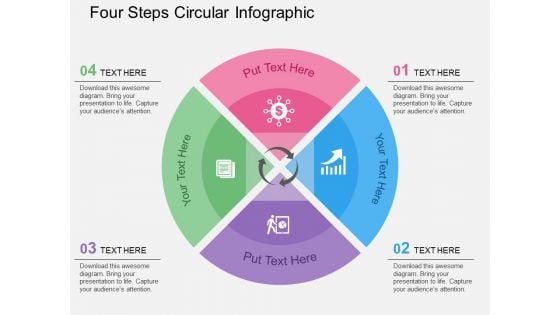
Four Steps Circular Infographic Powerpoint Templates
Our above slide contains diagram of three stage circular infographic. It helps to display global business analysis. Use this diagram to impart more clarity to data and to create more sound impact on viewers.
Four Circles Venn Diagram With Icons Powerpoint Slides
Four circles Venn diagram has been used to design this power point template. This PPT helps to portray the concept of business data analysis. Use this PPT for your business and marketing related presentations.
Two Circles Venn Diagram With Icons Powerpoint Slides
Venn diagram of two circles has been used to design this power point template. This PPT helps to portray the concept of business data analysis. Use this PPT for your business and marketing related presentations.
Curve Line Diagram With Icons Powerpoint Template
Our above slide contains diagram of curve line infographic. This infographic slide helps to exhibit business analysis. Use this diagram to impart more clarity to data and to create more sound impact on viewers.
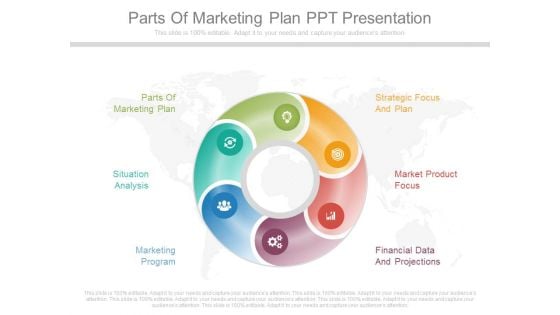
Parts Of Marketing Plan Ppt Presentation
This is a parts of marketing plan ppt presentation. This is a six stage process. The stages in this process are parts of marketing plan, strategic focus and plan, situation analysis, market product focus, marketing program, financial data and projections.
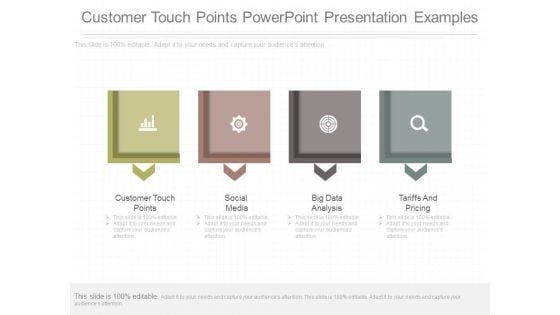
Customer Touch Points Powerpoint Presentation Examples
This is a customer touch points powerpoint presentation examples. This is a four stage process. The stages in this process are customer touch points, social media, big data analysis, tariffs and pricing.
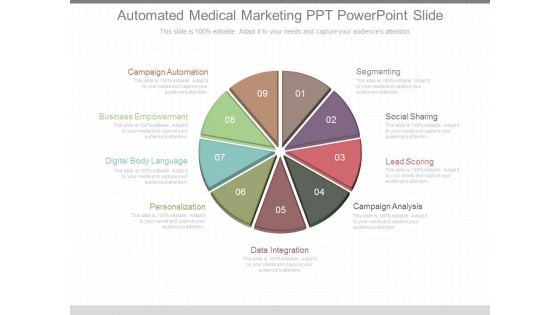
Automated Medical Marketing Ppt Powerpoint Slide
This is an automated medical marketing ppt powerpoint slide. This is a nine stage process. The stages in this process are campaign automation, segmenting, business empowerment, social sharing, lead scoring, lead scoring, digital body language, campaign analysis, data integration.
Key Elements Of Effective Ip Portfolio Management Powerpoint Ideas
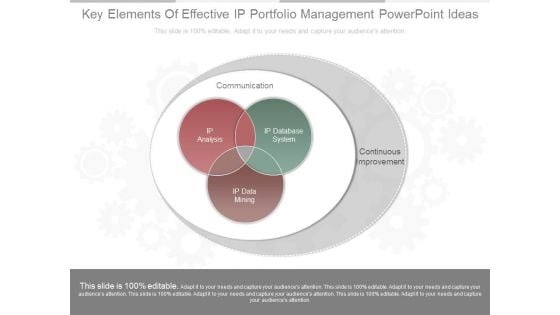
This is a key elements of effective ip portfolio management powerpoint ideas. This is a three stage process. The stages in this process are communication, continuous improvement, ip analysis, ip database system, ip data mining.
Channel Assessment Diagram Ppt Infographic Template
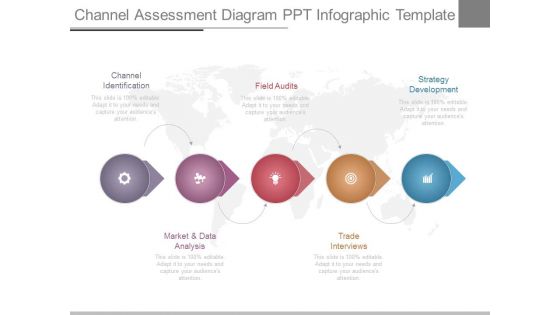
This is a channel assessment diagram ppt infographic template. This is a five stage process. The stages in this process are channel identification, market and data analysis, field audits, trade interviews, strategy development.
Channel And Market Intelligence Example Powerpoint Slide Designs
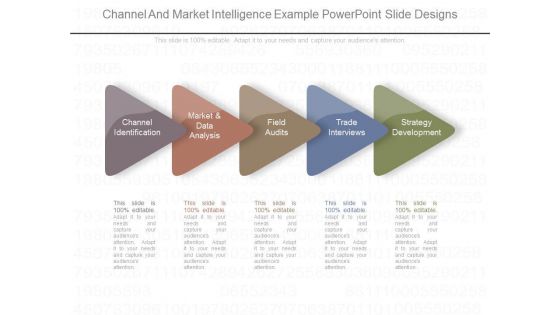
This is a channel and market intelligence example powerpoint slide designs. This is a five stage process. The stages in this process are channel identification, market and data analysis, field audits, trade interviews, strategy development.
Channel Strategy And Route To Market Ppt Powerpoint Guide
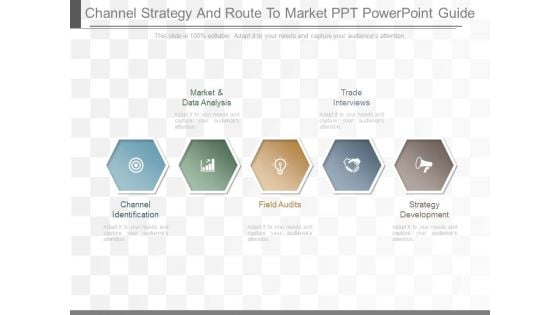
This is a channel strategy and route to market ppt powerpoint guide. This is a five stage process. The stages in this process are market and data analysis, trade interviews, channel identification, field audits, strategy development.
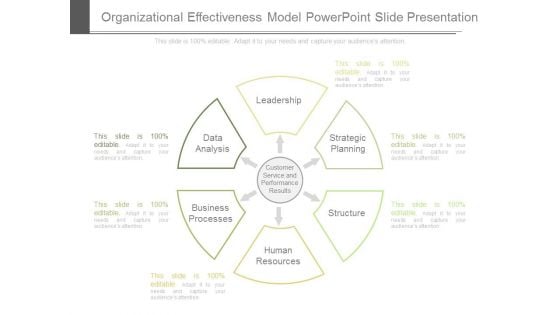
Organizational Effectiveness Model Powerpoint Slide Presentation
This is a organizational effectiveness model powerpoint slide presentation. This is a six stage process. The stages in this process are leadership, strategic planning, structure, human resources, business processes, data analysis, customer service and performance results.
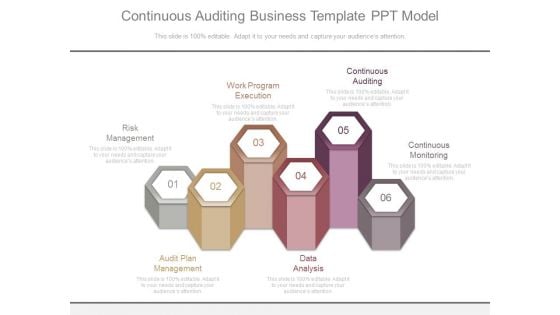
Continuous Auditing Business Template Ppt Model
This is a continuous auditing business template ppt model. This is a six stage process. The stages in this process are risk management, work program execution, continuous auditing, audit plan management, data analysis, continuous monitoring.
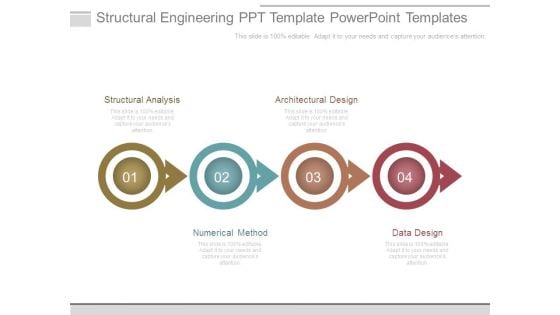
Structural Engineering Ppt Template Powerpoint Templates
This is a structural engineering ppt template powerpoint templates. This is a four stage process. The stages in this process are structural analysis, architectural design, numerical method, data design.
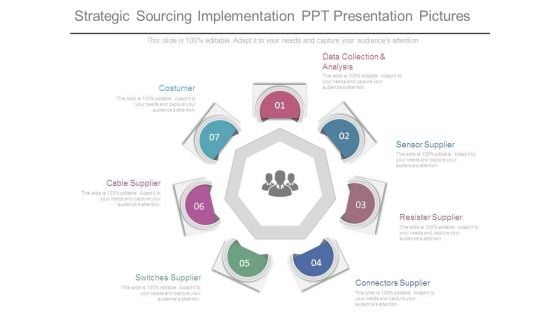
Strategic Sourcing Implementation Ppt Presentation Pictures
This is a strategic sourcing implementation ppt presentation pictures. This is a seven stage process. The stages in this process are data collection and analysis, sensor supplier, resister supplier, connectors supplier, switches supplier, cable supplier, costumer.
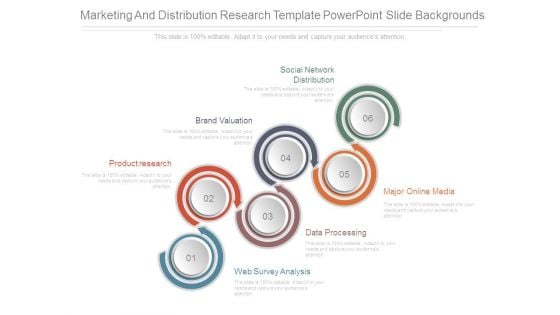
Marketing And Distribution Research Template Powerpoint Slide Backgrounds
This is a marketing and distribution research template powerpoint slide backgrounds. This is a six stage process. The stages in this process are product research, brand valuation, social network distribution, major online media, data processing, web survey analysis.
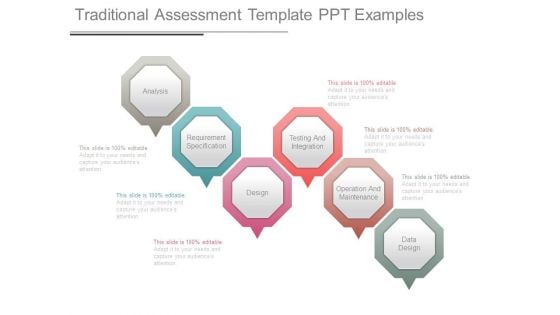
Traditional Assessment Template Ppt Examples
This is a traditional assessment template ppt examples. This is a six stage process. The stages in this process are analysis, requirement specification, design, testing and integration, operation and maintenance, data design.


 Continue with Email

 Home
Home


