data analytics
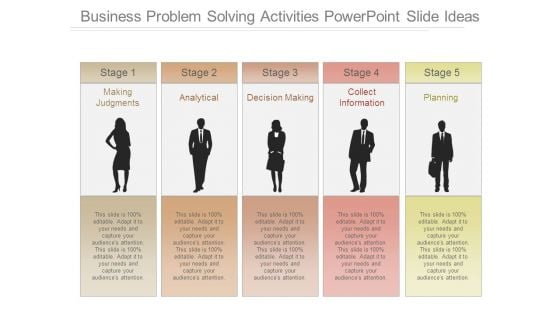
Business Problem Solving Activities Powerpoint Slide Ideas
This is a business problem solving activities powerpoint slide ideas. This is a five stage process. The stages in this process are making judgments, analytical, decision making, collect information, planning.
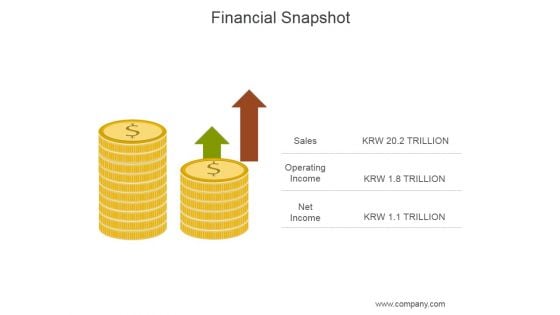
Financial Snapshot Ppt PowerPoint Presentation Layouts
This is a financial snapshot ppt powerpoint presentation layouts. This is a two stage process. The stages in this process are sales, operating income, net income.
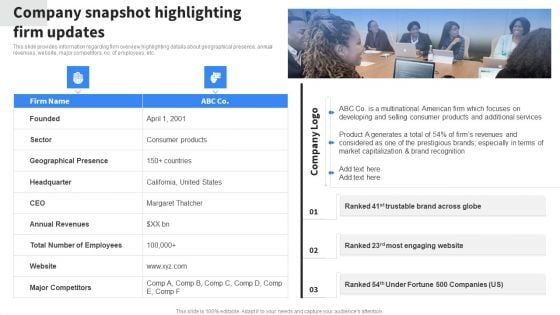
Company Snapshot Highlighting Firm Updates Demonstration PDF
This slide provides information regarding firm overview highlighting details about geographical presence, annual revenues, website, major competitors, no. of employees, etc. From laying roadmaps to briefing everything in detail, our templates are perfect for you. You can set the stage with your presentation slides. All you have to do is download these easy to edit and customizable templates. Company Snapshot Highlighting Firm Updates Demonstration PDF will help you deliver an outstanding performance that everyone would remember and praise you for. Do download this presentation today.
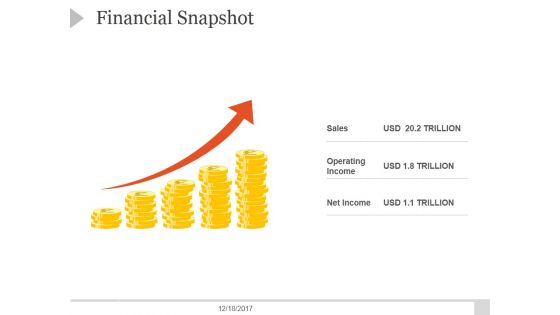
Financial Snapshot Ppt PowerPoint Presentation Samples
This is a financial snapshot ppt powerpoint presentation samples. This is a five stage process. The stages in this process are sales, operating income, net income.
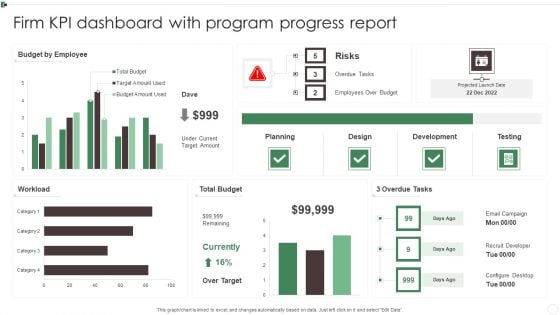
Firm KPI Dashboard With Program Progress Report Ppt Pictures Deck PDF
This graph or chart is linked to excel, and changes automatically based on data. Just left click on it and select Edit Data. Showcasing this set of slides titled Firm KPI Dashboard With Program Progress Report Ppt Pictures Deck PDF. The topics addressed in these templates are Budget By Employee, Total Budget, 3 Overdue Tasks, Workload. All the content presented in this PPT design is completely editable. Download it and make adjustments in color, background, font etc. as per your unique business setting.
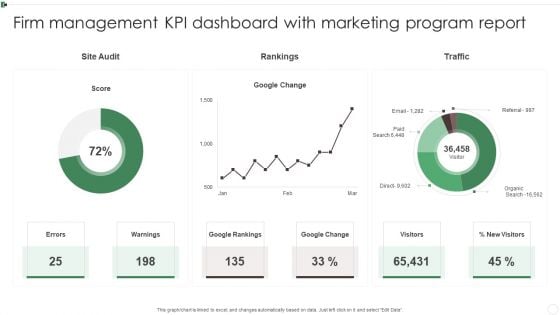
Firm Management KPI Dashboard With Marketing Program Report Ppt Styles Introduction PDF
This graph or chart is linked to excel, and changes automatically based on data. Just left click on it and select Edit Data. Showcasing this set of slides titled Firm Management KPI Dashboard With Marketing Program Report Ppt Styles Introduction PDF. The topics addressed in these templates are Google Rankings, Google Change, Warnings, Visitors. All the content presented in this PPT design is completely editable. Download it and make adjustments in color, background, font etc. as per your unique business setting.
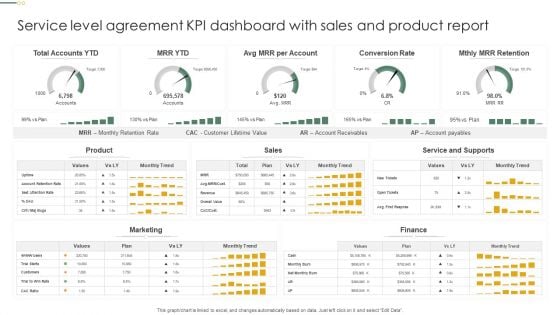
Service Level Agreement KPI Dashboard With Sales And Product Report Clipart PDF
This graph or chart is linked to excel, and changes automatically based on data. Just left click on it and select Edit Data. Showcasing this set of slides titled Service Level Agreement KPI Dashboard With Sales And Product Report Clipart PDF. The topics addressed in these templates are Total Accounts YTD, Conversion Rate, Mthly MRR Retention. All the content presented in this PPT design is completely editable. Download it and make adjustments in color, background, font etc. as per your unique business setting.

Statistical Tools For Evidence Before Vs After Performing Statistical Analysis
This slide shows the before vs. after comparison of statistical analysis of business data. The different aspects compared in this slide are decision-making, operational efficiency, customer insights, product quality, revenue generation, supply chain efficiency, etc. Get a simple yet stunning designed Statistical Tools For Evidence Before Vs After Performing Statistical Analysis. It is the best one to establish the tone in your meetings. It is an excellent way to make your presentations highly effective. So, download this PPT today from Slidegeeks and see the positive impacts. Our easy-to-edit Statistical Tools For Evidence Before Vs After Performing Statistical Analysis can be your go-to option for all upcoming conferences and meetings. So, what are you waiting for Grab this template today. This slide shows the before vs. after comparison of statistical analysis of business data. The different aspects compared in this slide are decision-making, operational efficiency, customer insights, product quality, revenue generation, supply chain efficiency, etc.
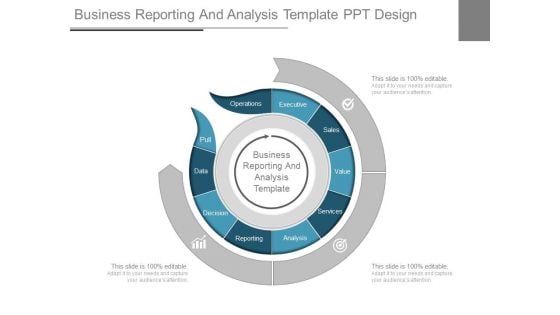
Business Reporting And Analysis Template Ppt Design
This is a business reporting and analysis template ppt design. This is a three stage process. The stages in this process are business reporting and analysis template, operations, executive, sales, value, services, analysis, reporting, decision, data, pull.
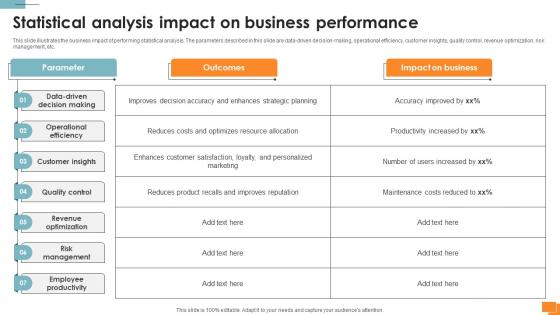
Statistical Tools For Evidence Statistical Analysis Impact On Business Performance
This slide illustrates the business impact of performing statistical analysis. The parameters described in this slide are data-driven decision-making, operational efficiency, customer insights, quality control, revenue optimization, risk management, etc. Do you know about Slidesgeeks Statistical Tools For Evidence Statistical Analysis Impact On Business Performance These are perfect for delivering any kind od presentation. Using it, create PowerPoint presentations that communicate your ideas and engage audiences. Save time and effort by using our pre-designed presentation templates that are perfect for a wide range of topic. Our vast selection of designs covers a range of styles, from creative to business, and are all highly customizable and easy to edit. Download as a PowerPoint template or use them as Google Slides themes. This slide illustrates the business impact of performing statistical analysis. The parameters described in this slide are data-driven decision-making, operational efficiency, customer insights, quality control, revenue optimization, risk management, etc.
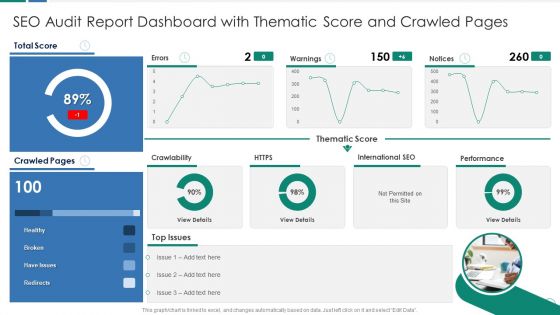
SEO Audit Report Dashboard With Thematic Score And Crawled Pages Download PDF
This graph or chart is linked to excel, and changes automatically based on data. Just left click on it and select Edit Data. Deliver and pitch your topic in the best possible manner with this SEO Audit Report Dashboard With Thematic Score And Crawled Pages Download PDF. Use them to share invaluable insights on Thematic Score Warnings, International SEO Performance, Total Score Healthy and impress your audience. This template can be altered and modified as per your expectations. So, grab it now.
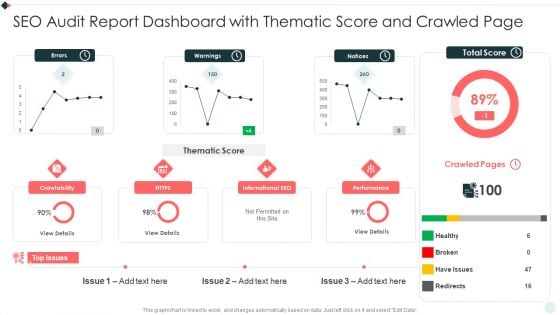
SEO Audit Summary To Increase SEO Audit Report Dashboard With Thematic Score Download PDF
This graph or chart is linked to excel, and changes automatically based on data. Just left click on it and select Edit Data. Deliver an awe inspiring pitch with this creative SEO Audit Summary To Increase SEO Audit Report Dashboard With Thematic Score Download PDF bundle. Topics like Total Score, Crawled Pages, Top Issues can be discussed with this completely editable template. It is available for immediate download depending on the needs and requirements of the user.
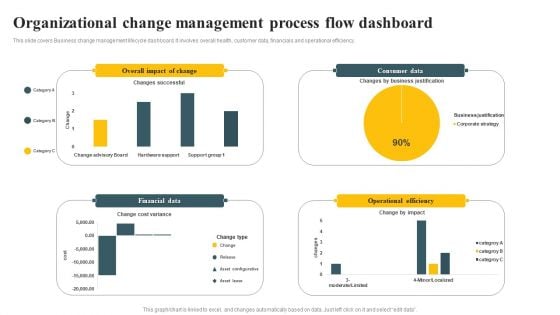
Organizational Change Management Process Flow Dashboard Ppt PowerPoint Presentation Diagram PDF
This slide covers Business change management lifecycle dashboard. It involves overall health, customer data, financials and operational efficiency. Pitch your topic with ease and precision using this Organizational Change Management Process Flow Dashboard Ppt PowerPoint Presentation Diagram PDF. This layout presents information on Financial Data, Operational Efficiency, Consumer Data. It is also available for immediate download and adjustment. So, changes can be made in the color, design, graphics or any other component to create a unique layout.
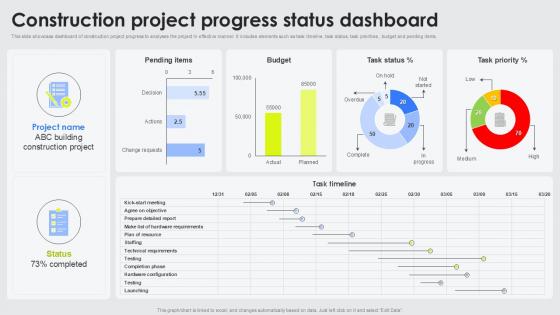
Construction Project Progress Status Dashboard
Create an editable Construction Project Progress Status Dashboard that communicates your idea and engages your audience. Whether you are presenting a business or an educational presentation, pre-designed presentation templates help save time. Construction Project Progress Status Dashboard is highly customizable and very easy to edit, covering many different styles from creative to business presentations. Slidegeeks has creative team members who have crafted amazing templates. So, go and get them without any delay. Our construction project progress status dashboard PowerPoint template covers detailed and efficient tool to analyze project performance. This slide showcases a comprehensive dashboard that includes details such as task timelines, task status, priorities, budget details,etc. It allows project managers and construction teams to effectively track and manage project milestones. This deck helps stakeholders to make informed decisions and effectively monitor progress. Improve your project presentations with our SEO-friendly and visually appealing progress tracking dashboard.
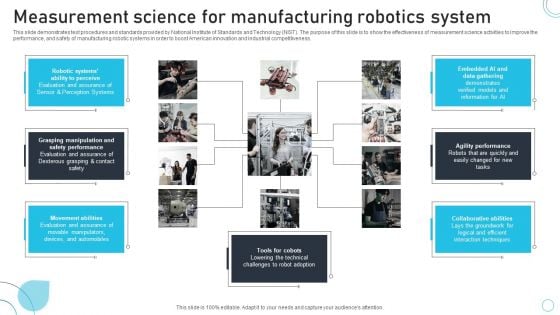
Industrial Robots System Measurement Science For Manufacturing Robotics System Template PDF
This slide demonstrates test procedures and standards provided by National Institute of Standards and Technology NIST. The purpose of this slide is to show the effectiveness of measurement science activities to improve the performance, and safety of manufacturing robotic systems in order to boost American innovation and industrial competitiveness. The Industrial Robots System Measurement Science For Manufacturing Robotics System Template PDF is a compilation of the most recent design trends as a series of slides. It is suitable for any subject or industry presentation, containing attractive visuals and photo spots for businesses to clearly express their messages. This template contains a variety of slides for the user to input data, such as structures to contrast two elements, bullet points, and slides for written information. Slidegeeks is prepared to create an impression.
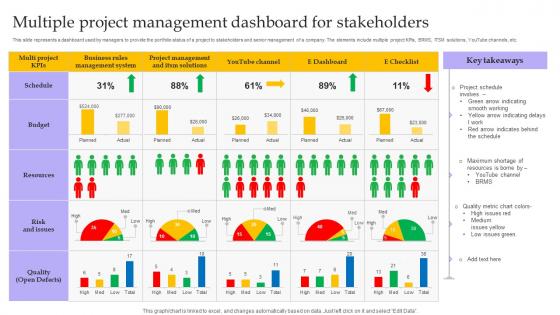
Multiple Project Management Dashboard For Stakeholders Portrait Pdf
This slide represents a dashboard used by managers to provide the portfolio status of a project to stakeholders and senior management of a company. The elements include multiple project KPIs, BRMS, ITSM solutions, YouTube channels, etc. Pitch your topic with ease and precision using this Multiple Project Management Dashboard For Stakeholders Portrait Pdf. This layout presents information on Multiple Project Management, Dashboard For Stakeholders, Youtube Channels. It is also available for immediate download and adjustment. So, changes can be made in the color, design, graphics or any other component to create a unique layout. This slide represents a dashboard used by managers to provide the portfolio status of a project to stakeholders and senior management of a company. The elements include multiple project KPIs, BRMS, ITSM solutions, YouTube channels, etc.
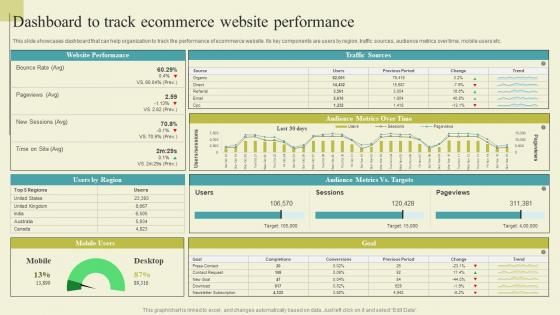
Successful Guide For Ecommerce Promotion Dashboard To Track Ecommerce Website Download Pdf
This slide showcases dashboard that can help organization to track the performance of ecommerce website. Its key components are users by region, traffic sources, audience metrics over time, mobile users etc. If you are looking for a format to display your unique thoughts, then the professionally designed Successful Guide For Ecommerce Promotion Dashboard To Track Ecommerce Website Download Pdf is the one for you. You can use it as a Google Slides template or a PowerPoint template. Incorporate impressive visuals, symbols, images, and other charts. Modify or reorganize the text boxes as you desire. Experiment with shade schemes and font pairings. Alter, share or cooperate with other people on your work. Download Successful Guide For Ecommerce Promotion Dashboard To Track Ecommerce Website Download Pdf and find out how to give a successful presentation. Present a perfect display to your team and make your presentation unforgettable. This slide showcases dashboard that can help organization to track the performance of ecommerce website. Its key components are users by region, traffic sources, audience metrics over time, mobile users etc.
Cybersecurity Risk Assessment Program Dashboard For Tracking Cyber Attack Risk Levels
Explore a selection of the finest Cybersecurity Risk Assessment Program Dashboard For Tracking Cyber Attack Risk Levels here. With a plethora of professionally designed and pre-made slide templates, you can quickly and easily find the right one for your upcoming presentation. You can use our Cybersecurity Risk Assessment Program Dashboard For Tracking Cyber Attack Risk Levels to effectively convey your message to a wider audience. Slidegeeks has done a lot of research before preparing these presentation templates. The content can be personalized and the slides are highly editable. Grab templates today from Slidegeeks. This slide represents Cybersecurity Risk Assessment Program Dashboard to effectively track cyber security risk levels. This will provide a structured approach for organizations to review and mitigate cyber threats. It includes multiple threat agents, attack methods, and preventive controls implemented with detailed insights, and it shows critical metrics including risk scores, the number of infected systems, and detected vulnerabilities.
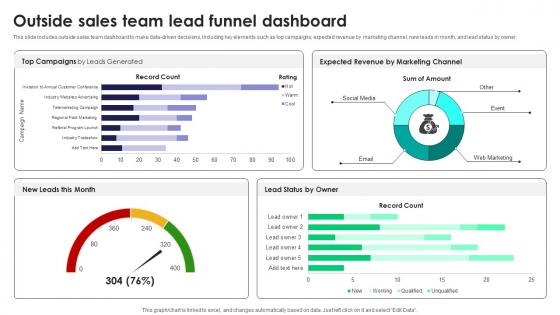
Outside Sales Team Lead Funnel Dashboard Tactics For Improving Field Sales Team SA SS V
This slide includes outside sales team dashboard to make data-driven decisions, including key elements such as top campaigns, expected revenue by marketing channel, new leads in month, and lead status by owner.Retrieve professionally designed Outside Sales Team Lead Funnel Dashboard Tactics For Improving Field Sales Team SA SS V to effectively convey your message and captivate your listeners. Save time by selecting pre-made slideshows that are appropriate for various topics, from business to educational purposes. These themes come in many different styles, from creative to corporate, and all of them are easily adjustable and can be edited quickly. Access them as PowerPoint templates or as Google Slides themes. You do not have to go on a hunt for the perfect presentation because Slidegeeks got you covered from everywhere. This slide includes outside sales team dashboard to make data-driven decisions, including key elements such as top campaigns, expected revenue by marketing channel, new leads in month, and lead status by owner.

Summary Financial Accounting Statement Profit And Loss Analysis Dashboard Elements PDF
This graph or chart is linked to excel, and changes automatically based on data. Just left click on it and select Edit Data. Deliver an awe inspiring pitch with this creative Summary Financial Accounting Statement Profit And Loss Analysis Dashboard Elements PDF bundle. Topics like P And L Structure Dynamics, Dupont Rations, Debt Coverage Ratios, Creditworthiness Assessment can be discussed with this completely editable template. It is available for immediate download depending on the needs and requirements of the user.
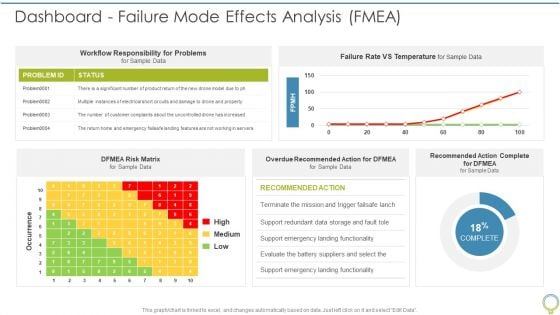
FMEA To Determine Potential Dashboard Failure Mode Effects Analysis FMEA Brochure PDF
This graph or chart is linked to excel, and changes automatically based on data. Just left click on it and select Edit Data. Deliver an awe inspiring pitch with this creative FMEA To Determine Potential Dashboard Failure Mode Effects Analysis FMEA Brochure PDF bundle. Topics like Workflow Responsibility, High Medium, Recommended Action can be discussed with this completely editable template. It is available for immediate download depending on the needs and requirements of the user.
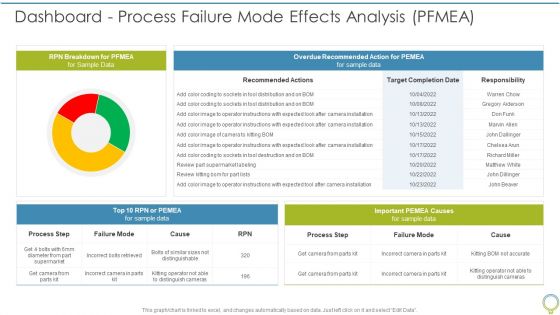
FMEA To Determine Potential Dashboard Process Failure Mode Effects Analysis PFMEA Elements PDF
This graph or chart is linked to excel, and changes automatically based on data. Just left click on it and select Edit Data. Deliver and pitch your topic in the best possible manner with this FMEA To Determine Potential Dashboard Process Failure Mode Effects Analysis PFMEA Elements PDF. Use them to share invaluable insights on RPN Breakdown, Overdue Recommended, Process Step and impress your audience. This template can be altered and modified as per your expectations. So, grab it now.
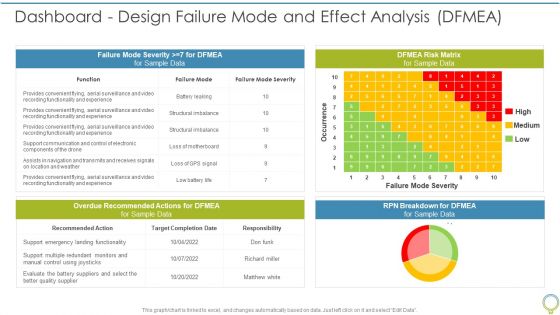
FMEA To Determine Potential Dashboard Design Failure Mode And Effect Analysis DFMEA Ppt Show Styles PDF
This graph or chart is linked to excel, and changes automatically based on data. Just left click on it and select Edit Data. Deliver an awe inspiring pitch with this creative FMEA To Determine Potential Dashboard Design Failure Mode And Effect Analysis DFMEA Ppt Show Styles PDF bundle. Topics like Target Completion, Recommended Action, RPN Breakdown can be discussed with this completely editable template. It is available for immediate download depending on the needs and requirements of the user.
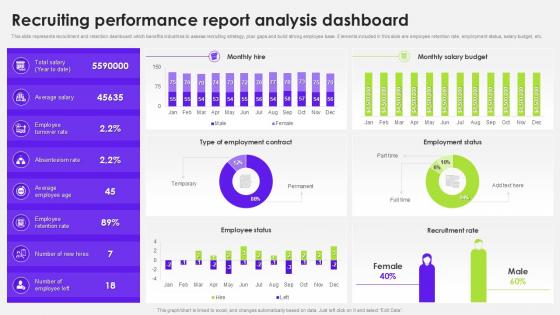
Recruiting Performance Report Analysis Dashboard
Welcome to our selection of the Recruiting Performance Report Analysis Dashboard. These are designed to help you showcase your creativity and bring your sphere to life. Planning and Innovation are essential for any business that is just starting out. This collection contains the designs that you need for your everyday presentations. All of our PowerPoints are 100Percent editable, so you can customize them to suit your needs. This multi-purpose template can be used in various situations. Grab these presentation templates today. This slide illustrates a recruitment and retention dashboard, which benefits industries by allowing them to assess recruiting strategy, plan gaps, and build a strong employee base. It includes employee retention rate, employment status, salary budget, etc.
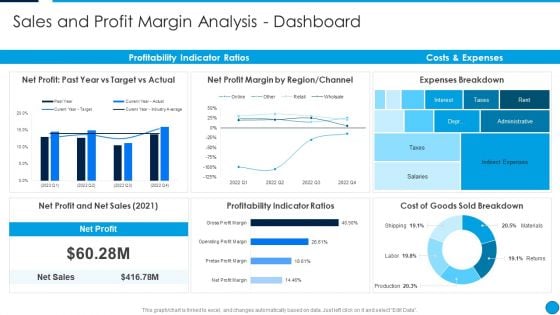
Summary Financial Sales And Profit Margin Analysis Dashboard Pictures PDF
This graph or chart is linked to excel, and changes automatically based on data. Just left click on it and select Edit Data. Deliver an awe inspiring pitch with this creative Summary Financial Sales And Profit Margin Analysis Dashboard Pictures PDF bundle. Topics like Net Profit, Past Year Vs Target Vs Actual, Net Profit Margin By Region, Channel, Expenses Breakdown, Costs And Expenses, Profitability Indicator Ratios can be discussed with this completely editable template. It is available for immediate download depending on the needs and requirements of the user.
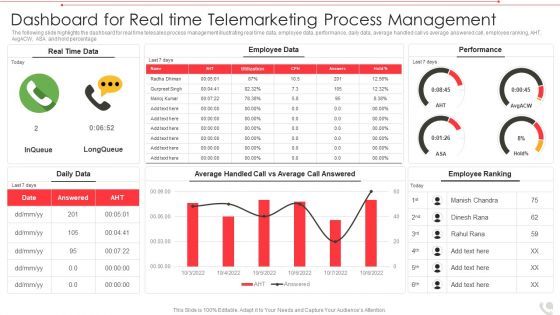
Dashboard For Real Time Telemarketing Process Management Themes PDF
The following slide highlights the dashboard for real time telesales process management illustrating real time data, employee data, performance, daily data, average handled call vs average answered call, employee ranking, AHT, AvgACW, ASA and hold percentage Showcasing this set of slides titled dashboard for real time telemarketing process management themes pdf The topics addressed in these templates are dashboard for real time telemarketing process management All the content presented in this PPT design is completely editable. Download it and make adjustments in color, background, font etc. as per your unique business setting.
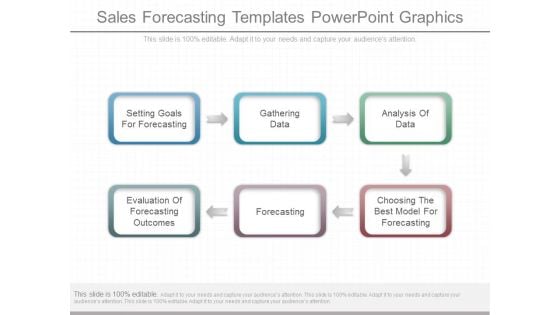
Sales Forecasting Templates Powerpoint Graphics
This is a sales forecasting templates powerpoint graphics. This is a six stage process. The stages in this process are setting goals for forecasting, gathering data, analysis of data, evaluation of forecasting outcomes, forecasting, choosing the best model for forecasting.
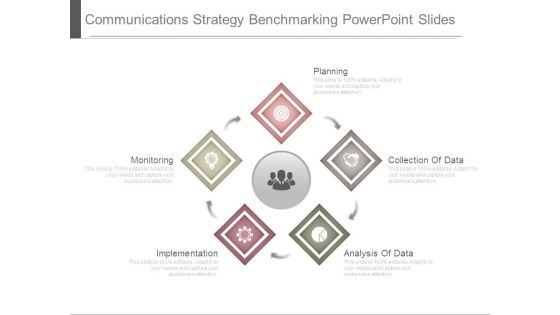
Communications Strategy Benchmarking Powerpoint Slides
This is a communications strategy benchmarking powerpoint slides. This is a five stage process. The stages in this process are planning, collection of data, analysis of data, implementation, monitoring.

Measuring Influencer Marketing ROI Influencer Marketing A Snapshot Formats PDF
Discover the rising popularity of a new form of marketing i.e. influencer marketing also called as influence marketing. This is a measuring influencer marketing roi influencer marketing a snapshot formats pdf template with various stages. Focus and dispense information on one stage using this creative set, that comes with editable features. It contains large content boxes to add your information on topics like influencer marketing, social media marketing, brand awareness. You can also showcase facts, figures, and other relevant content using this PPT layout. Grab it now.
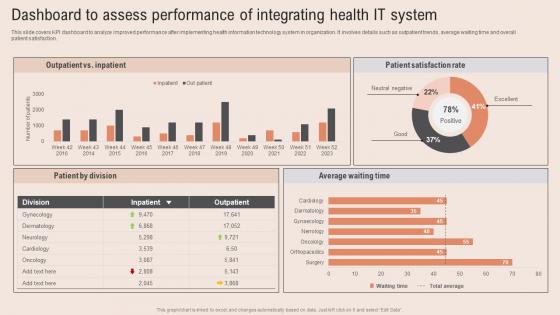
Dashboard Assess Performance Healthcare Information Tech To Enhance Medical Facilities Professional Pdf
This slide covers KPI dashboard to analyze improved performance after implementing health information technology system in organization. It involves details such as outpatient trends, average waiting time and overall patient satisfaction. Present like a pro with Dashboard Assess Performance Healthcare Information Tech To Enhance Medical Facilities Professional Pdf Create beautiful presentations together with your team, using our easy to use presentation slides. Share your ideas in real time and make changes on the fly by downloading our templates. So whether you are in the office, on the go, or in a remote location, you can stay in sync with your team and present your ideas with confidence. With Slidegeeks presentation got a whole lot easier. Grab these presentations today. This slide covers KPI dashboard to analyze improved performance after implementing health information technology system in organization. It involves details such as outpatient trends, average waiting time and overall patient satisfaction.
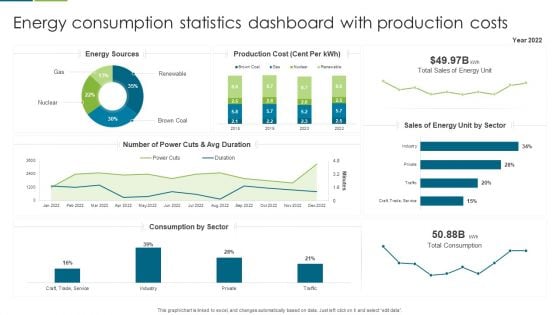
Energy Consumption Statistics Dashboard With Production Costs Slides PDF
This graph or chart is linked to excel, and changes automatically based on data. Just left click on it and select edit data. Showcasing this set of slides titled Energy Consumption Statistics Dashboard With Production Costs Slides PDF. The topics addressed in these templates are Production Cost, Sales Energy, Number Power. All the content presented in this PPT design is completely editable. Download it and make adjustments in color, background, font etc. as per your unique business setting.
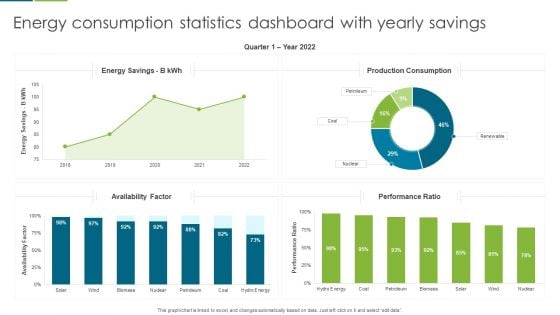
Energy Consumption Statistics Dashboard With Yearly Savings Guidelines PDF
This graph or chart is linked to excel, and changes automatically based on data. Just left click on it and select edit data. Showcasing this set of slides titled Energy Consumption Statistics Dashboard With Yearly Savings Guidelines PDF. The topics addressed in these templates are Production Consumption, Energy Savings, Performance Ratio. All the content presented in this PPT design is completely editable. Download it and make adjustments in color, background, font etc. as per your unique business setting.
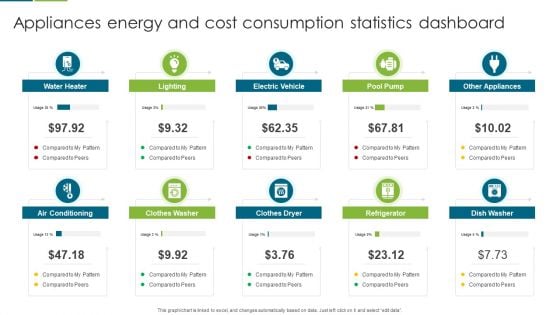
Appliances Energy And Cost Consumption Statistics Dashboard Download PDF
This graph or chart is linked to excel, and changes automatically based on data. Just left click on it and select edit data. Presenting Appliances Energy And Cost Consumption Statistics Dashboard Download PDF to dispense important information. This template comprises ten stages. It also presents valuable insights into the topics including Water Heater, Electric Vehicle, Pool Pump. This is a completely customizable PowerPoint theme that can be put to use immediately. So, download it and address the topic impactfully.
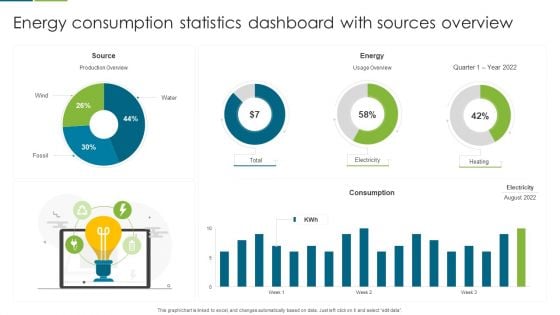
Energy Consumption Statistics Dashboard With Sources Overview Template PDF
This graph or chart is linked to excel, and changes automatically based on data. Just left click on it and select edit data. Pitch your topic with ease and precision using this Energy Consumption Statistics Dashboard With Sources Overview Template PDF. This layout presents information on Source, Energy, Consumption. It is also available for immediate download and adjustment. So, changes can be made in the color, design, graphics or any other component to create a unique layout.
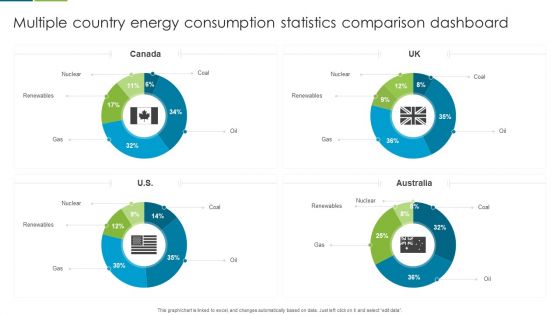
Multiple Country Energy Consumption Statistics Comparison Dashboard Formats PDF
This graph or chart is linked to excel, and changes automatically based on data. Just left click on it and select edit data. Pitch your topic with ease and precision using this Multiple Country Energy Consumption Statistics Comparison Dashboard Formats PDF. This layout presents information on Nuclear, Renewables, Gas. It is also available for immediate download and adjustment. So, changes can be made in the color, design, graphics or any other component to create a unique layout.
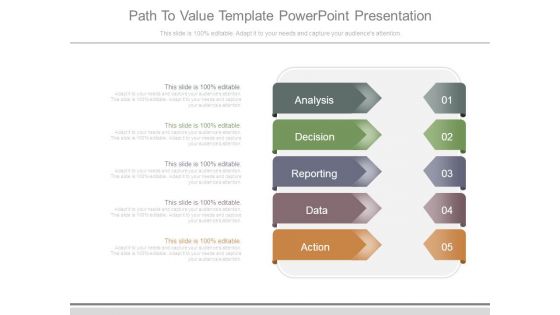
Path To Value Template Powerpoint Presentation
This is a path to value template powerpoint presentation. This is a five stage process. The stages in this process are analysis, decision, reporting, data, action.

Dashboard Assess Healthcare Service Healthcare Information Tech Enhance Medical Facilities Microsoft Pdf
This slide covers KPI dashboard to assess performance f medical services. It involves details such as patient stay length, admission rate, average treatment costs and cost analysis of stays. From laying roadmaps to briefing everything in detail, our templates are perfect for you. You can set the stage with your presentation slides. All you have to do is download these easy to edit and customizable templates. Dashboard Assess Healthcare Service Healthcare Information Tech Enhance Medical Facilities Microsoft Pdf will help you deliver an outstanding performance that everyone would remember and praise you for. Do download this presentation today. This slide covers KPI dashboard to assess performance f medical services. It involves details such as patient stay length, admission rate, average treatment costs and cost analysis of stays.
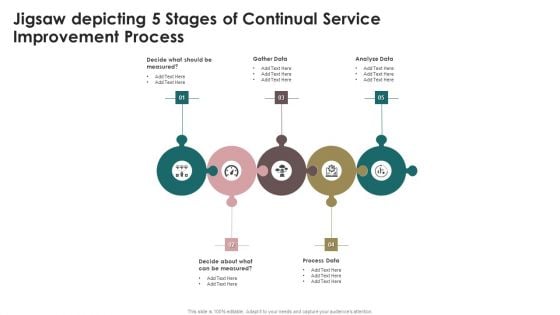
Jigsaw Depicting 5 Stages Of Continual Service Improvement Process Elements PDF
Presenting Jigsaw Depicting 5 Stages Of Continual Service Improvement Process Elements PDF to dispense important information. This template comprises five stages. It also presents valuable insights into the topics including Gather Data, Analyze Data, Process Data. This is a completely customizable PowerPoint theme that can be put to use immediately. So, download it and address the topic impactfully.
Best Practices For Project Tracking And Control Diagrams PDF
Mentioned slide illustrates best project monitoring and control practices which can be used by PM. PM can ensure project is within the scope by following practices like measure performance analytically, project management software application and project team training. Presenting Best Practices For Project Tracking And Control Diagrams PDF to dispense important information. This template comprises four stages. It also presents valuable insights into the topics including Measure Performance Analytically, Project Management Software Application, Project Team Training. This is a completely customizable PowerPoint theme that can be put to use immediately. So, download it and address the topic impactfully.
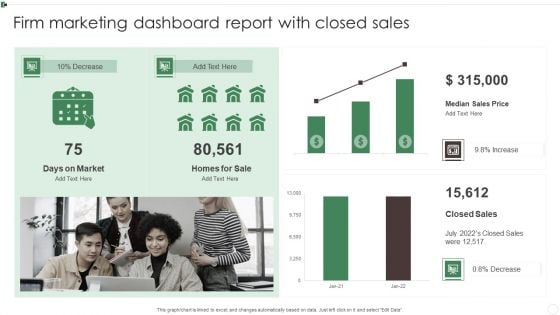
Firm Marketing Dashboard Report With Closed Sales Ppt Slides Graphics Example PDF
This graph or chart is linked to excel, and changes automatically based on data. Just left click on it and select Edit Data. Showcasing this set of slides titled Firm Marketing Dashboard Report With Closed Sales Ppt Slides Graphics Example PDF. The topics addressed in these templates are Days On Market, Homes For Sale, Median Sales Price, Closed Sales. All the content presented in this PPT design is completely editable. Download it and make adjustments in color, background, font etc. as per your unique business setting.
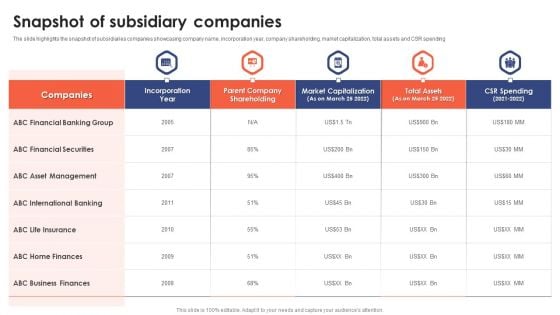
Banking Institution Company Profile Snapshot Of Subsidiary Companies Information PDF
Deliver and pitch your topic in the best possible manner with this Banking Institution Company Profile Snapshot Of Subsidiary Companies Information PDF. Use them to share invaluable insights on Company Shareholding, Total Assets, Business Finances and impress your audience. This template can be altered and modified as per your expectations. So, grab it now.

Energy Consumption Dashboard With Yearly Savings
Create an editable Energy Consumption Dashboard With Yearly Savings that communicates your idea and engages your audience. Whether you are presenting a business or an educational presentation, pre-designed presentation templates help save time. Energy Consumption Dashboard With Yearly Savings is highly customizable and very easy to edit, covering many different styles from creative to business presentations. Slidegeeks has creative team members who have crafted amazing templates. So, go and get them without any delay. Use our professionally designed PowerPoint presentation Energy Consumption Dashboard With Yearly Savings that serves as engaging and efficient tool for any presentation topic.

Multiple Point Of Sale System Dashboard Depicting Restaurants Daily Performance Mockup PDF
This Slide represents point of sale system dashboard depicting restaurants daily performance which can be beneficial for eateries to manage their regular sales. It includes information about sales, expenditure, menu, customer data, bookings and reports. Persuade your audience using this Multiple Point Of Sale System Dashboard Depicting Restaurants Daily Performance Mockup PDF. This PPT design covers four stages, thus making it a great tool to use. It also caters to a variety of topics including Expenditure, Sales, Customer Data. Download this PPT design now to present a convincing pitch that not only emphasizes the topic but also showcases your presentation skills.
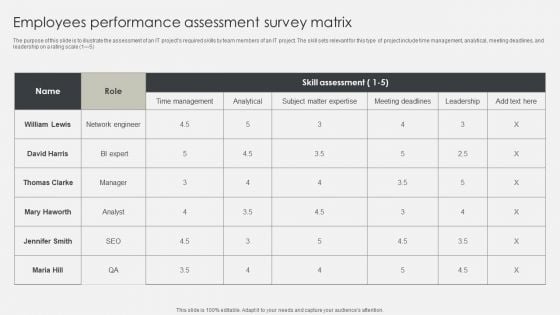
Employees Performance Assessment Survey Matrix Slides PDF
The purpose of this slide is to illustrate the assessment of an IT projects required skills by team members of an IT project. The skill sets relevant for this type of project include time management, analytical, meeting deadlines, and leadership on a rating scale 1 5. Pitch your topic with ease and precision using this Employees Performance Assessment Survey Matrix Slides PDF. This layout presents information on Management, Analytical, Skill Assessment. It is also available for immediate download and adjustment. So, changes can be made in the color, design, graphics or any other component to create a unique layout.
Tracking Purchase Insights Using Hyper Personalization Dashboard
Present like a pro with Tracking Purchase Insights Using Hyper Personalization Dashboard. Create beautiful presentations together with your team, using our easy-to-use presentation slides. Share your ideas in real-time and make changes on the fly by downloading our templates. So whether you are in the office, on the go, or in a remote location, you can stay in sync with your team and present your ideas with confidence. With Slidegeeks presentation got a whole lot easier. Grab these presentations today. This slide showcases a KPI dashboard for hyper-personalization for tracking purchase insights. It includes metrics such as projected user interaction, traffic origins, equipment type, and countries.
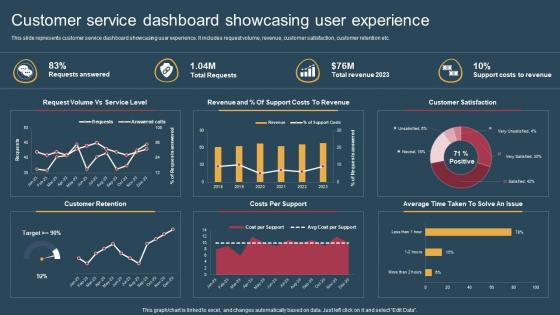
Customer Service Dashboard Conversion Of Customer Support Services Pictures Pdf
This slide represents customer service dashboard showcasing user experience. It includes request volume, revenue, customer satisfaction, customer retention etc. Get a simple yet stunning designed Customer Service Dashboard Conversion Of Customer Support Services Pictures Pdf. It is the best one to establish the tone in your meetings. It is an excellent way to make your presentations highly effective. So, download this PPT today from Slidegeeks and see the positive impacts. Our easy to edit Customer Service Dashboard Conversion Of Customer Support Services Pictures Pdf can be your go to option for all upcoming conferences and meetings. So, what are you waiting for Grab this template today. This slide represents customer service dashboard showcasing user experience. It includes request volume, revenue, customer satisfaction, customer retention etc.
Business People Walking 3d Man Explaining Bar Graph PowerPoint Templates
We present our business people walking 3d man explaining bar graph PowerPoint templates.Use our Finance PowerPoint Templates because Our PowerPoint Templates and Slides are Clear and concise. Use them and dispel any doubts your team may have. Download our Success PowerPoint Templates because Our PowerPoint Templates and Slides has conjured up a web of all you need with the help of our great team. Use them to string together your glistening ideas. Download our Business PowerPoint Templates because You are working at that stage with an air of royalty. Let our PowerPoint Templates and Slides be the jewels in your crown. Download and present our Sales PowerPoint Templates because Our PowerPoint Templates and Slides will bullet point your ideas. See them fall into place one by one. Use our Shapes PowerPoint Templates because Our PowerPoint Templates and Slides are specially created by a professional team with vast experience. They diligently strive to come up with the right vehicle for your brilliant Ideas. Use these PowerPoint slides for presentations relating to 3d, Accounting, Activity, Analysis, Analyst, Analytics, Background, Bar, Business, Businessman, Chart, Concept, Corporate, Diagram, Earn, Economy, Finance, Financial, Graph, Graphic, Grow, Growth, Illustration, Income, Investing, Investment, Isolated, Man, Manager, Market, Moving, People, Person, Profit, Progress, Prosperity, Red, Sales, Statistic, Stats, Strategy, Succeed, Success. The prominent colors used in the PowerPoint template are White, Gray, Black. Engineer growth with our Business People Walking 3d Man Explaining Bar Graph PowerPoint Templates. Download without worries with our money back guaranteee.
Business Persons 3d Man Beside Bar Graph Growth PowerPoint Templates Ppt Backgrounds For Slides
We present our business persons 3d man beside bar graph growth PowerPoint templates PPT backgrounds for slides.Download and present our Finance PowerPoint Templates because Our PowerPoint Templates and Slides ensures Effective communication. They help you put across your views with precision and clarity. Download and present our Success PowerPoint Templates because Our PowerPoint Templates and Slides help you pinpoint your timelines. Highlight the reasons for your deadlines with their use. Download and present our Business PowerPoint Templates because Our PowerPoint Templates and Slides will effectively help you save your valuable time. They are readymade to fit into any presentation structure. Present our Sales PowerPoint Templates because Our PowerPoint Templates and Slides will let Your superior ideas hit the target always and everytime. Download and present our Shapes PowerPoint Templates because you should once Tap the ingenuity of our PowerPoint Templates and Slides. They are programmed to succeed.Use these PowerPoint slides for presentations relating to 3d, Accounting, Activity, Analysis, Analyst, Analytics, Background, Bar, Business, Businessman, Chart, Concept, Corporate, Diagram, Earn, Economy, Finance, Financial, Graph, Graphic, Grow, Growth, Illustration, Income, Investing, Investment, Isolated, Man, Manager, Market, Moving, People, Person, Profit, Progress, Prosperity, Red, Sales, Statistic, Stats, Strategy, Succeed, Success. The prominent colors used in the PowerPoint template are Blue, Gray, Red. Define the course with our Business Persons 3d Man Beside Bar Graph Growth PowerPoint Templates Ppt Backgrounds For Slides. Channel them in the correct direction.
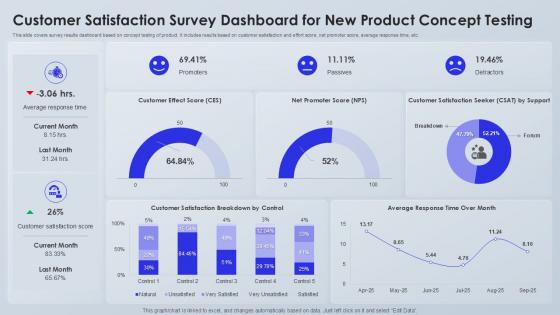
Customer Satisfaction Survey Dashboard For New Product Concept Testing
Find a pre-designed and impeccable Customer Satisfaction Survey Dashboard For New Product Concept Testing. The templates can ace your presentation without additional effort. You can download these easy-to-edit presentation templates to make your presentation stand out from others. So, what are you waiting for Download the template from Slidegeeks today and give a unique touch to your presentation. This slide highlights the survey results dashboard, focusing on product concept testing. It involves key metrics such as customer satisfaction, effort score, net promoter score, and average response time, providing valuable insights to refine and improve the product.
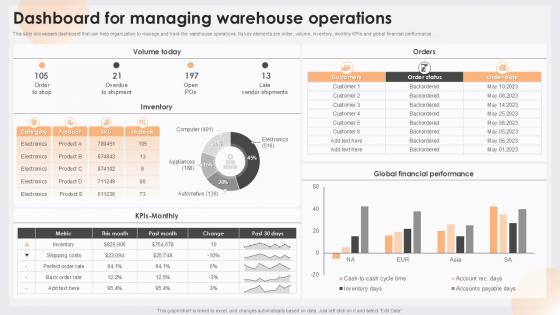
Dashboard For Managing Warehouse Determining Ideal Quantity To Procure Inventor
The best PPT templates are a great way to save time, energy, and resources. Slidegeeks have 100 percent editable powerpoint slides making them incredibly versatile. With these quality presentation templates, you can create a captivating and memorable presentation by combining visually appealing slides and effectively communicating your message. Download Dashboard For Managing Warehouse Determining Ideal Quantity To Procure Inventor from Slidegeeks and deliver a wonderful presentation. This slide depicts a dashboard for managing and tracking warehouse operations. It includes key elements such as order, volume, inventory, monthly KPIs, and global financial performance
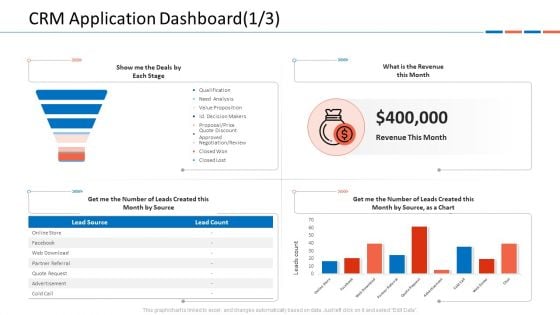
Customer Relationship Management Dashboard CRM Application Dashboard Month Microsoft PDF
This graph or chart is linked to excel, and changes automatically based on data. Just left click on it and select Edit Data.Deliver an awe-inspiring pitch with this creative customer relationship management dashboard crm application dashboard month microsoft pdf bundle. Topics like show me the deals by each stage, what is the revenue this month, get me the number of leads created this month by source as a chart can be discussed with this completely editable template. It is available for immediate download depending on the needs and requirements of the user.
Customer Relationship Management Dashboard CRM Application Dashboard Quarter Icons PDF
This graph or chart is linked to excel, and changes automatically based on data. Just left click on it and select Edit Data.Deliver and pitch your topic in the best possible manner with this customer relationship management dashboard crm application dashboard quarter icons pdf. Use them to share invaluable insights on marketing funnel all time, opportunity generation by quarter, active prospects, new prospects, new opportunities and impress your audience. This template can be altered and modified as per your expectations. So, grab it now.
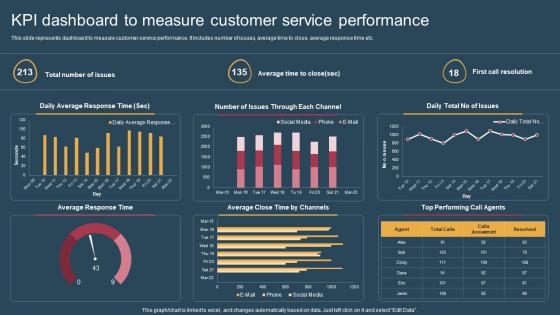
KPI Dashboard To Measure Conversion Of Customer Support Services Graphics Pdf
This slide represents dashboard to measure customer service performance. It includes number of issues, average time to close, average response time etc. Welcome to our selection of the KPI Dashboard To Measure Conversion Of Customer Support Services Graphics Pdf. These are designed to help you showcase your creativity and bring your sphere to life. Planning and Innovation are essential for any business that is just starting out. This collection contains the designs that you need for your everyday presentations. All of our PowerPoints are 100 percent editable, so you can customize them to suit your needs. This multi purpose template can be used in various situations. Grab these presentation templates today. This slide represents dashboard to measure customer service performance. It includes number of issues, average time to close, average response time etc.
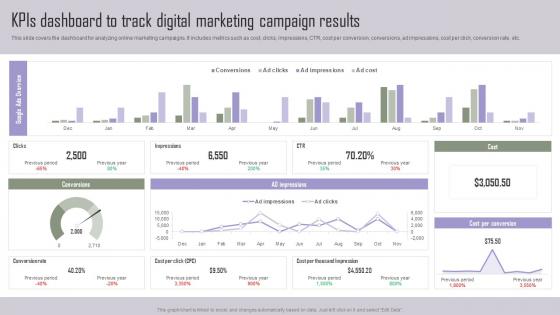
KPIs Dashboard To Track Digital Implementing Marketing Tactics To Drive Designs Pdf
This slide covers the dashboard for analyzing online marketing campaigns. It includes metrics such as cost, clicks, impressions, CTR, cost per conversion, conversions, ad impressions, cost per click, conversion rate, etc. Do you know about Slidesgeeks KPIs Dashboard To Track Digital Implementing Marketing Tactics To Drive Designs Pdf These are perfect for delivering any kind od presentation. Using it, create PowerPoint presentations that communicate your ideas and engage audiences. Save time and effort by using our pre designed presentation templates that are perfect for a wide range of topic. Our vast selection of designs covers a range of styles, from creative to business, and are all highly customizable and easy to edit. Download as a PowerPoint template or use them as Google Slides themes. This slide covers the dashboard for analyzing online marketing campaigns. It includes metrics such as cost, clicks, impressions, CTR, cost per conversion, conversions, ad impressions, cost per click, conversion rate, etc.
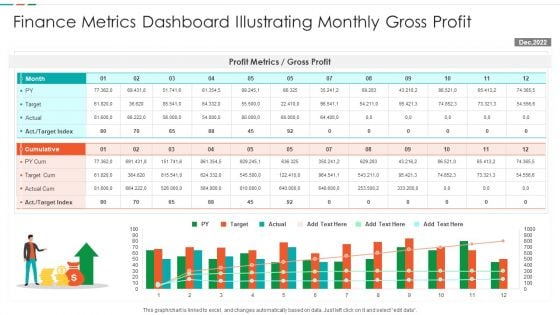
Finance Metrics Dashboard Illustrating Monthly Gross Profit Formats PDF
This graph or chart is linked to excel, and changes automatically based on data. Just left click on it and select edit data. Showcasing this set of slides titled Finance Metrics Dashboard Illustrating Monthly Gross Profit Formats PDF. The topics addressed in these templates are Profit Metrics Gross, Profit Target Cum, Actual Cum Target. All the content presented in this PPT design is completely editable. Download it and make adjustments in color, background, font etc. as per your unique business setting.
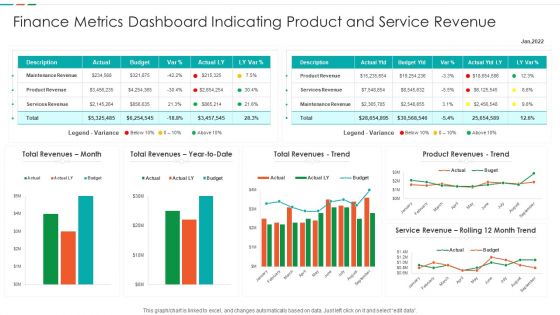
Finance Metrics Dashboard Indicating Product And Service Revenue Designs PDF
This graph or chart is linked to excel, and changes automatically based on data. Just left click on it and select edit data. Showcasing this set of slides titled Finance Metrics Dashboard Indicating Product And Service Revenue Designs PDF. The topics addressed in these templates are Maintenance Revenue Product, Revenue Product Revenues, Service Revenue Rolling. All the content presented in this PPT design is completely editable. Download it and make adjustments in color, background, font etc. as per your unique business setting.
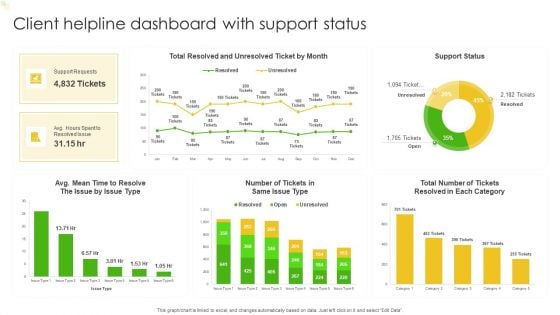
Client Helpline Dashboard With Support Status Ppt Portfolio Rules PDF
This graph or chart is linked to excel, and changes automatically based on data. Just left click on it and select Edit Data. Showcasing this set of slides titled Client Helpline Dashboard With Support Status Ppt Portfolio Rules PDF. The topics addressed in these templates are Total Number, Support Requests, Total Resolved, Support Status. All the content presented in this PPT design is completely editable. Download it and make adjustments in color, background, font etc. as per your unique business setting.
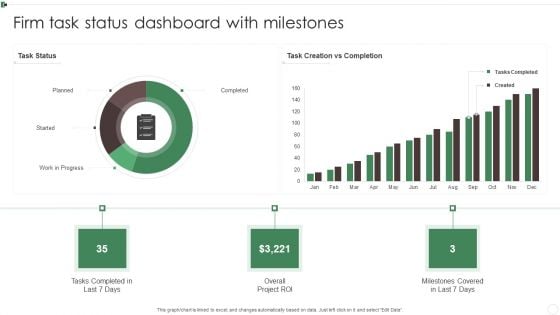
Firm Task Status Dashboard With Milestones Ppt Show Sample PDF
This graph or chart is linked to excel, and changes automatically based on data. Just left click on it and select Edit Data. Showcasing this set of slides titled Firm Task Status Dashboard With Milestones Ppt Show Sample PDF. The topics addressed in these templates are Tasks Completed, Planned, Work Progress, Overall Project ROI. All the content presented in this PPT design is completely editable. Download it and make adjustments in color, background, font etc. as per your unique business setting.
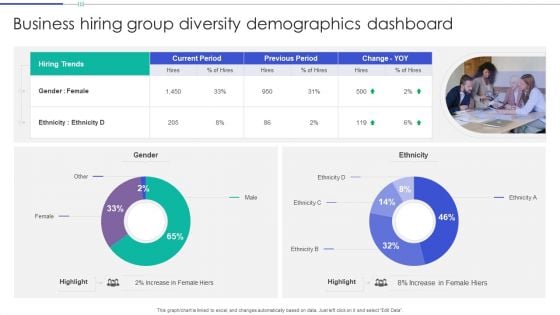
Business Hiring Group Diversity Demographics Dashboard Guidelines PDF
This graph or chart is linked to excel, and changes automatically based on data. Just left click on it and select Edit Data. Showcasing this set of slides titled Business Hiring Group Diversity Demographics Dashboard Guidelines PDF. The topics addressed in these templates are Hiring Trends, Current Period, Previous Period. All the content presented in this PPT design is completely editable. Download it and make adjustments in color, background, font etc. as per your unique business setting.
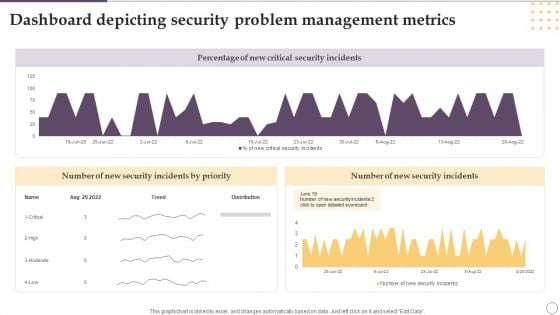
Dashboard Depicting Security Problem Management Metrics Ppt Gallery Designs PDF
This graph or chart is linked to excel, and changes automatically based on data. Just left click on it and select Edit Data. Showcasing this set of slides titled Dashboard Depicting Security Problem Management Metrics Ppt Gallery Designs PDF. The topics addressed in these templates are Percentage, New Critical, Security Incidents. All the content presented in this PPT design is completely editable. Download it and make adjustments in color, background, font etc. as per your unique business setting.


 Continue with Email

 Home
Home


