data analytics
Fuel Meter Vector Icon Ppt PowerPoint Presentation Professional Examples PDF
Persuade your audience using this fuel meter vector icon ppt powerpoint presentation professional examples pdf. This PPT design covers four stages, thus making it a great tool to use. It also caters to a variety of topics including fuel meter vector icon. Download this PPT design now to present a convincing pitch that not only emphasizes the topic but also showcases your presentation skills.

Picture Of Fuel Gauge With Pointing Level Ppt PowerPoint Presentation Infographic Template Graphics PDF
Persuade your audience using this picture of fuel gauge with pointing level ppt powerpoint presentation infographic template graphics pdf. This PPT design covers two stages, thus making it a great tool to use. It also caters to a variety of topics including picture of fuel gauge with pointing level. Download this PPT design now to present a convincing pitch that not only emphasizes the topic but also showcases your presentation skills.
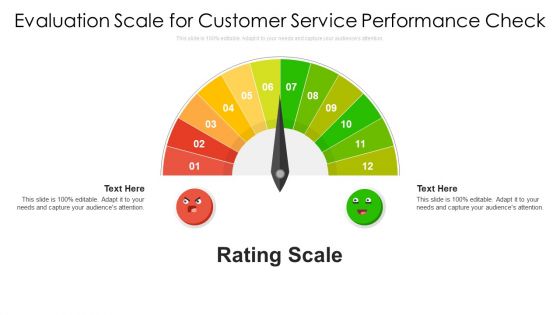
Evaluation Scale For Customer Service Ppt PowerPoint Presentation File Designs PDF
Persuade your audience using this evaluation scale for customer service ppt powerpoint presentation file designs pdf. This PPT design covers two stages, thus making it a great tool to use. It also caters to a variety of topics including evaluation scale for customer service performance check. Download this PPT design now to present a convincing pitch that not only emphasizes the topic but also showcases your presentation skills.
Disaster Threat Severity Assessment Icon Ppt Show Slides PDF
Persuade your audience using this Disaster Threat Severity Assessment Icon Ppt Show Slides PDF. This PPT design covers four stages, thus making it a great tool to use. It also caters to a variety of topics including Disaster Threat, Severity Assessment, Icon. Download this PPT design now to present a convincing pitch that not only emphasizes the topic but also showcases your presentation skills.
Computer Tablet With Graph Business PowerPoint Templates And PowerPoint Themes 1012
Computer Tablet With Graph Business PowerPoint Templates And PowerPoint Themes 1012-Develop competitive advantage with our above template which contains a diagram of computer tablet with bra graph showing success and growth. It portrays the concept of account, balance, business, data, economy, finance, graph, growth, information, investment, market, profit, report, research, statistics and success. Adjust the above image in your PPT presentations to visually support your content in your Business and Financial PPT slideshows. Present your views using our innovative slides and be assured of leaving a lasting impression.-Computer Tablet With Graph Business PowerPoint Templates And PowerPoint Themes 1012-This PowerPoint template can be used for presentations relating to-Computer Tablet With Graph, Arrows, Finance, Business, Marketing, Symbol Our Computer Tablet With Graph Business PowerPoint Templates And PowerPoint Themes 1012 will keep the faith. They will show allegiance to your thoughts.
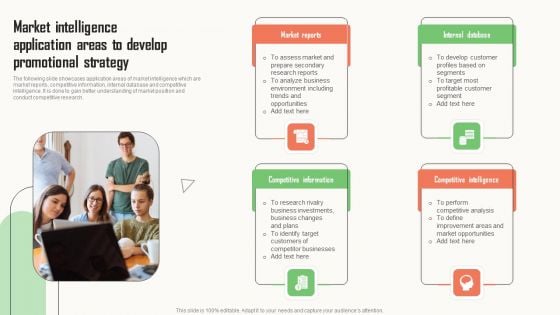
Strategic Market Insight Implementation Guide Market Intelligence Application Areas To Develop Promotional Designs PDF
The following slide showcases application areas of market intelligence which are market reports, competitive information, internal database and competitive intelligence. It is done to gain better understanding of market position and conduct competitive research. The Strategic Market Insight Implementation Guide Market Intelligence Application Areas To Develop Promotional Designs PDF is a compilation of the most recent design trends as a series of slides. It is suitable for any subject or industry presentation, containing attractive visuals and photo spots for businesses to clearly express their messages. This template contains a variety of slides for the user to input data, such as structures to contrast two elements, bullet points, and slides for written information. Slidegeeks is prepared to create an impression.
Ppt Busines Men Silhouettes Standing On Circular Chart PowerPoint Templates
PPT busines men silhouettes standing on circular chart PowerPoint Templates-Diagrams for PowerPoint Circle arrow offer an elegant alternative to the boring bullet points used in Presentations. The items are professionally animated and are easily editable. This diagram is useful to show interrelated factors, give and take interaction etc.-PPT busines men silhouettes standing on circular chart PowerPoint Templates-arrow, bar, board, business, button, calendar, chart, collection, computer, connection, data, demographics, design, document, earth, eco, elements, globe, graph, graphics, growth, icon, illustration, infochart, infographic, infomation, information, internet, label, map, modern, network, people, pie, presentation, recycle, report, sale, set, shape, sign, statistic, symbol, team, template, vector Your ideas will click with our Ppt Busines Men Silhouettes Standing On Circular Chart PowerPoint Templates. The audience will be in complete agreement.
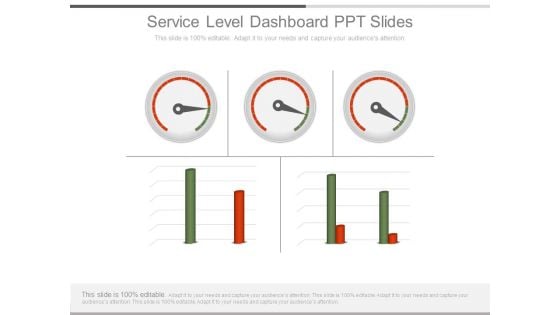
Service Level Dashboard Ppt Slides
This is a service level dashboard ppt slides. This is a three stage process. The stages in this process are dashboard, graph, growth.
Project Tracking Tracker Dashboard Icon Elements PDF
Pitch your topic with ease and precision using this Project Tracking Tracker Dashboard Icon Elements PDF. This layout presents information on Tracker Dashboard Icon, Project Tracking. It is also available for immediate download and adjustment. So, changes can be made in the color, design, graphics or any other component to create a unique layout.

WMS Implementation Inventory Management Dashboard Download PDF
The slide demonstrates information regarding the inventory management dashboard in order to track key activities. This is a wms implementation inventory management dashboard download pdf template with various stages. Focus and dispense information on wms implementation inventory management dashboard download pdf stages using this creative set, that comes with editable features. It contains large content boxes to add your information on topics like internal transfers, manufacturing, internal transfers. You can also showcase facts, figures, and other relevant content using this PPT layout. Grab it now.
Linear Steps Timeline Chart And Icons Powerpoint Slides
This PowerPoint template graphics of linear timeline steps. Download this PPT chart for yearly business performance analysis. This PowerPoint slide is of great help in the business sector to make realistic presentations and provides effective way of presenting your newer thoughts.
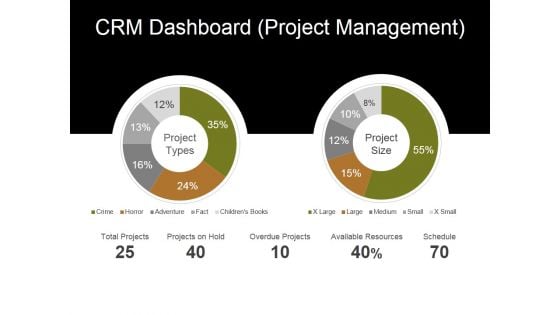
Crm Dashboard Project Management Ppt PowerPoint Presentation Layouts Ideas
This is a crm dashboard project management ppt powerpoint presentation layouts ideas. This is a two stage process. The stages in this process are total projects, projects on hold, overdue projects, available resources, schedule.
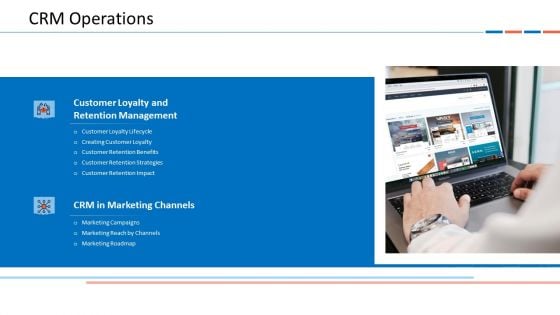
Customer Relationship Management Dashboard CRM Operations Download PDF
This is a customer relationship management dashboard crm operations download pdf template with various stages. Focus and dispense information on two stages using this creative set, that comes with editable features. It contains large content boxes to add your information on topics like customer loyalty and retention management, crm in marketing channels, customer loyalty lifecycle, creating customer loyalty. You can also showcase facts, figures, and other relevant content using this PPT layout. Grab it now.
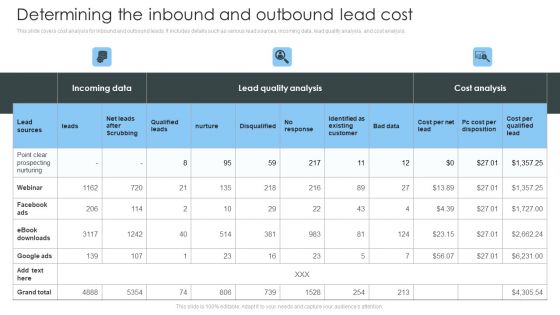
Consumer Lead Generation Process Determining The Inbound And Outbound Lead Cost Background PDF
This slide covers cost analysis for inbound and outbound leads. It includes details such as various lead sources, incoming data, lead quality analysis, and cost analysis. Get a simple yet stunning designed Consumer Lead Generation Process Determining The Inbound And Outbound Lead Cost Background PDF. It is the best one to establish the tone in your meetings. It is an excellent way to make your presentations highly effective. So, download this PPT today from Slidegeeks and see the positive impacts. Our easy-to-edit Consumer Lead Generation Process Determining The Inbound And Outbound Lead Cost Background PDF can be your go-to option for all upcoming conferences and meetings. So, what are you waiting for Grab this template today.
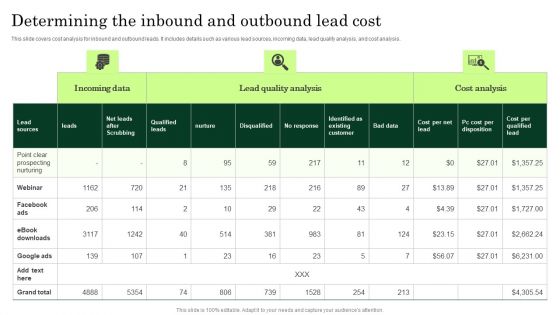
Determining The Inbound And Outbound Lead Cost Enhancing Client Lead Conversion Rates Elements PDF
This slide covers cost analysis for inbound and outbound leads. It includes details such as various lead sources, incoming data, lead quality analysis, and cost analysis. This modern and well arranged Determining The Inbound And Outbound Lead Cost Enhancing Client Lead Conversion Rates Elements PDF provides lots of creative possibilities. It is very simple to customize and edit with the Powerpoint Software. Just drag and drop your pictures into the shapes. All facets of this template can be edited with Powerpoint no extra software is necessary. Add your own material, put your images in the places assigned for them, adjust the colors, and then you can show your slides to the world, with an animated slide included.
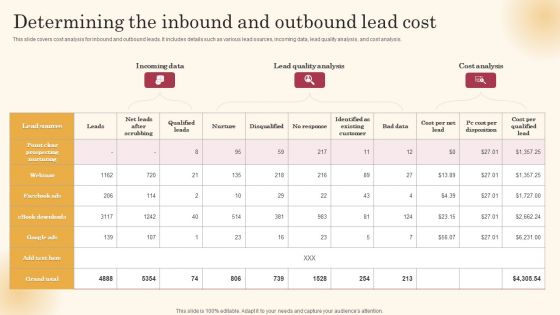
Determining The Inbound And Outbound Lead Cost Improving Lead Generation Process Designs PDF
This slide covers cost analysis for inbound and outbound leads. It includes details such as various lead sources, incoming data, lead quality analysis, and cost analysis. This modern and well arranged Determining The Inbound And Outbound Lead Cost Improving Lead Generation Process Designs PDF provides lots of creative possibilities. It is very simple to customize and edit with the Powerpoint Software. Just drag and drop your pictures into the shapes. All facets of this template can be edited with Powerpoint no extra software is necessary. Add your own material, put your images in the places assigned for them, adjust the colors, and then you can show your slides to the world, with an animated slide included.

Integrating Quality Strategy In Executing Effective Quality Enhancement Ideas Pdf
This slide covers overview to implementing quality improvement strategy in business operations. It involves quality tools and techniques such as lean manufacturing, six sigma, total quality management, kaizen and root cause analysis. The Integrating Quality Strategy In Executing Effective Quality Enhancement Ideas Pdf is a compilation of the most recent design trends as a series of slides. It is suitable for any subject or industry presentation, containing attractive visuals and photo spots for businesses to clearly express their messages. This template contains a variety of slides for the user to input data, such as structures to contrast two elements, bullet points, and slides for written information. Slidegeeks is prepared to create an impression. This slide covers overview to implementing quality improvement strategy in business operations. It involves quality tools and techniques such as lean manufacturing, six sigma, total quality management, kaizen and root cause analysis.
Devops Continuous Workflow Tracking Dashboard Slides PDF
This slide provides the glimpse of facts and figures related to continuous monitoring of project with DevOps. It includes planned vs. completed work items, work item priority wise, active bugs severity wise, etc. Showcasing this set of slides titled Devops Continuous Workflow Tracking Dashboard Slides PDF. The topics addressed in these templates are Continuous Workflow, Tracking Dashboard, Sprint Analysis By Assignee. All the content presented in this PPT design is completely editable. Download it and make adjustments in color, background, font etc. as per your unique business setting.
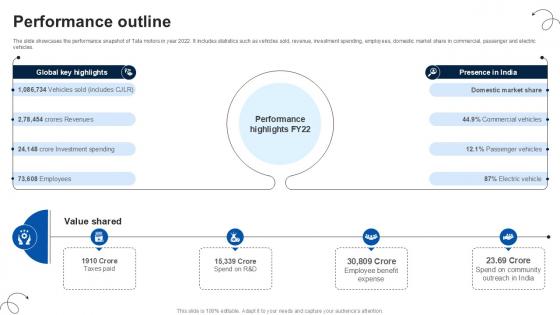
Performance Outline Luxury Automobile Vehicles PPT Template CP SS V
The slide showcases the performance snapshot of Tata motors in year 2022. It includes statistics such as vehicles sold, revenue, investment spending, employees, domestic market share in commercial, passenger and electric vehicles. Find a pre-designed and impeccable Performance Outline Luxury Automobile Vehicles PPT Template CP SS V. The templates can ace your presentation without additional effort. You can download these easy-to-edit presentation templates to make your presentation stand out from others. So, what are you waiting for Download the template from Slidegeeks today and give a unique touch to your presentation. The slide showcases the performance snapshot of Tata motors in year 2022. It includes statistics such as vehicles sold, revenue, investment spending, employees, domestic market share in commercial, passenger and electric vehicles.
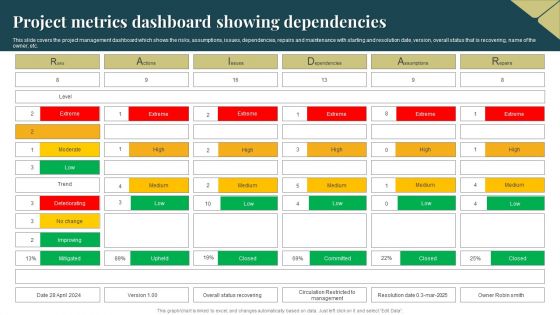
Project Metrics Dashboard Showing Dependencies Brochure PDF
This slide covers the project management dashboard which shows the risks, assumptions, issues, dependencies, repairs and maintenance with starting and resolution date, version, overall status that is recovering, name of the owner, etc. Showcasing this set of slides titled Project Metrics Dashboard Showing Dependencies Brochure PDF. The topics addressed in these templates are Project Metrics, Dashboard Showing Dependencies. All the content presented in this PPT design is completely editable. Download it and make adjustments in color, background, font etc. as per your unique business setting.
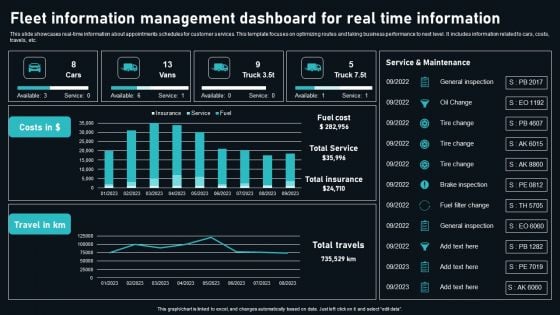
Fleet Information Management Dashboard For Real Time Information Graphics PDF
This slide showcases real time information about appointments schedules for customer services. This template focuses on optimizing routes and taking business performance to next level. It includes information related to cars, costs, travels, etc. Pitch your topic with ease and precision using this Fleet Information Management Dashboard For Real Time Information Graphics PDF. This layout presents information on General Inspection, Oil Change, Tire Change. It is also available for immediate download and adjustment. So, changes can be made in the color, design, graphics or any other component to create a unique layout.
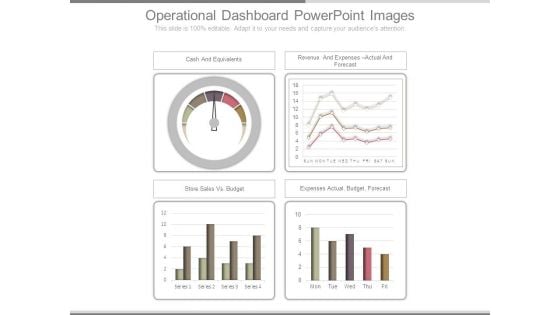
Operational Dashboard Powerpoint Images
This is a operational dashboard powerpoint images. This is a four stage process. The stages in this process are cash and equivalents, revenue and expenses actual and forecast, store sales vs budget, expenses actual budget forecast.
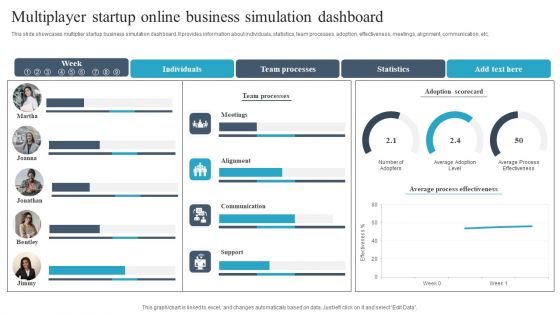
Multiplayer Startup Online Business Simulation Dashboard Demonstration PDF
This slide showcases multiplier startup business simulation dashboard. It provides information about individuals, statistics, team processes, adoption, effectiveness, meetings, alignment, communication, etc. Pitch your topic with ease and precision using this Multiplayer Startup Online Business Simulation Dashboard Demonstration PDF. This layout presents information on Individuals, Team Processes, Statistics. It is also available for immediate download and adjustment. So, changes can be made in the color, design, graphics or any other component to create a unique layout.
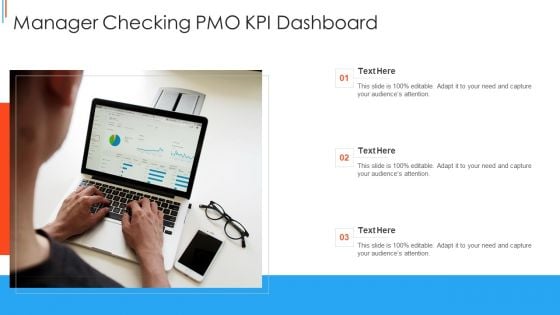
Manager Checking PMO KPI Dashboard Mockup PDF
Persuade your audience using this Manager Checking PMO KPI Dashboard Mockup PDF This PPT design covers three stages, thus making it a great tool to use. It also caters to a variety of topics including Manager Checking, Pmo Kpi Dashboard Download this PPT design now to present a convincing pitch that not only emphasizes the topic but also showcases your presentation skills.
Yearly Sales Assessment Dashboard Icon Guidelines PDF
Persuade your audience using this Yearly Sales Assessment Dashboard Icon Guidelines PDF. This PPT design covers four stages, thus making it a great tool to use. It also caters to a variety of topics including Yearly Sales Assessment, Dashboard Icon. Download this PPT design now to present a convincing pitch that not only emphasizes the topic but also showcases your presentation skills.
Monthly Salary Management Dashboard Icon Microsoft PDF
Persuade your audience using this Monthly Salary Management Dashboard Icon Microsoft PDF. This PPT design covers three stages, thus making it a great tool to use. It also caters to a variety of topics including Dashboard Icon, Monthly Salary Management. Download this PPT design now to present a convincing pitch that not only emphasizes the topic but also showcases your presentation skills.
Personnel Salary Processing Dashboard Icon Slides PDF
Persuade your audience using this Personnel Salary Processing Dashboard Icon Slides PDF. This PPT design covers three stages, thus making it a great tool to use. It also caters to a variety of topics including Dashboard Icon, Personnel Salary Processing. Download this PPT design now to present a convincing pitch that not only emphasizes the topic but also showcases your presentation skills.
Executive Dashboards Showing Performance Icon Demonstration PDF
Persuade your audience using this Executive Dashboards Showing Performance Icon Demonstration PDF. This PPT design covers Three stages, thus making it a great tool to use. It also caters to a variety of topics including Executive Dashboards, Showing Performance Icon. Download this PPT design now to present a convincing pitch that not only emphasizes the topic but also showcases your presentation skills.
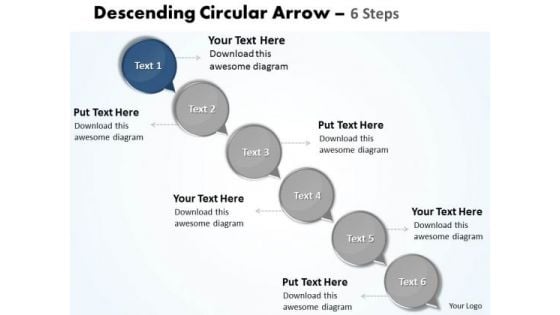
Ppt Animate Text PowerPoint 2007 Circles Downward Arrow 6 Steps Business Templates
PPT animate text powerpoint 2007 circles downward arrow 6 steps Business Templates-Arrows PowerPoint Diagram is nice for financial PowerPoint Diagram presentations as well as other analysis or business PowerPoint diagram needs. Use this graphical approach to represent global business issues such as financial data, stock market Exchange, increase in sales, corporate presentations and more.-PPT animate text powerpoint 2007 circles downward arrow 6 steps Business Templates-Add, Aqua, Arrows, Badges, Bar, Blend, Blue, Bright, Bubbles, Buttons, Caution, Circle, Drop, Elements, Glossy, Glowing, Graphic, Heart, Help, Icons, Idea, Illustration, Navigation, Oblong, Plus, Round, Service, Shadow, Shiny, Sign, Speech, Squares Enthral your listeners with your suggestions. Keep them clued in with our Ppt Animate Text PowerPoint 2007 Circles Downward Arrow 6 Steps Business Templates.
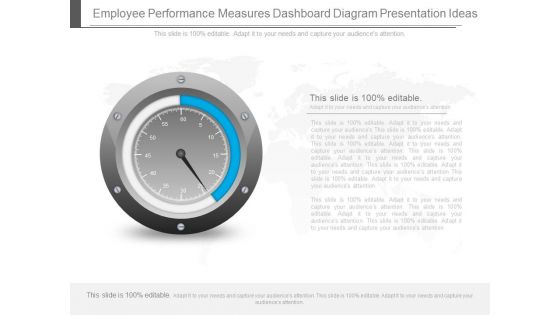
Employee Performance Measures Dashboard Diagram Presentation Ideas
This is a employee performance measures dashboard diagram presentation ideas. This is a one stage process. The stages in this process are business, marketing, dashboard, measuring.
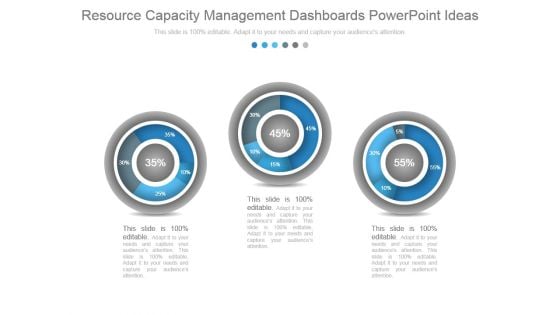
Resource Capacity Management Dashboards Powerpoint Ideas
This is a resource capacity management dashboards powerpoint ideas. This is a three stage process. The stages in this process are dashboard, percentage, measuring, business, marketing.
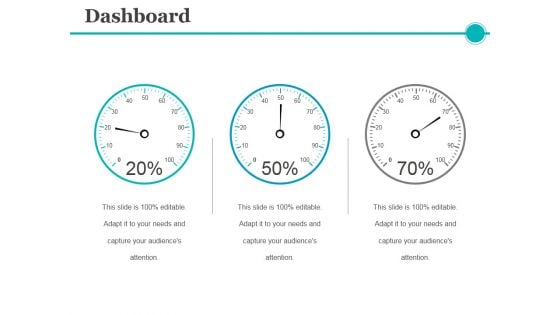
Dashboard Ppt PowerPoint Presentation Portfolio Background Image
This is a dashboard ppt powerpoint presentation portfolio background image. This is a three stage process. The stages in this process are dashboard, measurement, business, marketing.
Dashboard Ppt PowerPoint Presentation Portfolio Maker
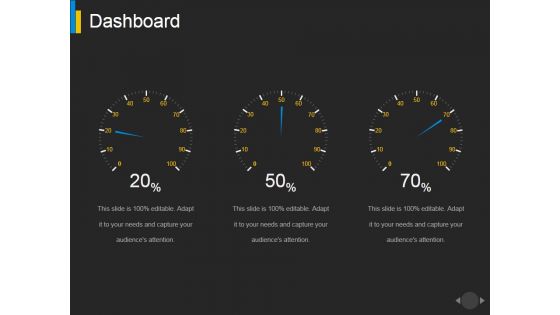
This is a dashboard ppt powerpoint presentation portfolio maker. This is a three stage process. The stages in this process are dashboard, measurement, finance, business.
Dashboard Ppt PowerPoint Presentation Icon Influencers
This is a dashboard ppt powerpoint presentation icon influencers. This is a three stage process. The stages in this process are dashboard, measurement, business, marketing.
Dashboard Ppt PowerPoint Presentation Infographics Outfit
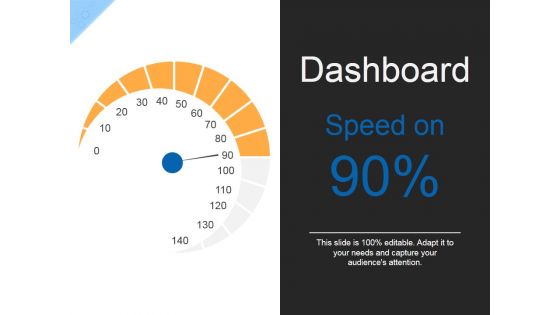
This is a dashboard ppt powerpoint presentation infographics outfit. This is a one stage process. The stages in this process are dashboard, measurement, finance, business.
Dashboard Ppt PowerPoint Presentation Inspiration Backgrounds
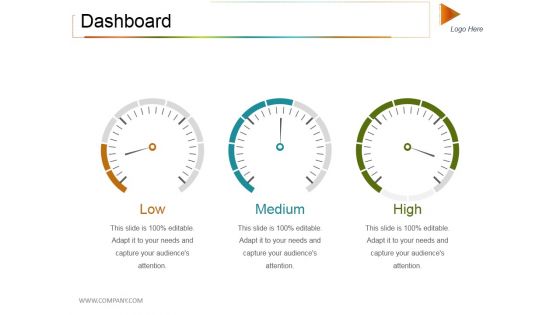
This is a dashboard ppt powerpoint presentation inspiration backgrounds. This is a three stage process. The stages in this process are low, medium, high, dashboard, measurement.
Dashboard Ppt PowerPoint Presentation Styles Templates
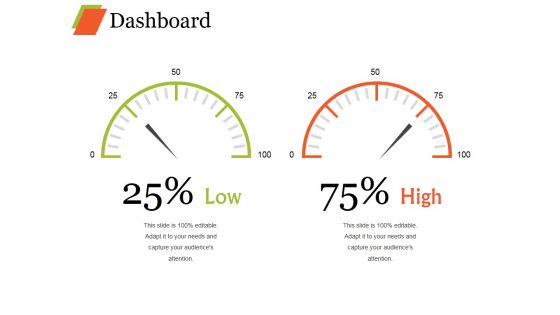
This is a dashboard ppt powerpoint presentation styles templates. This is a two stage process. The stages in this process are low, medium, high, dashboard, measurement.

Dashboard Ppt PowerPoint Presentation File Background Images
This is a dashboard ppt powerpoint presentation file background images. This is a three stage process. The stages in this process are dashboard, business, marketing, strategy, process.
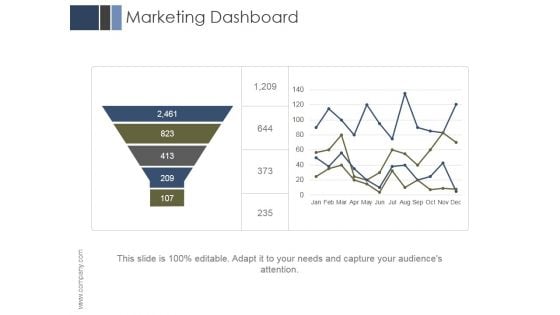
Marketing Dashboard Ppt PowerPoint Presentation Templates
This is a marketing dashboard ppt powerpoint presentation templates. This is a two stage process. The stages in this process are business, marketing, management, finance, dashboard.
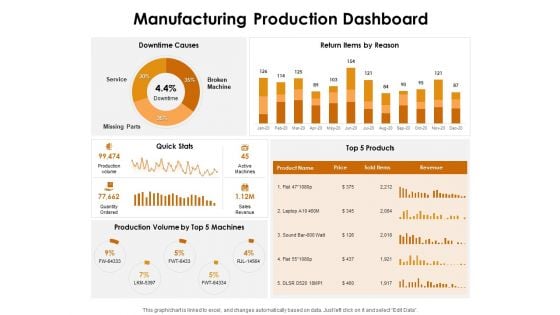
KPI Dashboards Per Industry Manufacturing Production Dashboard Ppt PowerPoint Presentation Portfolio Shapes PDF
Deliver an awe-inspiring pitch with this creative kpi dashboards per industry manufacturing production dashboard ppt powerpoint presentation portfolio shapes pdf bundle. Topics like downtime causes, return items reason, quick stats, top 5 products, production volume top 5 machines can be discussed with this completely editable template. It is available for immediate download depending on the needs and requirements of the user.
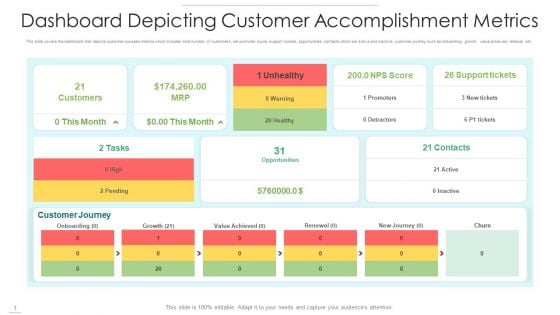
Dashboard Depicting Customer Accomplishment Metrics Slides PDF
This slide covers the dashboard that depicts customer success metrics which includes total number of customers, net promoter score, support tickets, opportunities, contacts which are active and inactive, customer journey such as onboarding, growth, value achieved, renewal, etc. Showcasing this set of slides titled dashboard depicting customer accomplishment metrics slides pdf. The topics addressed in these templates are customers, unhealthy, support tickets. All the content presented in this PPT design is completely editable. Download it and make adjustments in color, background, font etc. as per your unique business setting.
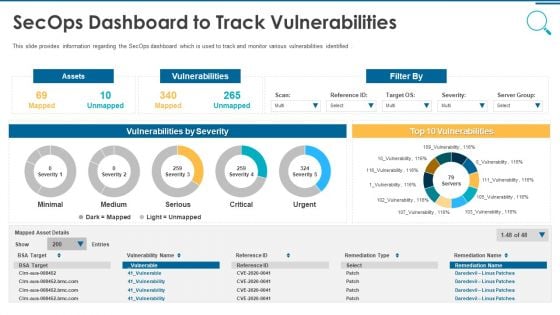
Information And Technology Security Operations Secops Dashboard To Track Vulnerabilities Information PDF
This slide provides information regarding the SecOps dashboard which is used to track and monitor various vulnerabilities identified. Deliver and pitch your topic in the best possible manner with this information and technology security operations secops dashboard to track vulnerabilities information pdf. Use them to share invaluable insights on assets, vulnerabilities, severity and impress your audience. This template can be altered and modified as per your expectations. So, grab it now.
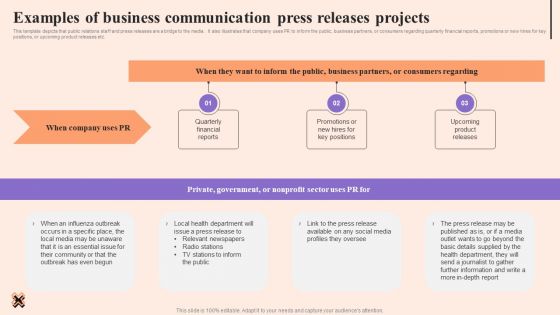
Corporate Communication Strategy Examples Of Business Communication Press Releases Projects Topics PDF
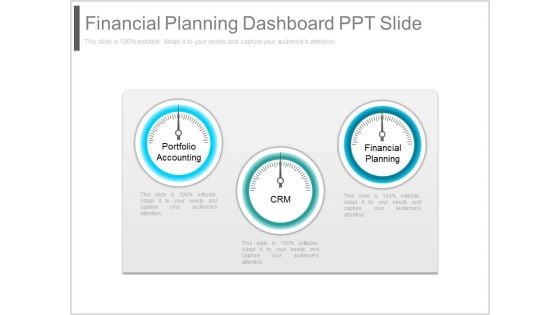
Financial Planning Dashboard Ppt Slide
This is a financial planning dashboard ppt slide. This is a three stage process. The stages in this process are portfolio accounting, crm, financial planning.
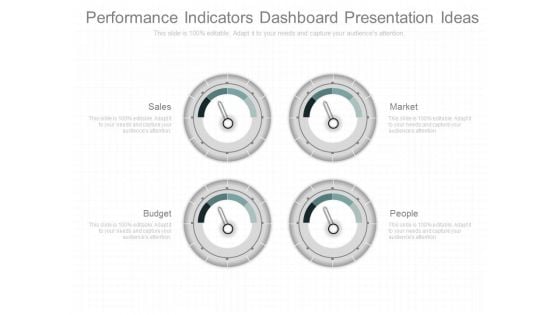
Performance Indicators Dashboard Presentation Ideas
This is a performance indicators dashboard presentation ideas. This is a four stage process. The stages in this process are sales, market, budget, people.

Dashboard System Ppt Powerpoint Ideas
This is a dashboard system ppt powerpoint ideas. This is a four stage process. The stages in this process are description.
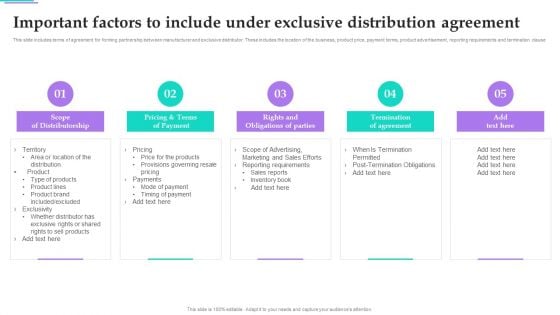
Distribution Strategies For Increasing Important Factors To Include Under Exclusive Distribution Professional PDF
This slide includes terms of agreement for forming partnership between manufacturer and exclusive distributor. These includes the location of the business, product price, payment terms, product advertisement, reporting requirements and termination clause. The Distribution Strategies For Increasing Important Factors To Include Under Exclusive Distribution Professional PDF is a compilation of the most recent design trends as a series of slides. It is suitable for any subject or industry presentation, containing attractive visuals and photo spots for businesses to clearly express their messages. This template contains a variety of slides for the user to input data, such as structures to contrast two elements, bullet points, and slides for written information. Slidegeeks is prepared to create an impression.
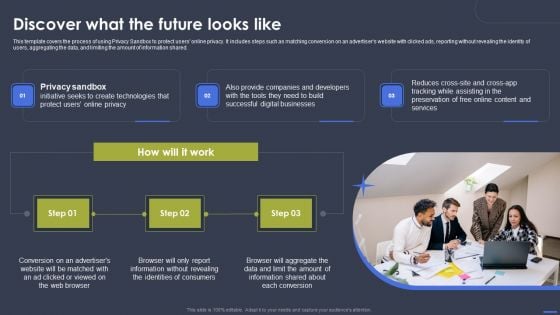
Optimizing Digital Marketing Strategy Discover What The Future Looks Like Infographics PDF
This template covers the process of using privacy sandbox to protect users online privacy. it includes steps such as matching conversion on an advertisers website with clicked ads, reporting without revealing the identity of users, aggregating the data, and limiting the amount of information shared. Do you have an important presentation coming up Are you looking for something that will make your presentation stand out from the rest Look no further than Optimizing Digital Marketing Strategy Discover What The Future Looks Like Infographics PDF. With our professional designs, you can trust that your presentation will pop and make delivering it a smooth process. And with Slidegeeks, you can trust that your presentation will be unique and memorable. So why wait Grab Optimizing Digital Marketing Strategy Discover What The Future Looks Like Infographics PDF today and make your presentation stand out from the rest.
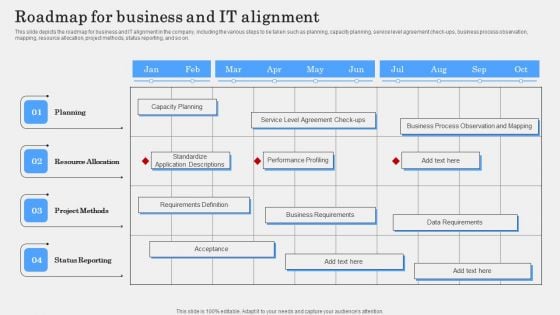
IT Alignment Phases In Business Roadmap For Business And IT Alignment Template PDF
This slide depicts the roadmap for business and IT alignment in the company, including the various steps to be taken such as planning, capacity planning, service level agreement check ups, business process observation, mapping, resource allocation, project methods, status reporting, and so on. The IT Alignment Phases In Business Roadmap For Business And IT Alignment Template PDF is a compilation of the most recent design trends as a series of slides. It is suitable for any subject or industry presentation, containing attractive visuals and photo spots for businesses to clearly express their messages. This template contains a variety of slides for the user to input data, such as structures to contrast two elements, bullet points, and slides for written information. Slidegeeks is prepared to create an impression.
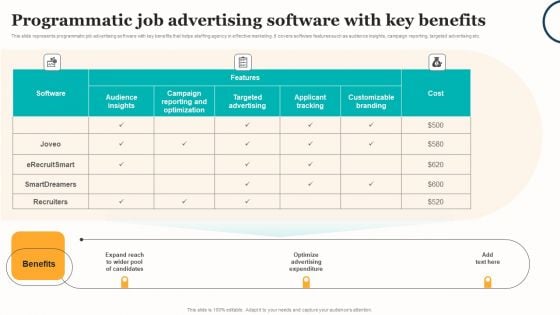
Marketing Strategy For A Recruitment Company Programmatic Job Advertising Software Key Benefits Pictures PDF
This slide represents programmatic job advertising software with key benefits that helps staffing agency in effective marketing. It covers software features such as audience insights, campaign reporting, targeted advertising etc. The Marketing Strategy For A Recruitment Company Programmatic Job Advertising Software Key Benefits Pictures PDF is a compilation of the most recent design trends as a series of slides. It is suitable for any subject or industry presentation, containing attractive visuals and photo spots for businesses to clearly express their messages. This template contains a variety of slides for the user to input data, such as structures to contrast two elements, bullet points, and slides for written information. Slidegeeks is prepared to create an impression.
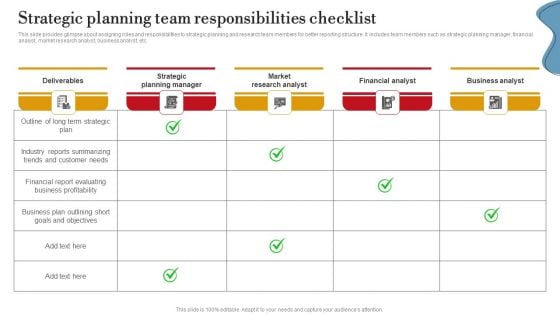
Strategic Planning Team Responsibilities Checklist Ppt PowerPoint Presentation Diagram Lists PDF
This slide provides glimpse about assigning roles and responsibilities to strategic planning and research team members for better reporting structure. It includes team members such as strategic planning manager, financial analyst, market research analyst, business analyst, etc. The Strategic Planning Team Responsibilities Checklist Ppt PowerPoint Presentation Diagram Lists PDF is a compilation of the most recent design trends as a series of slides. It is suitable for any subject or industry presentation, containing attractive visuals and photo spots for businesses to clearly express their messages. This template contains a variety of slides for the user to input data, such as structures to contrast two elements, bullet points, and slides for written information. Slidegeeks is prepared to create an impression.

Porters Five Forces Analysis For Sample Pentagram Business Plan PPT PowerPoint BP SS V
The slide highlights porters five forces model and its implications in the US graphic design industry. The five forces include rivalry among competitors, bargaining power of buyers and suppliers, and the threat of new entrants and substitutes and further leverage the company to structure its corporate strategy. The Porters Five Forces Analysis For Sample Pentagram Business Plan PPT PowerPoint BP SS V is a compilation of the most recent design trends as a series of slides. It is suitable for any subject or industry presentation, containing attractive visuals and photo spots for businesses to clearly express their messages. This template contains a variety of slides for the user to input data, such as structures to contrast two elements, bullet points, and slides for written information. Slidegeeks is prepared to create an impression. The slide highlights porters five forces model and its implications in the US graphic design industry. The five forces include rivalry among competitors, bargaining power of buyers and suppliers, and the threat of new entrants and substitutes and further leverage the company to structure its corporate strategy.
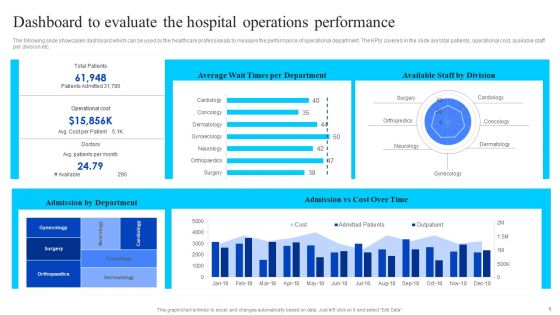
Healthcare Management Overview Trends Stats And Operational Areas Dashboard To Evaluate The Hospital Operations Performance Pictures PDF
The following slide showcases dashboard which can be used by the healthcare professionals to measure the performance of operational department. The KPIs covered in the slide are total patients, operational cost, available staff per division etc. There are so many reasons you need a Healthcare Management Overview Trends Stats And Operational Areas Dashboard To Evaluate The Hospital Operations Performance Pictures PDF. The first reason is you can not spend time making everything from scratch, Thus, Slidegeeks has made presentation templates for you too. You can easily download these templates from our website easily.

Financial Dashboard Examples Ppt Templates
This is a financial dashboard examples ppt templates. This is a four stage process. The stages in this process are income distribution, cogs distributions, expense distributions, profit and loss.
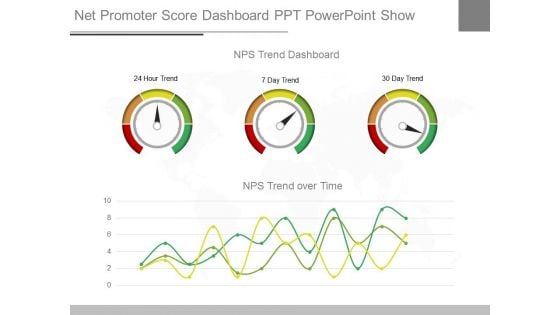
Net Promoter Score Dashboard Ppt Powerpoint Show
This is a net promoter score dashboard ppt powerpoint show. This is a three stage process. The stages in this process are nps trend dashboard, 24 hour trend, 7 day trend, 30 day trend, nps trend over time.
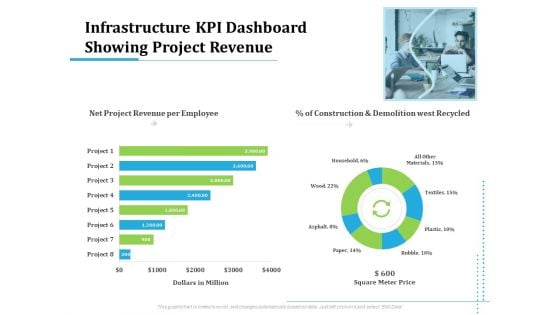
Information Technology Functions Management Infrastructure KPI Dashboard Showing Project Revenue Ppt Show Information PDF
Deliver an awe-inspiring pitch with this creative information technology functions management infrastructure kpi dashboard showing project revenue ppt show information pdf bundle. Topics like net project revenue per employee, construction and demolition west recycled, dollars million, square meter price, project can be discussed with this completely editable template. It is available for immediate download depending on the needs and requirements of the user.
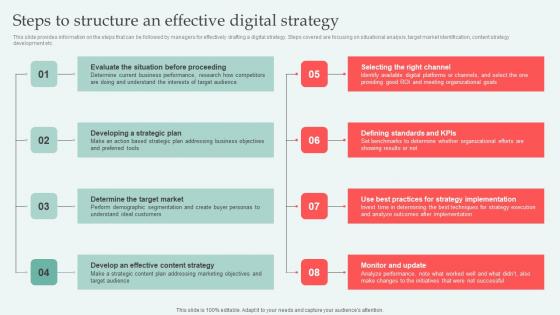
Steps To Structure An Effective Digital Approaches To Increase Business Growth Infographics Pdf
This slide provides information on the steps that can be followed by managers for effectively drafting a digital strategy. Steps covered are focusing on situational analysis, target market identification, content strategy development etc. The Steps To Structure An Effective Digital Approaches To Increase Business Growth Infographics Pdf is a compilation of the most recent design trends as a series of slides. It is suitable for any subject or industry presentation, containing attractive visuals and photo spots for businesses to clearly express their messages. This template contains a variety of slides for the user to input data, such as structures to contrast two elements, bullet points, and slides for written information. Slidegeeks is prepared to create an impression. This slide provides information on the steps that can be followed by managers for effectively drafting a digital strategy. Steps covered are focusing on situational analysis, target market identification, content strategy development etc.
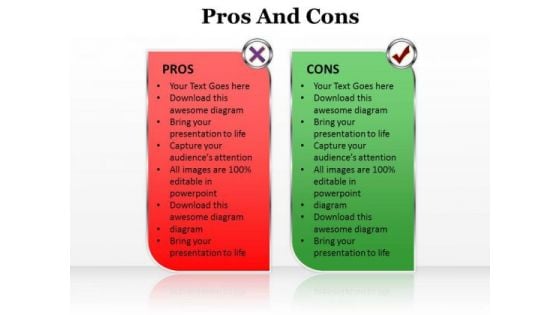
Ppt Pros And Cons Of The Topic Editable Communication Skills PowerPoint 1 Templates
PPT pros and cons of the topic editable communication skills powerpoint 1 Templates-This PowerPoint Diagram can be useful to show the Pros and Cons of a Particular topic which may be Pollution, Population, Global Warming or any other Business Topic.-Can be used for presentations on against, analysis, analyze, answer, background, bad, balance, billboard, black, blackboard, board, business, chalk, chalkboard, chart, choice, classroom, column, con, contra, data, decision, drawing, education, empty, finance, frame, good, graph, green, handwriting, illustration, list, measure, negative, office, positive, pro, profit, research, sketch, solution, space, statistics, stats, survey, text, words, yes-PPT pros and cons of the topic editable communication skills powerpoint 1 Templates Get executive with our Ppt Pros And Cons Of The Topic Editable Communication Skills PowerPoint 1 Templates. Manage assets to achieve the desired end.
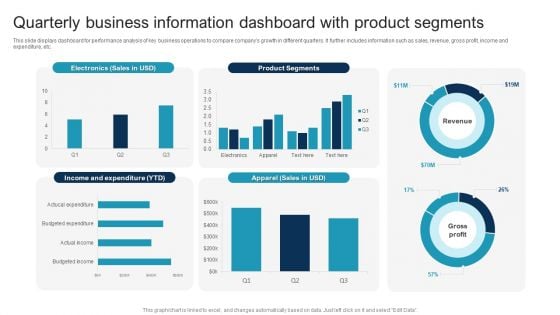
Quarterly Business Information Dashboard With Product Segments Slides PDF
This slide displays dashboard for performance analysis of key business operations to compare companys growth in different quarters. It further includes information such as sales, revenue, gross profit, income and expenditure, etc. Showcasing this set of slides titled Quarterly Business Information Dashboard With Product Segments Slides PDF. The topics addressed in these templates are Quarterly Business Information, Dashboard With Product Segments. All the content presented in this PPT design is completely editable. Download it and make adjustments in color, background, font etc. as per your unique business setting.
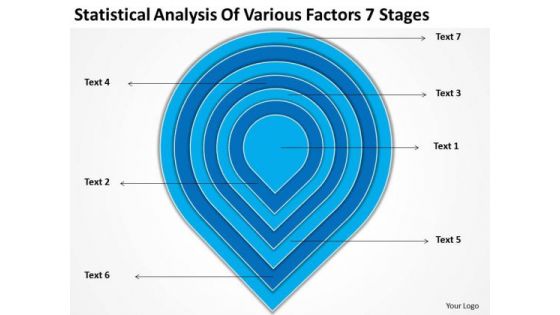
Analysis Of Various Factors 7 Stages Ppt Business Plan Example PowerPoint Templates
We present our analysis of various factors 7 stages ppt business plan example PowerPoint templates.Present our Process and Flows PowerPoint Templates because It can be used to Set your controls for the heart of the sun. Our PowerPoint Templates and Slides will be the propellant to get you there. Download and present our Business PowerPoint Templates because You have the co-ordinates for your destination of success. Let our PowerPoint Templates and Slides map out your journey. Present our Marketing PowerPoint Templates because It is Aesthetically crafted by artistic young minds. Our PowerPoint Templates and Slides are designed to display your dexterity. Use our Flow Charts PowerPoint Templates because Our PowerPoint Templates and Slides will effectively help you save your valuable time. They are readymade to fit into any presentation structure. Present our Shapes PowerPoint Templates because Our PowerPoint Templates and Slides offer you the widest possible range of options.Use these PowerPoint slides for presentations relating to Graphic, chart, pyramid, diagram, info, vector, round, bar, business, icon, button, website, demographic, document, sign, infochart, visual,presentation, glossy, bright, symbol, internet, circle, orange, data, element, abstract, graph, illustration, economic, pie, visualization, collection, rating,design, growth, set, infographic, banner, information, statistic, marketing. The prominent colors used in the PowerPoint template are Blue, Blue light, White. Pilot your journey with our Analysis Of Various Factors 7 Stages Ppt Business Plan Example PowerPoint Templates. Download without worries with our money back guaranteee.


 Continue with Email

 Home
Home


