data analytics
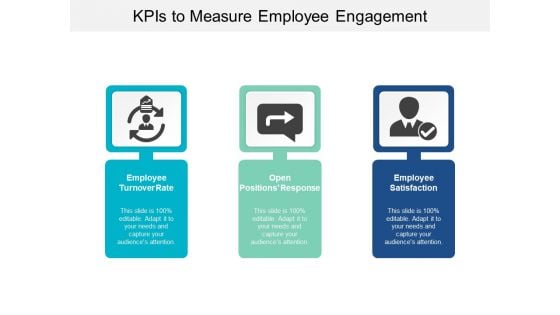
Kpis To Measure Employee Engagement Ppt Powerpoint Presentation Pictures Gridlines
This is a kpis to measure employee engagement ppt powerpoint presentation pictures gridlines. This is a three stage process. The stages in this process are dashboard, kpi, metrics.
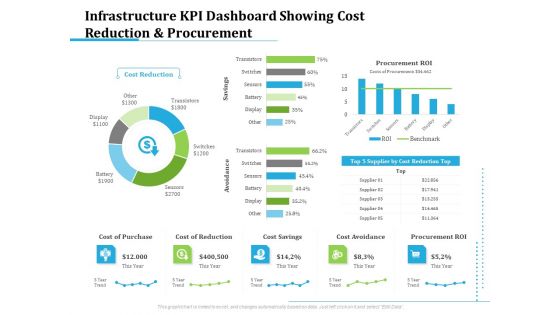
Information Technology Functions Management Infrastructure KPI Dashboard Showing Cost Reduction And Procurement Download PDF
Deliver an awe-inspiring pitch with this creative information technology functions management infrastructure kpi dashboard showing cost reduction and procurement download pdf bundle. Topics like cost reduction, cost purchase, cost reduction, cost savings, cost avoidance, procurement roi can be discussed with this completely editable template. It is available for immediate download depending on the needs and requirements of the user.
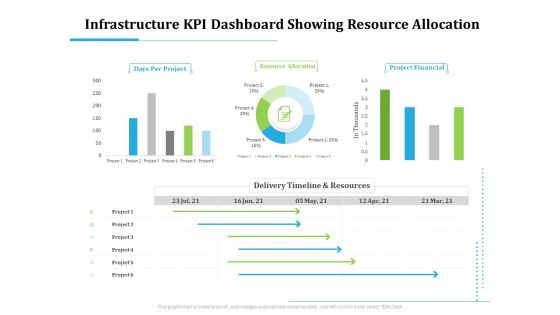
Information Technology Functions Management Infrastructure KPI Dashboard Showing Resource Allocation Background PDF
Deliver and pitch your topic in the best possible manner with this information technology functions management infrastructure kpi dashboard showing resource allocation background pdf. Use them to share invaluable insights on days per project, resource allocation, project financial, delivery timeline and resources and impress your audience. This template can be altered and modified as per your expectations. So, grab it now.
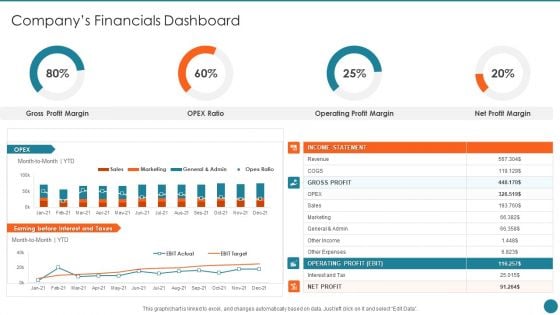
Business Overview Of An Information Technology Company Companys Financials Dashboard Themes PDF
Deliver an awe inspiring pitch with this creative Business Overview Of An Information Technology Company Companys Financials Dashboard Themes PDF bundle. Topics like Gross Profit, Operating Profit, Profit Margin can be discussed with this completely editable template. It is available for immediate download depending on the needs and requirements of the user.
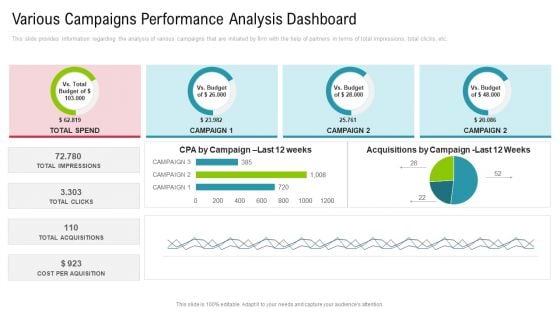
Co Variety Advertisement Various Campaigns Performance Analysis Dashboard Elements PDF
This slide provides information regarding the analysis of various campaigns that are initiated by firm with the help of partners in terms of total impressions, total clicks, etc. Deliver and pitch your topic in the best possible manner with this co variety advertisement various campaigns performance analysis dashboard elements pdf. Use them to share invaluable insights on various campaigns performance analysis dashboard and impress your audience. This template can be altered and modified as per your expectations. So, grab it now.
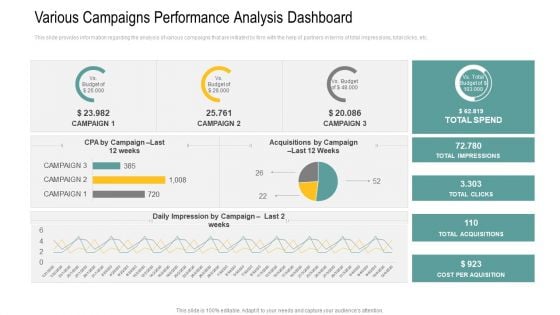
Various Campaigns Performance Analysis Dashboard Ppt Layouts Deck PDF
This slide provides information regarding the analysis of various campaigns that are initiated by firm with the help of partners in terms of total impressions, total clicks, etc. Deliver and pitch your topic in the best possible manner with this various campaigns performance analysis dashboard ppt layouts deck pdf. Use them to share invaluable insights on various campaigns performance analysis dashboard and impress your audience. This template can be altered and modified as per your expectations. So, grab it now.
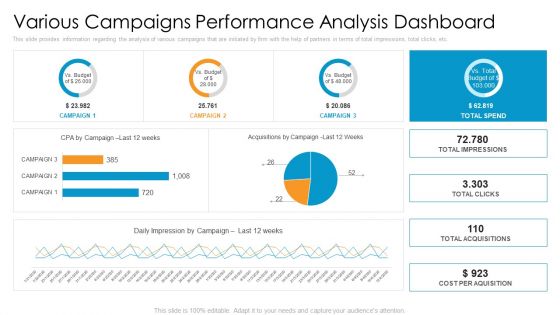
Partner Advertisement Strategy Various Campaigns Performance Analysis Dashboard Ideas PDF
This slide provides information regarding the analysis of various campaigns that are initiated by firm with the help of partners in terms of total impressions, total clicks, etc. Deliver an awe-inspiring pitch with this creative partner advertisement strategy various campaigns performance analysis dashboard ideas pdf bundle. Topics like various campaigns performance analysis dashboard can be discussed with this completely editable template. It is available for immediate download depending on the needs and requirements of the user.
Various Campaigns Performance Analysis Dashboard Ppt Icon Graphic Images PDF
This slide provides information regarding the analysis of various campaigns that are initiated by firm with the help of partners in terms of total impressions, total clicks, etc. Deliver and pitch your topic in the best possible manner with this various campaigns performance analysis dashboard ppt icon graphic images pdf. Use them to share invaluable insights on various campaigns performance analysis dashboard and impress your audience. This template can be altered and modified as per your expectations. So, grab it now.
Pareto Analysis Shipping Tracking Metrics Dashboard Guidelines PDF
This slide showcases dashboard for analyzing on-time delivery trends. It also includes KPIs such as Pareto analysis and on-time deliveries by shipping organizations. Pitch your topic with ease and precision using this Pareto Analysis Shipping Tracking Metrics Dashboard Guidelines PDF. This layout presents information on Pareto Analysis, Deliveries Trends, Shipping Organization. It is also available for immediate download and adjustment. So, changes can be made in the color, design, graphics or any other component to create a unique layout.
Implementing Marketing Strategies Content Marketing Dashboard For Effective Icons PDF
Purpose of the following slide is to show key metrics that can help the organization to track their content marketing efforts, these metrics are ad cost, visits, cost per click etc.. Whether you have daily or monthly meetings, a brilliant presentation is necessary. Implementing Marketing Strategies Content Marketing Dashboard For Effective Icons PDF can be your best option for delivering a presentation. Represent everything in detail using Implementing Marketing Strategies Content Marketing Dashboard For Effective Icons PDF and make yourself stand out in meetings. The template is versatile and follows a structure that will cater to your requirements. All the templates prepared by Slidegeeks are easy to download and edit. Our research experts have taken care of the corporate themes as well. So, give it a try and see the results.
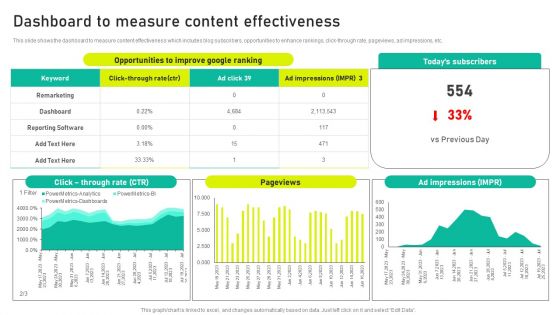
Dashboard To Measure Content Effectiveness Ppt Ideas Diagrams PDF
This slide shows the dashboard to measure content effectiveness which includes blog subscribers, opportunities to enhance rankings, click-through rate, pageviews, ad impressions, etc. Coming up with a presentation necessitates that the majority of the effort goes into the content and the message you intend to convey. The visuals of a PowerPoint presentation can only be effective if it supplements and supports the story that is being told. Keeping this in mind our experts created Dashboard To Measure Content Effectiveness Ppt Ideas Diagrams PDF to reduce the time that goes into designing the presentation. This way, you can concentrate on the message while our designers take care of providing you with the right template for the situation.
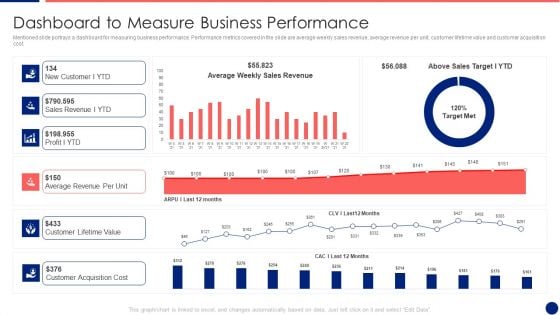
Information Technology Service Integration Post Acquisition Merger Dashboard To Measure Business Pictures PDF
Mentioned slide portrays a dashboard for measuring business performance. Performance metrics covered in the slide are average weekly sales revenue, average revenue per unit, customer lifetime value and customer acquisition cost. Deliver and pitch your topic in the best possible manner with this information technology service integration post acquisition merger dashboard to measure business pictures pdf. Use them to share invaluable insights on sales revenue, average, cost and impress your audience. This template can be altered and modified as per your expectations. So, grab it now.
IT Security Dashboard For Threat Tracking In Information Technology Security Ppt Inspiration Gallery PDF
This slide depicts the dashboard for threat tracking in cyber security by covering monthly threat status, current risk status, threat-based on the role, threats by owners, risk by threats, and threat report. Deliver an awe inspiring pitch with this creative it security dashboard for threat tracking in information technology security ppt inspiration gallery pdf bundle. Topics like current risk status, threat report, risk by threats, threats based on role, threats by owners can be discussed with this completely editable template. It is available for immediate download depending on the needs and requirements of the user.
Information Technology Change Implementation Plan Dashboard For Issues Tracking Clipart PDF
This slide shows the issues tracking the dashboard for the business transition project. It provides details of multiple issues faced by users to keep records for effective management of the project. Deliver an awe inspiring pitch with this creative Information Technology Change Implementation Plan Dashboard For Issues Tracking Clipart PDF bundle. Topics like Issues Failed Verification, Immediate Issues, High Churn Issues, Suspect Requirements, Failed Test Runs can be discussed with this completely editable template. It is available for immediate download depending on the needs and requirements of the user.
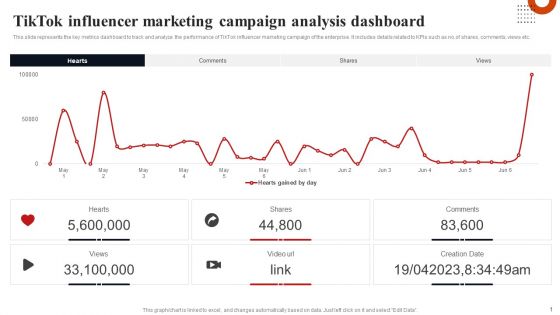
Tiktok Influencer Marketing Campaign Analysis Dashboard Formats PDF
This slide represents the key metrics dashboard to track and analyze the performance of TikTok influencer marketing campaign of the enterprise. It includes details related to KPIs such as no.of shares, comments, views etc. Formulating a presentation can take up a lot of effort and time, so the content and message should always be the primary focus. The visuals of the PowerPoint can enhance the presenters message, so our Tiktok Influencer Marketing Campaign Analysis Dashboard Formats PDF was created to help save time. Instead of worrying about the design, the presenter can concentrate on the message while our designers work on creating the ideal templates for whatever situation is needed. Slidegeeks has experts for everything from amazing designs to valuable content, we have put everything into Tiktok Influencer Marketing Campaign Analysis Dashboard Formats PDF.
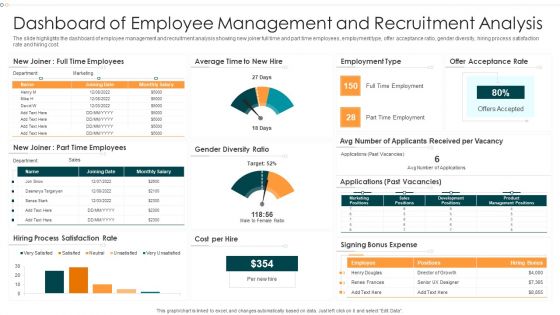
Dashboard Of Employee Management And Recruitment Analysis Infographics PDF
The slide highlights the dashboard of employee management and recruitment analysis showing new joiner full time and part time employees, employment type, offer acceptance ratio, gender diversity, hiring process satisfaction rate and hiring cost.Pitch your topic with ease and precision using this Dashboard Of Employee Management And Recruitment Analysis Infographics PDF This layout presents information on Dashboard Employee, Management, Recruitment Analysis It is also available for immediate download and adjustment. So, changes can be made in the color, design, graphics or any other component to create a unique layout.
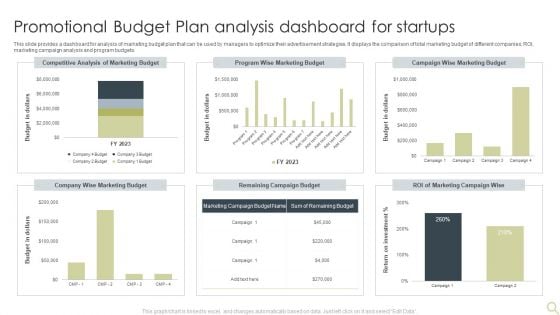
Promotional Budget Plan Analysis Dashboard For Startups Template PDF
This slide provides a dashboard for analysis of marketing budget plan that can be used by managers to optimize their advertisement strategies. It displays the comparison of total marketing budget of different companies, ROI, marketing campaign analysis and program budgets. Showcasing this set of slides titled Promotional Budget Plan Analysis Dashboard For Startups Template PDF. The topics addressed in these templates are Marketing Budget, Marketing Campaign, Competitive Analysis. All the content presented in this PPT design is completely editable. Download it and make adjustments in color, background, font etc. as per your unique business setting.
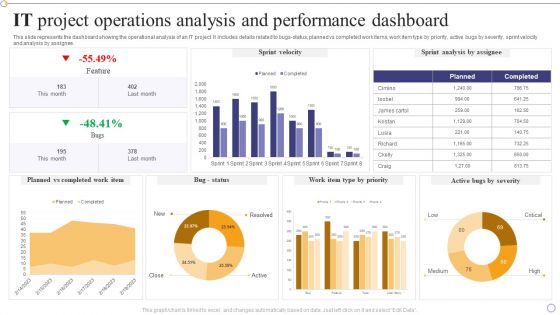
IT Project Operations Analysis And Performance Dashboard Themes PDF
This slide represents the dashboard showing the operational analysis of an IT project. It includes details related to bugs-status, planned vs completed work items, work item type by priority, active bugs by severity, sprint velocity and analysis by assignee.Showcasing this set of slides titled IT Project Operations Analysis And Performance Dashboard Themes PDF. The topics addressed in these templates are Planned Completed, Sprint Analysis, Feature. All the content presented in this PPT design is completely editable. Download it and make adjustments in color, background, font etc. as per your unique business setting.

Public Governance Risk Rating And Analysis Software Dashboard Brochure PDF
This slide covers the status report of risks and security breaches in government initiated public services. It includes risk analysis progress, risk assessment matrix, risk rating and action plan breakdown. Showcasing this set of slides titled Public Governance Risk Rating And Analysis Software Dashboard Brochure PDF. The topics addressed in these templates are Risk Rating Breakdown, Risks Analysis Progress, Analysis Software Dashboard. All the content presented in this PPT design is completely editable. Download it and make adjustments in color, background, font etc. as per your unique business setting.
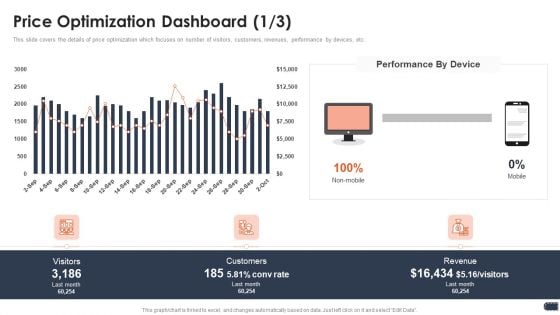
Business Pricing Model Price Optimization Dashboard Customers Information PDF
This slide covers the details of price optimization which focuses on number of visitors, customers, revenues, performance by devices, etc. Deliver and pitch your topic in the best possible manner with this business pricing model price optimization dashboard customers information pdf. Use them to share invaluable insights on visitors, customers, revenue and impress your audience. This template can be altered and modified as per your expectations. So, grab it now.
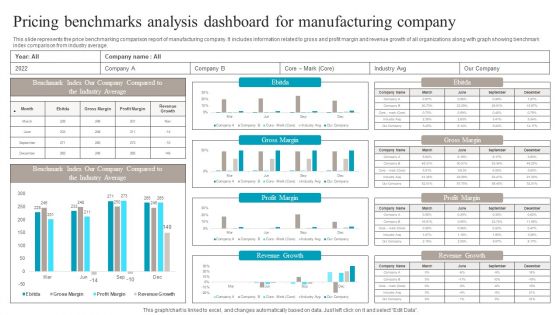
Pricing Benchmarks Analysis Dashboard For Manufacturing Company Structure PDF
This slide represents the price benchmarking comparison report of manufacturing company. It includes information related to gross and profit margin and revenue growth of all organizations along with graph showing benchmark index comparison from industry average. Pitch your topic with ease and precision using this Pricing Benchmarks Analysis Dashboard For Manufacturing Company Structure PDF. This layout presents information on Pricing Benchmarks Analysis, Dashboard For Manufacturing Company. It is also available for immediate download and adjustment. So, changes can be made in the color, design, graphics or any other component to create a unique layout.
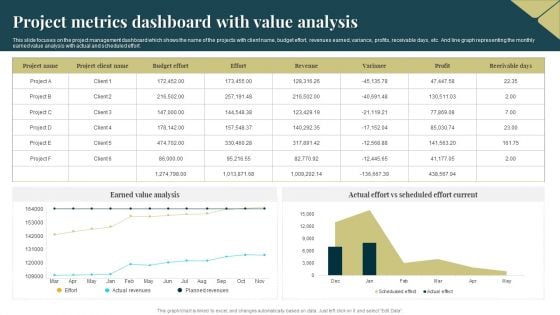
Project Metrics Dashboard With Value Analysis Introduction PDF
This slide focuses on the project management dashboard which shows the name of the projects with client name, budget effort, revenues earned, variance, profits, receivable days, etc. And line graph representing the monthly earned value analysis with actual and scheduled effort. Showcasing this set of slides titled Project Metrics Dashboard With Value Analysis Introduction PDF. The topics addressed in these templates are Budget Effort, Revenues, Earned Value Analysis. All the content presented in this PPT design is completely editable. Download it and make adjustments in color, background, font etc. as per your unique business setting.
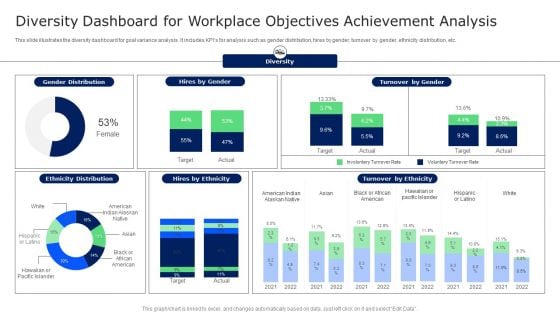
Diversity Dashboard For Workplace Objectives Achievement Analysis Microsoft PDF
This slide illustrates the diversity dashboard for goal variance analysis. It includes KPIs for analysis such as gender distribution, hires by gender, turnover by gender, ethnicity distribution, etc. Showcasing this set of slides titled Diversity Dashboard For Workplace Objectives Achievement Analysis Microsoft PDF. The topics addressed in these templates are Target, Involuntary Turnover Rate, Turnover By Ethnicity. All the content presented in this PPT design is completely editable. Download it and make adjustments in color, background, font etc. as per your unique business setting.
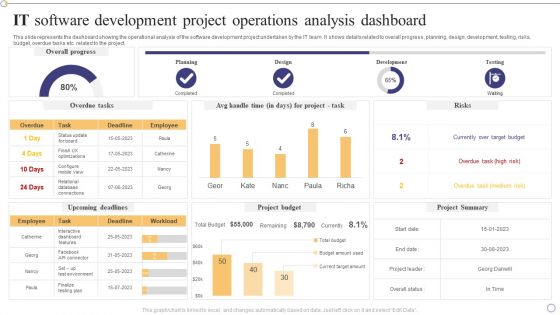
IT Software Development Project Operations Analysis Dashboard Pictures PDF
This slide represents the dashboard showing the operational analysis of the software development project undertaken by the IT team. It shows details related to overall progress, planning, design, development, testing, risks, budget, overdue tasks etc. related to the project.Pitch your topic with ease and precision using this IT Software Development Project Operations Analysis Dashboard Pictures PDF. This layout presents information on Interactive Dashboard, Currently Over Target, Overdue Task. It is also available for immediate download and adjustment. So, changes can be made in the color, design, graphics or any other component to create a unique layout.
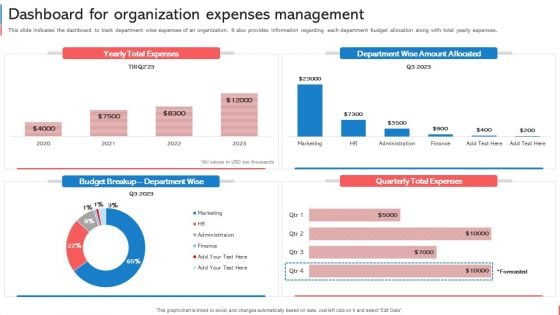
Company Budget Analysis Dashboard For Organization Expenses Management Graphics PDF
This slide indicates the dashboard to track department wise expenses of an organization. It also provides information regarding each department budget allocation along with total yearly expenses. Create an editable Company Budget Analysis Dashboard For Organization Expenses Management Graphics PDF that communicates your idea and engages your audience. Whether youre presenting a business or an educational presentation, pre-designed presentation templates help save time. Company Budget Analysis Dashboard For Organization Expenses Management Graphics PDF is highly customizable and very easy to edit, covering many different styles from creative to business presentations. Slidegeeks has creative team members who have crafted amazing templates. So, go and get them without any delay.
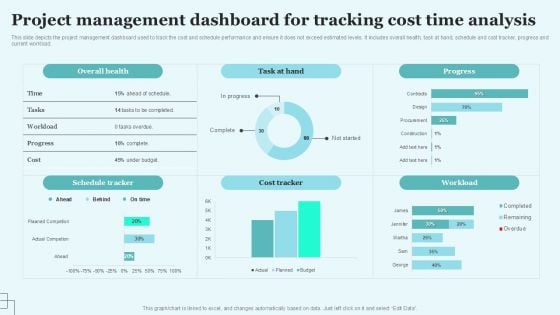
Project Management Dashboard For Tracking Cost Time Analysis Background PDF
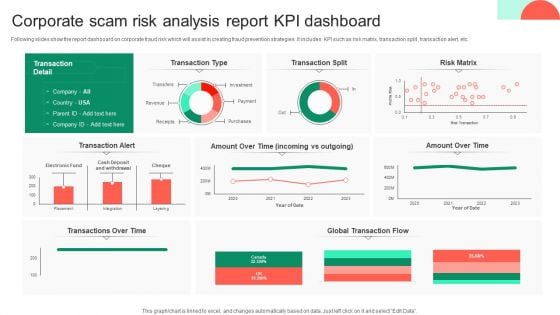
Corporate Scam Risk Analysis Report KPI Dashboard Themes PDF
Following slides show the report dashboard on corporate fraud risk which will assist in creating fraud prevention strategies .It includes KPI such as risk matrix, transaction split , transaction alert, etc. Pitch your topic with ease and precision using this Corporate Scam Risk Analysis Report KPI Dashboard Themes PDF. This layout presents information on Global Transaction Flow, Risk Matrix, Transaction Split, Analysis Report Kpi Dashboard. It is also available for immediate download and adjustment. So, changes can be made in the color, design, graphics or any other component to create a unique layout.
Commodity Category Analysis Kpis And Dashboard Ppt Styles Ideas PDF
Presenting commodity category analysis kpis and dashboard ppt styles ideas pdf to provide visual cues and insights. Share and navigate important information on four stages that need your due attention. This template can be used to pitch topics like sales metrics, service metrics, marketing metrics, dashboard. In addtion, this PPT design contains high resolution images, graphics, etc, that are easily editable and available for immediate download.

Monthly Profit And Loss Statement Reports Analysis Dashboard Brochure PDF
This slide shows a monthly profit and loss statement dashboard. The constituting elements herein are total net revenue, cost of goods sold and gross profit.Pitch your topic with ease and precision using this Monthly Profit And Loss Statement Reports Analysis Dashboard Brochure PDF. This layout presents information on Costs Good Sold, Earnings Before, Interest Expense. It is also available for immediate download and adjustment. So, changes can be made in the color, design, graphics or any other component to create a unique layout.
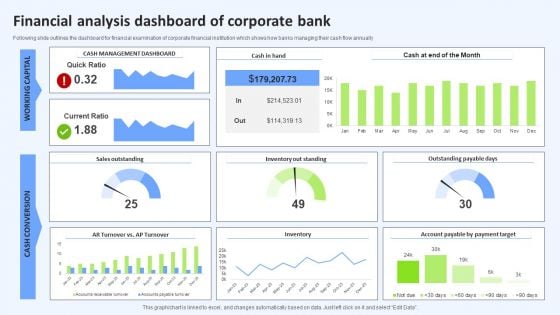
Financial Analysis Dashboard Of Corporate Bank Mockup PDF
Following slide outlines the dashboard for financial examination of corporate financial institution which shows how banks managing their cash flow annually Pitch your topic with ease and precision using this Financial Analysis Dashboard Of Corporate Bank Mockup PDF. This layout presents information on Month, Current Ratio, Inventory. It is also available for immediate download and adjustment. So, changes can be made in the color, design, graphics or any other component to create a unique layout.
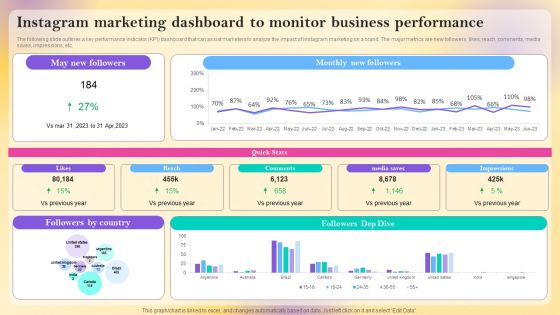
Instagram Marketing Dashboard To Monitor Business Performance Information PDF
The following slide outlines a key performance indicator KPI dashboard that can assist marketers to analyze the impact of Instagram marketing on a brand. The major metrics are new followers, likes, reach, comments, media saves, impressions, etc. This Instagram Marketing Dashboard To Monitor Business Performance Information PDF is perfect for any presentation, be it in front of clients or colleagues. It is a versatile and stylish solution for organizing your meetings. The product features a modern design for your presentation meetings. The adjustable and customizable slides provide unlimited possibilities for acing up your presentation. Slidegeeks has done all the homework before launching the product for you. So, do not wait, grab the presentation templates today
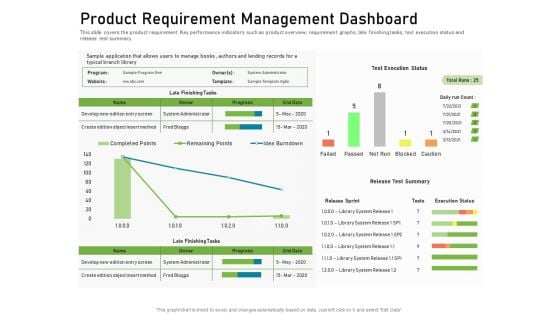
Product Requirement Management Dashboard Graphics PDF
This slide covers the product requirement Key performance indicators such as product overview, requirement graphs, late finishing tasks, text execution status and release test summary. Deliver and pitch your topic in the best possible manner with this product requirement management dashboard graphics pdf. Use them to share invaluable insights on product requirement management dashboard and impress your audience. This template can be altered and modified as per your expectations. So, grab it now.
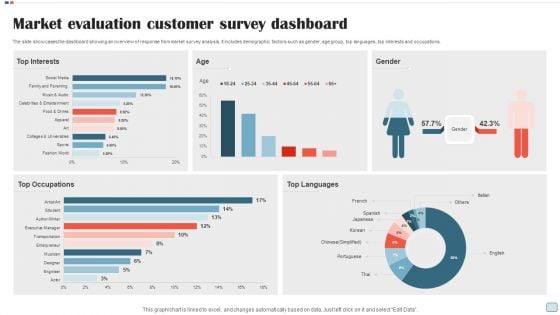
Market Evaluation Customer Survey Dashboard Topics PDF
The slide showcases the dashboard showing an overview of response from market survey analysis. It includes demographic factors such as gender, age group, top languages, top interests and occupations. Showcasing this set of slides titled Market Evaluation Customer Survey Dashboard Topics PDF. The topics addressed in these templates are Gender, Age Group, Top Languages, Top Interests And Occupations. All the content presented in this PPT design is completely editable. Download it and make adjustments in color, background, font etc. as per your unique business setting.
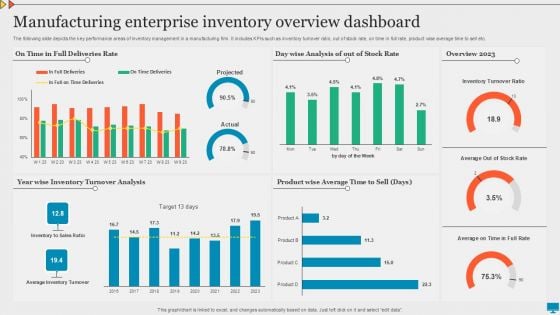
Manufacturing Enterprise Inventory Overview Dashboard Graphics PDF
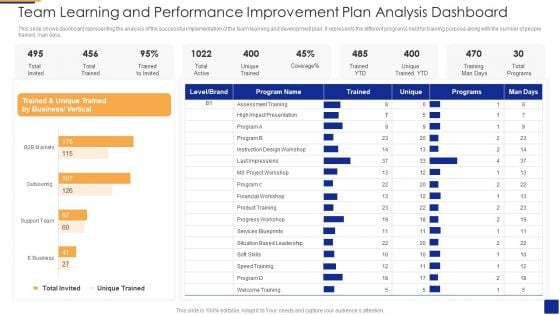
Team Learning And Performance Improvement Plan Analysis Dashboard Designs PDF
This slide shows dashboard representing the analysis of the successful implementation of the team learning and development plan. It represents the different programs held for training purpose along with the number of people trained, man days. Showcasing this set of slides titled Team Learning And Performance Improvement Plan Analysis Dashboard Designs PDF The topics addressed in these templates are Assessment Training, Business Or Vertical, Based Leadership All the content presented in this PPT design is completely editable. Download it and make adjustments in color, background, font etc. as per your unique business setting.
Financial Procedure Dashboard Indicating Yearly Revenue Analysis Icons PDF
This slide illustrates finance process dashboard indicating yearly revenue analysis which contains gross profit margin, operating profit ratio, net profit, revenue and cost of goods sold cogs operating expenses, etc. It can be referred by company owners who can compare it with previous years performance and make related decisions for future. Showcasing this set of slides titled Financial Procedure Dashboard Indicating Yearly Revenue Analysis Icons PDF. The topics addressed in these templates are Operating Profit Percentage, Net Profit Percentage, Operating Profit Ratio. All the content presented in this PPT design is completely editable. Download it and make adjustments in color, background, font etc. as per your unique business setting.
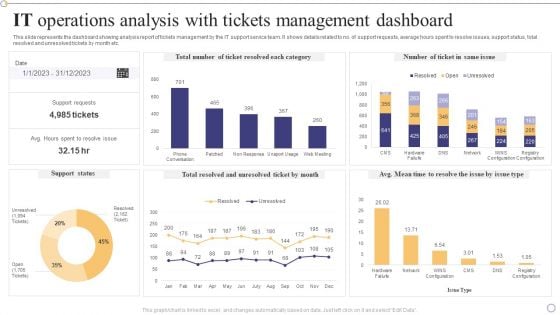
IT Operations Analysis With Tickets Management Dashboard Formats PDF
This slide represents the dashboard showing analysis report of tickets management by the IT support service team. It shows details related to no. of support requests, average hours spent to resolve issues, support status, total resolved and unresolved tickets by month etc.Showcasing this set of slides titled IT Operations Analysis With Tickets Management Dashboard Formats PDF. The topics addressed in these templates are Support Requests, Unresolved Ticket, Support Status. All the content presented in this PPT design is completely editable. Download it and make adjustments in color, background, font etc. as per your unique business setting.
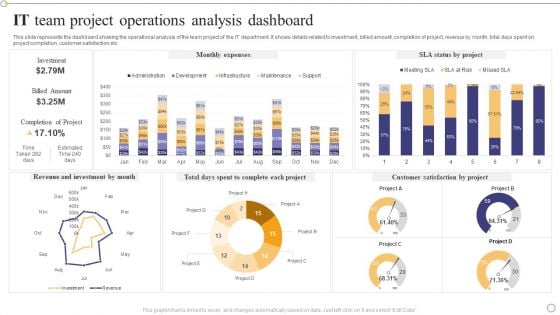
IT Team Project Operations Analysis Dashboard Clipart PDF
This slide represents the dashboard showing the operational analysis of the team project of the IT department. It shows details related to investment, billed amount, completion of project, revenue by month, total days spent on project completion, customer satisfaction etc.Showcasing this set of slides titled IT Team Project Operations Analysis Dashboard Clipart PDF. The topics addressed in these templates are Revenue Investment, Complete Each Project, Customer Satisfaction. All the content presented in this PPT design is completely editable. Download it and make adjustments in color, background, font etc. as per your unique business setting.
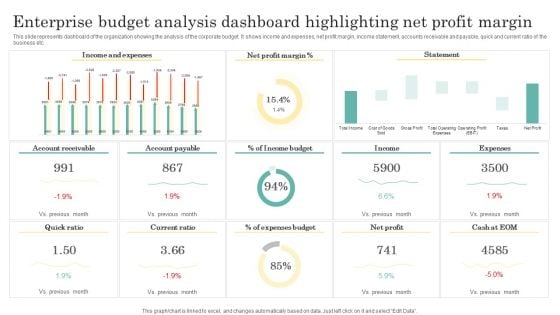
Enterprise Budget Analysis Dashboard Highlighting Net Profit Margin Clipart PDF
This slide represents dashboard of the organization showing the analysis of the corporate budget. It shows income and expenses, net profit margin, income statement, accounts receivable and payable, quick and current ratio of the business etc. Showcasing this set of slides titled Enterprise Budget Analysis Dashboard Highlighting Net Profit Margin Clipart PDF. The topics addressed in these templates are Income And Expenses, Net Profit Margin, Income Budget. All the content presented in this PPT design is completely editable. Download it and make adjustments in color, background, font etc. as per your unique business setting.
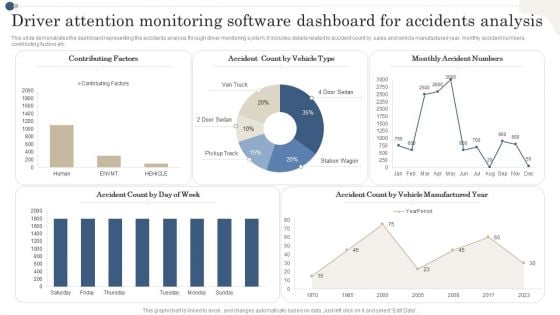
Driver Attention Monitoring Software Dashboard For Accidents Analysis Diagrams PDF
This slide demonstrates the dashboard representing the accidents analysis through driver monitoring system. It includes details related to accident count by sales and vehicle manufactured year, monthly accident numbers, contributing factors etc. Showcasing this set of slides titled Driver Attention Monitoring Software Dashboard For Accidents Analysis Diagrams PDF. The topics addressed in these templates are Contributing Factors,Vehicle Type, Monthly Accident Numbers. All the content presented in this PPT design is completely editable. Download it and make adjustments in color, background, font etc. as per your unique business setting.
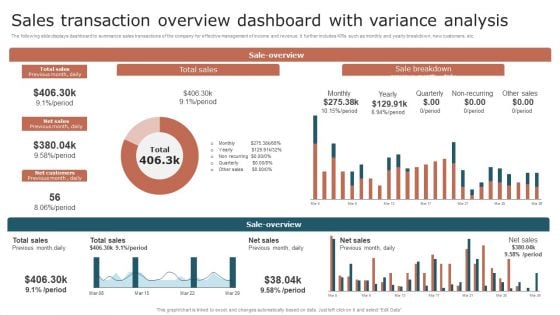
Sales Transaction Overview Dashboard With Variance Analysis Summary PDF
The following slide displays dashboard to summarize sales transactions of the company for effective management of income and revenue. It further includes KPIs such as monthly and yearly breakdown, new customers, etc. Showcasing this set of slides titled Sales Transaction Overview Dashboard With Variance Analysis Summary PDF. The topics addressed in these templates are Sales, Customers, Variance Analysis. All the content presented in this PPT design is completely editable. Download it and make adjustments in color, background, font etc. as per your unique business setting.
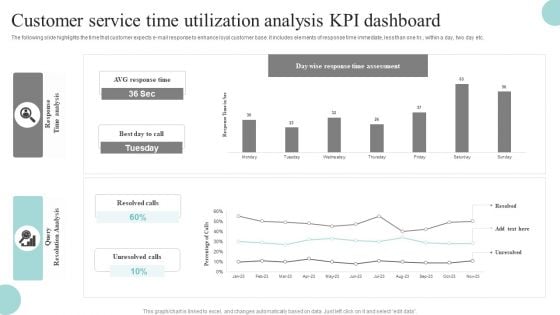
Customer Service Time Utilization Analysis Kpi Dashboard Designs PDF
The following slide highlights the time that customer expects e-mail response to enhance loyal customer base. It includes elements of response time immediate, less than one hr., within a day, two day etc. Showcasing this set of slides titled Customer Service Time Utilization Analysis Kpi Dashboard Designs PDF. The topics addressed in these templates are Customer Service, Time Utilization Analysis, KPI Dashboard. All the content presented in this PPT design is completely editable. Download it and make adjustments in color, background, font etc. as per your unique business setting.
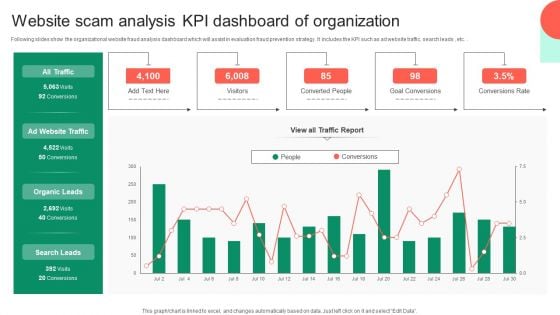
Website Scam Analysis KPI Dashboard Of Organization Sample PDF
Following slides show the organizational website fraud analysis dashboard which will assist in evaluation fraud prevention strategy. It includes the KPI such as ad website traffic, search leads , etc. Showcasing this set of slides titled Website Scam Analysis KPI Dashboard Of Organization Sample PDF. The topics addressed in these templates are Goal Conversions, Conversions Rate, Organic Leads. All the content presented in this PPT design is completely editable. Download it and make adjustments in color, background, font etc. as per your unique business setting.
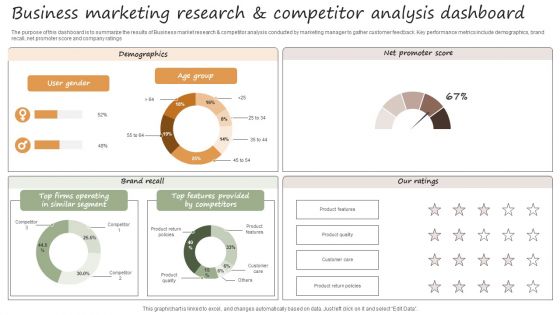
Usiness Marketing Research And Competitor Analysis Dashboard Sample PDF
The purpose of this dashboard is to summarize the results of Business market research and competitor analysis conducted by marketing manager to gather customer feedback. Key performance metrics include demographics, brand recall, net promoter score and company ratings. Showcasing this set of slides titled Usiness Marketing Research And Competitor Analysis Dashboard Sample PDF. The topics addressed in these templates are Brand Recall, Demographics, Net Promoter Score. All the content presented in this PPT design is completely editable. Download it and make adjustments in color, background, font etc. as per your unique business setting.
Workforce Productivity Tracking Report Dashboard Background PDF
The given below slide depicts the KPIs of work stream status to assess progress and stagnation. It includes elements such as budget, risk, action plan, work stream timeline, highlights etc. Showcasing this set of slides titled Workforce Productivity Tracking Report Dashboard Background PDF. The topics addressed in these templates are High Technology Turnover, Workforce Health Safety Risk, Plan Employee Training. All the content presented in this PPT design is completely editable. Download it and make adjustments in color, background, font etc. as per your unique business setting.
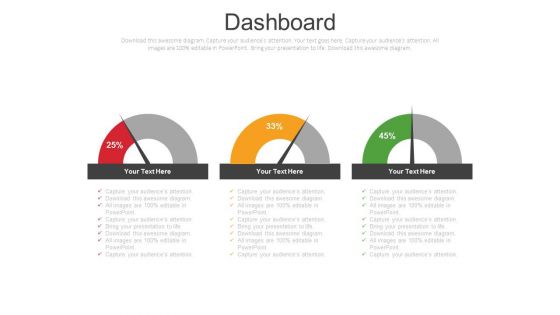
Parameters Of Growth And Development Powerpoint Slides
Dashboard design has been displayed in this business slide. This business diagram helps to exhibit parameters of growth and development. Download this PowerPoint template to build an exclusive presentation.
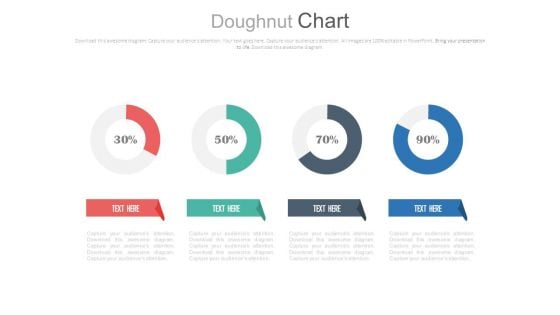
Four Circle Chart With Percentage Ratios Powerpoint Slides
This PowerPoint template has been designed with graphics of four circles and percentage ratios. You may use this dashboard slide design for topics like profit growth and financial planning. This PPT slide is powerful tool to describe your ideas.
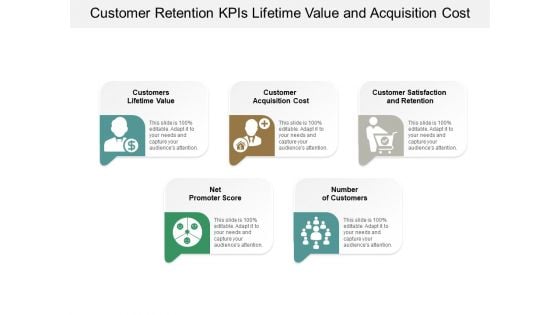
Customer Retention Kpis Lifetime Value And Acquisition Cost Ppt Powerpoint Presentation Model Samples
This is a customer retention kpis lifetime value and acquisition cost ppt powerpoint presentation model samples. This is a five stage process. The stages in this process are dashboard, kpi, metrics.
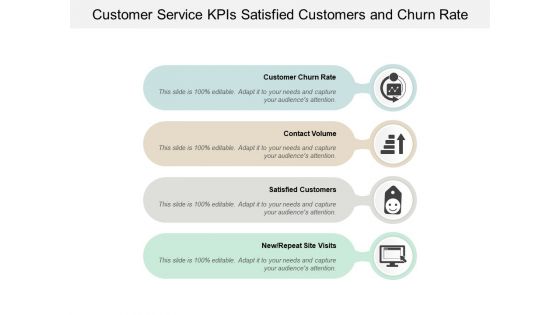
Customer Service Kpis Satisfied Customers And Churn Rate Ppt Powerpoint Presentation Pictures Template
This is a customer service kpis satisfied customers and churn rate ppt powerpoint presentation pictures template. This is a four stage process. The stages in this process are dashboard, kpi, metrics.

Financial Kpis For Business Growth Liquidity Efficiency And Solvency Ppt Powerpoint Presentation Summary Gridlines
This is a financial kpis for business growth liquidity efficiency and solvency ppt powerpoint presentation summary gridlines. This is a seven stage process. The stages in this process are dashboard, kpi, metrics.
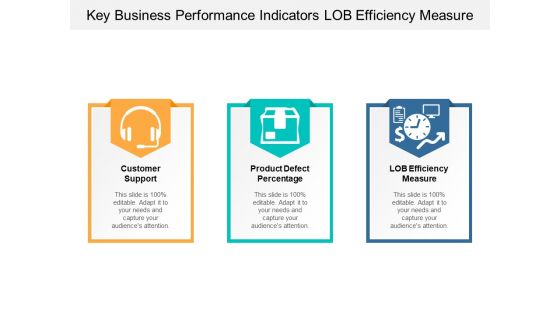
Key Business Performance Indicators Lob Efficiency Measure Ppt Powerpoint Presentation Infographics File Formats
This is a key business performance indicators lob efficiency measure ppt powerpoint presentation infographics file formats. This is a three stage process. The stages in this process are dashboard, kpi, metrics.
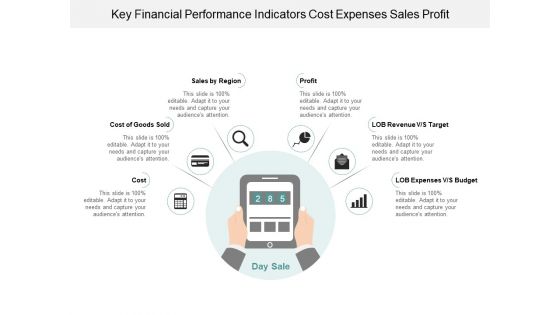
Key Financial Performance Indicators Cost Expenses Sales Profit Ppt Powerpoint Presentation Infographic Template Graphic Images
This is a key financial performance indicators cost expenses sales profit ppt powerpoint presentation infographic template graphic images. This is a six stage process. The stages in this process are dashboard, kpi, metrics.
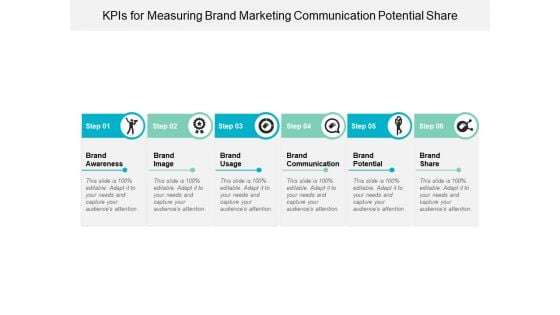
Kpis For Measuring Brand Marketing Communication Potential Share Ppt Powerpoint Presentation Layouts Infographics
This is a kpis for measuring brand marketing communication potential share ppt powerpoint presentation layouts infographics. This is a six stage process. The stages in this process are dashboard, kpi, metrics.
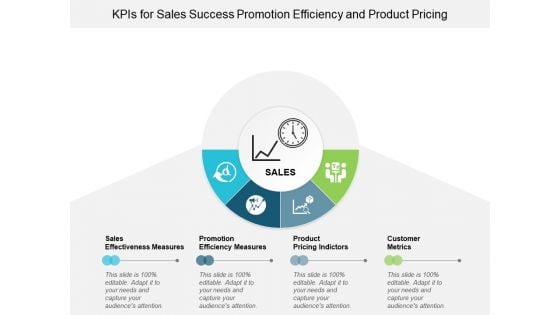
Kpis For Sales Success Promotion Efficiency And Product Pricing Ppt Powerpoint Presentation Infographics Background Images
This is a kpis for sales success promotion efficiency and product pricing ppt powerpoint presentation infographics background images. This is a four stage process. The stages in this process are dashboard, kpi, metrics.
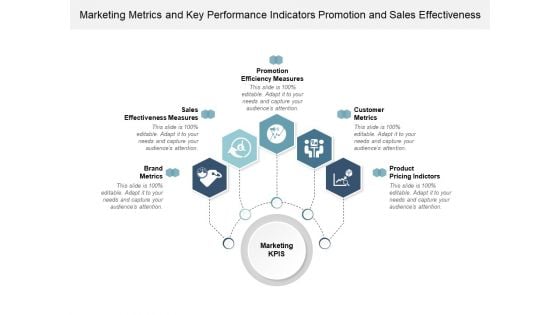
Marketing Metrics And Key Performance Indicators Promotion And Sales Effectiveness Ppt Powerpoint Presentation Infographics Graphics Example
This is a marketing metrics and key performance indicators promotion and sales effectiveness ppt powerpoint presentation infographics graphics example. This is a five stage process. The stages in this process are dashboard, kpi, metrics.
Performance Indicators Of Business Icons Ppt Powerpoint Presentation Infographics Graphics Template
This is a performance indicators of business icons ppt powerpoint presentation infographics graphics template. This is a four stage process. The stages in this process are dashboard, kpi, metrics.
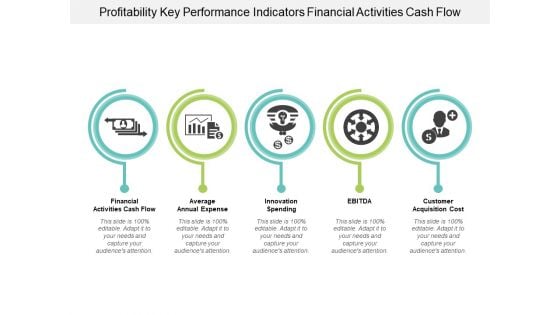
Profitability Key Performance Indicators Financial Activities Cash Flow Ppt Powerpoint Presentation Portfolio Clipart Images
This is a profitability key performance indicators financial activities cash flow ppt powerpoint presentation portfolio clipart images. This is a five stage process. The stages in this process are dashboard, kpi, metrics.
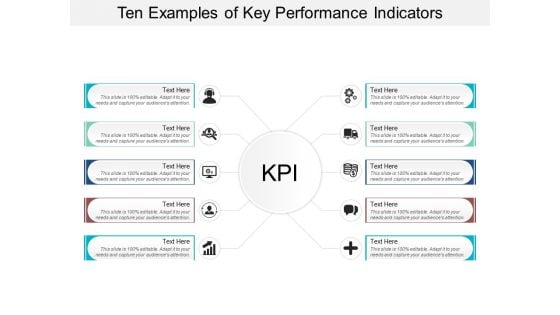
Ten Examples Of Key Performance Indicators Ppt Powerpoint Presentation Layouts Professional
This is a ten examples of key performance indicators ppt powerpoint presentation layouts professional. This is a ten stage process. The stages in this process are dashboard, kpi, metrics.
Business Strategic Performance Report Ppt Powerpoint Presentation Show Background Image
This is a business strategic performance report ppt powerpoint presentation show background image. This is a four stage process. The stages in this process are business metrics, business kpi, business dashboard.
Calculator With Business Reports For Operational Efficiency Ppt Powerpoint Presentation Ideas Infographic Template
This is a calculator with business reports for operational efficiency ppt powerpoint presentation ideas infographic template. This is a four stage process. The stages in this process are business metrics, business kpi, business dashboard.


 Continue with Email

 Home
Home


