data analytics
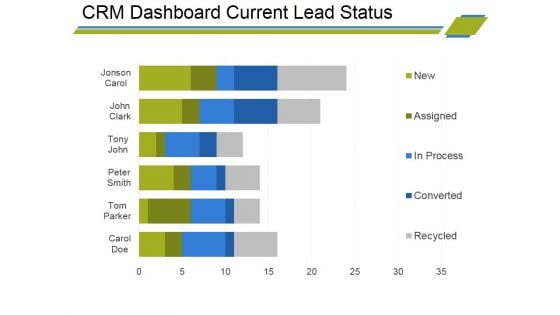
Crm Dashboard Current Lead Status Ppt PowerPoint Presentation Infographic Template Visual Aids
This is a crm dashboard current lead status ppt powerpoint presentation infographic template visual aids. This is a six stage process. The stages in this process are bar graph, finance, marketing, strategy, business, analysis.
Crm Dashboard Deals By Expected Close Date Ppt PowerPoint Presentation Portfolio Icons
This is a crm dashboard deals by expected close date ppt powerpoint presentation portfolio icons. This is a three stage process. The stages in this process are bar graph, finance, marketing, strategy, business, analysis, growth.
Supply Chain Kpi Dashboard Ppt PowerPoint Presentation Complete Deck With Slides
This is a supply chain kpi dashboard ppt powerpoint presentation complete deck with slides. This is a one stage process. The stages in this process are business, strategy, marketing, analysis, business model.
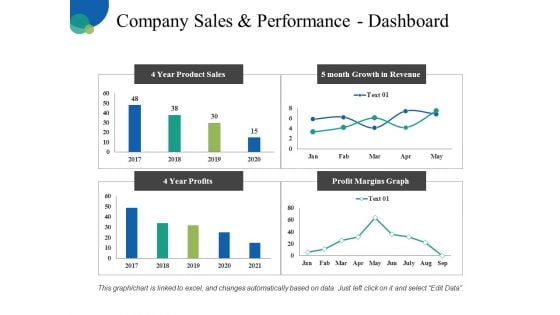
Company Sales And Performance Dashboard Ppt PowerPoint Presentation Pictures Infographic Template
This is a company sales and performance dashboard ppt powerpoint presentation pictures infographic template. This is a four stage process. The stages in this process are business, finance, analysis, management, marketing.
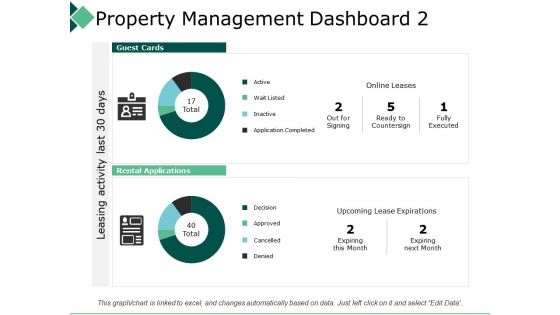
Property Management Dashboard 2 Leasing Activity Ppt PowerPoint Presentation Infographic Template Templates
This is a property management dashboard 2 leasing activity ppt powerpoint presentation infographic template templates. This is a two stage process. The stages in this process are business, management, strategy, analysis, marketing.
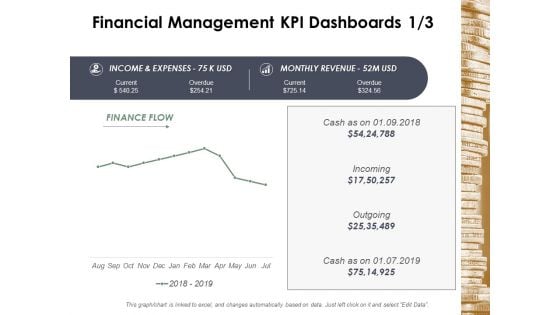
Financial Management Kpi Dashboards Business Ppt Powerpoint Presentation Infographic Template Deck
This is a financial management kpi dashboards business ppt powerpoint presentation infographic template deck. This is a four stage process. The stages in this process are finance, marketing, management, investment, analysis.
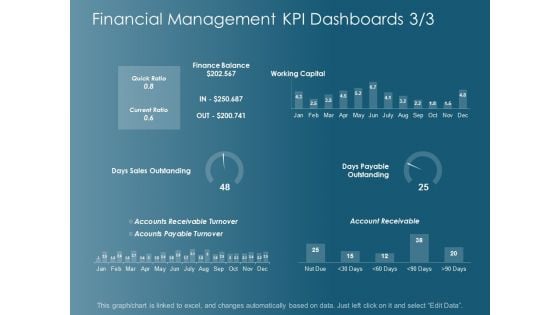
Financial Management Kpi Dashboards Strategy Ppt Powerpoint Presentation Gallery Graphics Template
This is a financial management kpi dashboards strategy ppt powerpoint presentation gallery graphics template. This is a six stage process. The stages in this process are finance, marketing, management, investment, analysis.
Dashboard Low Medium Ppt Powerpoint Presentation Infographics Icons Ppt Powerpoint Presentation Layouts Format
This is a dashboard low medium ppt powerpoint presentation infographics icons ppt powerpoint presentation layouts format. This is a three stage process. The stages in this process are finance, marketing, management, investment, analysis.
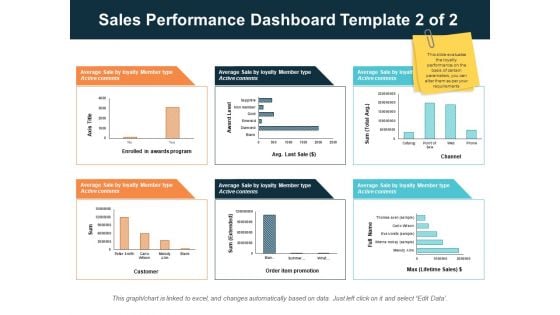
Sales Performance Dashboard Template 2 Of 2 Ppt PowerPoint Presentation Infographics Design Inspiration
This is a sales performance dashboard template 2 of 2 ppt powerpoint presentation infographics design inspiration. This is a three stage process. The stages in this process are finance, management, strategy, analysis, marketing.

Retail KPI Dashboard Showing Revenue Vs Units Sold Ppt PowerPoint Presentation Professional Smartart
This is a retail kpi dashboard showing revenue vs units sold ppt powerpoint presentation professional smartart. This is a four stage process. The stages in this process are finance, analysis, business, investment, marketing.
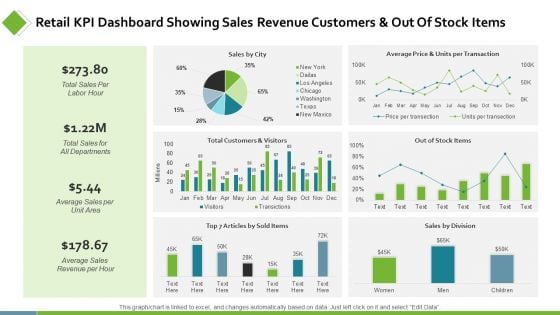
Retail KPI Dashboard Showing Sales Revenue Customers Ppt PowerPoint Presentation Show Background Designs
This is a retail kpi dashboard showing sales revenue customers ppt powerpoint presentation show background designs. This is a six stage process. The stages in this process are finance, analysis, business, investment, marketing.
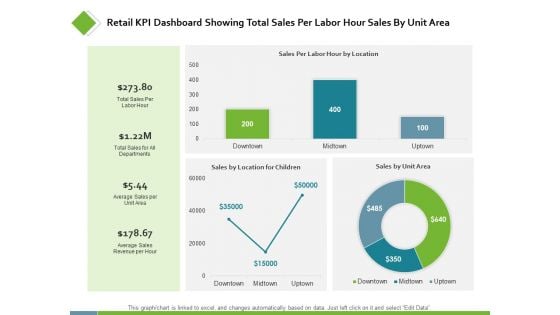
Retail KPI Dashboard Showing Total Sales Per Labor Ppt PowerPoint Presentation Styles Examples
This is a retail kpi dashboard showing total sales per labor ppt powerpoint presentation styles examples. This is a three stage process. The stages in this process are finance, analysis, business, investment, marketing.
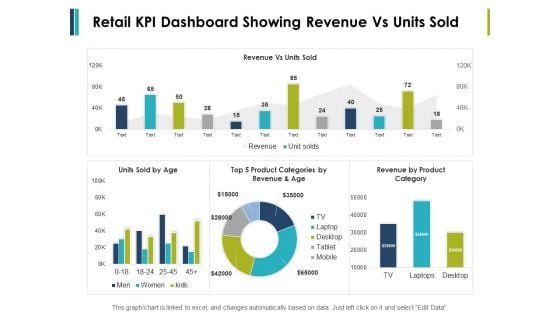
Retail Kpi Dashboard Showing Revenue Vs Units Sold Ppt PowerPoint Presentation File Formats
This is a retail kpi dashboard showing revenue vs units sold ppt powerpoint presentation file formats. This is a three stage process. The stages in this process are finance, marketing, management, investment, analysis.

Project Management Monthly Growth Dashboard Marketing Ppt PowerPoint Presentation Model Slide Download
This is a project management monthly growth dashboard marketing ppt powerpoint presentation model slide download. This is a four stage process. The stages in this process are finance, marketing, management, investment, analysis.
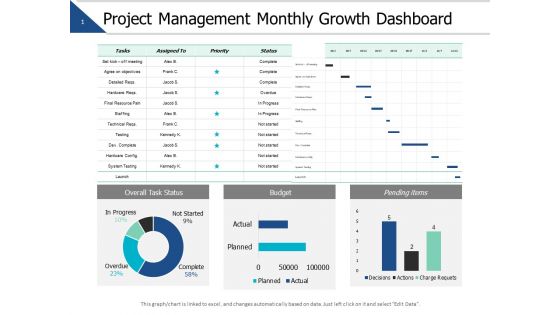
Project Management Monthly Growth Dashboard Ppt PowerPoint Presentation Slides Master Slide
This is a project management monthly growth dashboard ppt powerpoint presentation slides master slide. This is a three stage process. The stages in this process are finance, marketing, management, investment, analysis.
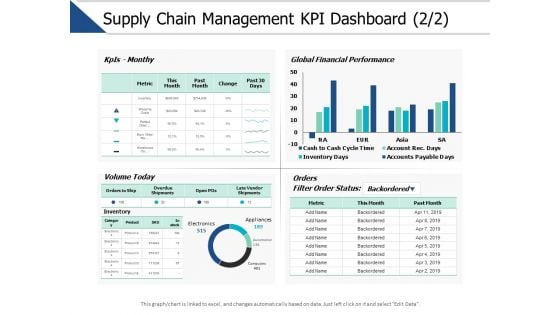
Supply Chain Management Kpi Dashboard Marketing Ppt PowerPoint Presentation File Tips
This is a supply chain management kpi dashboard marketing ppt powerpoint presentation file tips. This is a three stage process. The stages in this process are finance, marketing, management, investment, analysis.
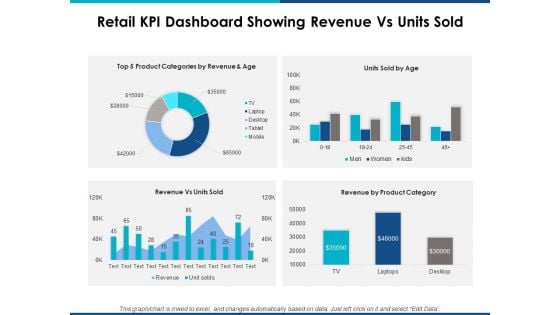
Retail Kpi Dashboard Showing Revenue Vs Units Sold Ppt Powerpoint Presentation Layouts Show
This is a retail kpi dashboard showing revenue vs units sold ppt powerpoint presentation layouts show. This is a four stage process. The stages in this process are finance, marketing, management, investment, analysis.
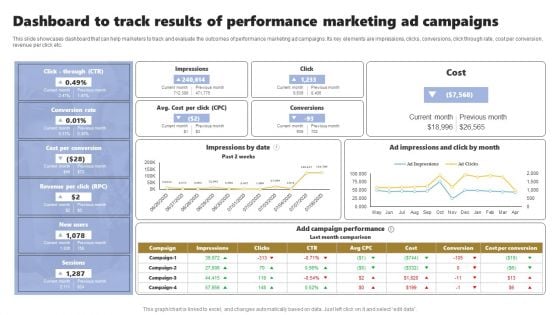
Acquiring Clients Through Search Engine And Native Ads Dashboard To Track Results Of Performance Marketing Information PDF
This slide showcases dashboard that can help marketers to track and evaluate the outcomes of performance marketing ad campaigns. Its key elements are impressions, clicks, conversions, click through rate, cost per conversion, revenue per click etc. Present like a pro with Acquiring Clients Through Search Engine And Native Ads Dashboard To Track Results Of Performance Marketing Information PDF Create beautiful presentations together with your team, using our easy to use presentation slides. Share your ideas in real time and make changes on the fly by downloading our templates. So whether you are in the office, on the go, or in a remote location, you can stay in sync with your team and present your ideas with confidence. With Slidegeeks presentation got a whole lot easier. Grab these presentations today.
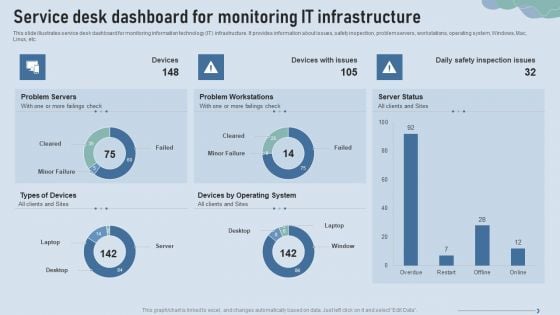
Improve IT Service Desk Service Desk Dashboard For Monitoring IT Infrastructure Introduction PDF
This slide illustrates service desk dashboard for monitoring information technology IT infrastructure. It provides information about issues, safety inspection, problem servers, workstations, operating system, Windows, Mac, Linux, etc.Deliver and pitch your topic in the best possible manner with this Improve IT Service Desk Service Desk Dashboard For Monitoring IT Infrastructure Introduction PDF. Use them to share invaluable insights on Problem Servers, Problem Workstations, Operating System and impress your audience. This template can be altered and modified as per your expectations. So, grab it now.
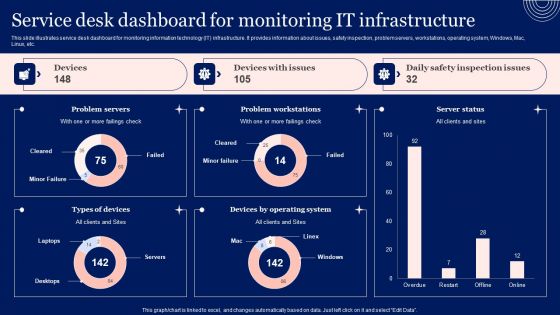
Implementing Advanced Service Help Desk Administration Program Service Desk Dashboard For Monitoring It Infrastructure Summary PDF
This slide illustrates service desk dashboard for monitoring information technology IT infrastructure. It provides information about issues, safety inspection, problem servers, workstations, operating system, Windows, Mac, Linux, etc. Take your projects to the next level with our ultimate collection of Implementing Advanced Service Help Desk Administration Program Service Desk Dashboard For Monitoring It Infrastructure Summary PDF. Slidegeeks has designed a range of layouts that are perfect for representing task or activity duration, keeping track of all your deadlines at a glance. Tailor these designs to your exact needs and give them a truly corporate look with your own brand colors they will make your projects stand out from the rest
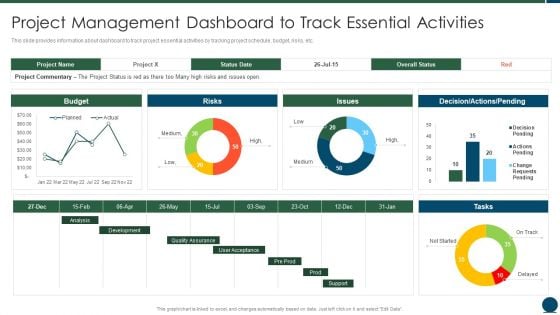
Project Scope Management Playbook Project Management Dashboard To Track Essential Activities Background PDF
This slide provides information about dashboard to track project essential activities by tracking project schedule, budget, risks, etc. Deliver an awe inspiring pitch with this creative Project Scope Management Playbook Project Management Dashboard To Track Essential Activities Background PDF bundle. Topics like Quality Assurance, Development, Analysis can be discussed with this completely editable template. It is available for immediate download depending on the needs and requirements of the user.
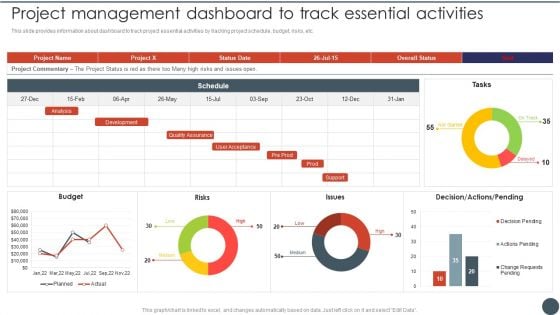
Project Team Engagement Tasks Project Management Dashboard To Track Essential Activities Demonstration PDF
This slide provides information about dashboard to track project essential activities by tracking project schedule, budget, risks, etc.Deliver an awe inspiring pitch with this creative Project Team Engagement Tasks Project Management Dashboard To Track Essential Activities Demonstration PDF bundle. Topics like Quality Assurance, Development, Analysis can be discussed with this completely editable template. It is available for immediate download depending on the needs and requirements of the user.
Insurance Claim Procedure Tracking Dashboard Ppt PowerPoint Presentation Show Samples PDF
This slide showcases the insurance claim process tracking dashboard. It includes elements such as claim amount, payout and denied claims and status analysis.Pitch your topic with ease and precision using this Insurance Claim Procedure Tracking Dashboard Ppt PowerPoint Presentation Show Samples PDF. This layout presents information on Amount Comparison, Claim Expense, Assured Amount. It is also available for immediate download and adjustment. So, changes can be made in the color, design, graphics or any other component to create a unique layout.
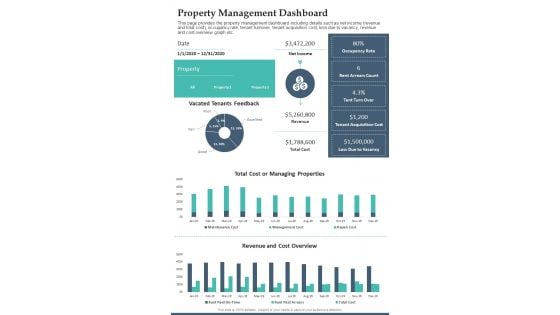
Property Management Dashboard One Pager Documents
This page provides the property management dashboard including details such as net income revenue and total cost, occupancy rate, tenant turnover, tenant acquisition cost, loss due to vacancy, revenue and cost overview graph etc. Presenting you an exemplary Property Management Dashboard One Pager Documents. Our one-pager comprises all the must-have essentials of an inclusive document. You can edit it with ease, as its layout is completely editable. With such freedom, you can tweak its design and other elements to your requirements. Download this Property Management Dashboard One Pager Documents brilliant piece now.
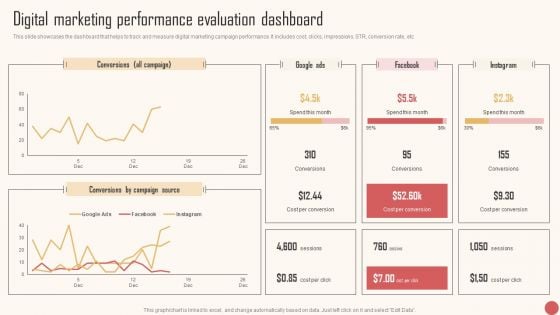
Digital Marketing Performance Evaluation Dashboard Microsoft PDF
This slide showcases the dashboard that helps to track and measure digital marketing campaign performance. It includes cost, clicks, impressions, STR, conversion rate, etc. Create an editable Digital Marketing Performance Evaluation Dashboard Microsoft PDF that communicates your idea and engages your audience. Whether you are presenting a business or an educational presentation, pre-designed presentation templates help save time. Digital Marketing Performance Evaluation Dashboard Microsoft PDF is highly customizable and very easy to edit, covering many different styles from creative to business presentations. Slidegeeks has creative team members who have crafted amazing templates. So, go and get them without any delay.
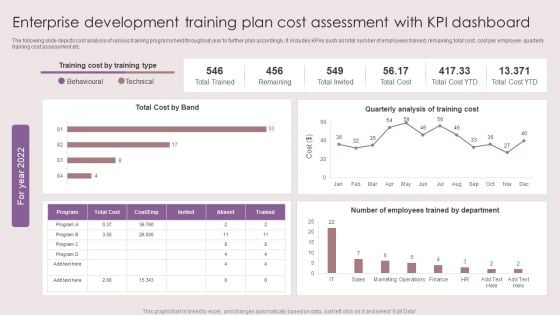
Enterprise Development Training Plan Cost Assessment With KPI Dashboard Mockup PDF
The following slide depicts cost analysis of various training programs held throughout year to further plan accordingly. It includes KPAs such as total number of employees trained, remaining, total cost, cost per employee, quarterly training cost assessment etc. Showcasing this set of slides titled Enterprise Development Training Plan Cost Assessment With KPI Dashboard Mockup PDF. The topics addressed in these templates are Total Cost Band, Quarterly Analysis, Training Cost. All the content presented in this PPT design is completely editable. Download it and make adjustments in color, background, font etc. as per your unique business setting.
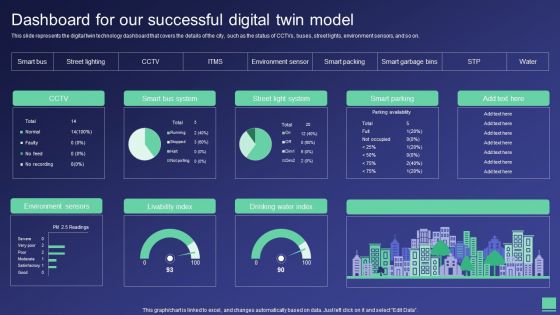
Digital Twin Tech IT Dashboard For Our Successful Digital Twin Model Ppt Layouts Grid PDF
This slide represents the digital twin technology dashboard that covers the details of the city, such as the status of CCTVs, buses, street lights, environment sensors, and so on. Boost your pitch with our creative Digital Twin Tech IT Dashboard For Our Successful Digital Twin Model Ppt Layouts Grid PDF. Deliver an awe-inspiring pitch that will mesmerize everyone. Using these presentation templates you will surely catch everyones attention. You can browse the ppts collection on our website. We have researchers who are experts at creating the right content for the templates. So you dont have to invest time in any additional work. Just grab the template now and use them.
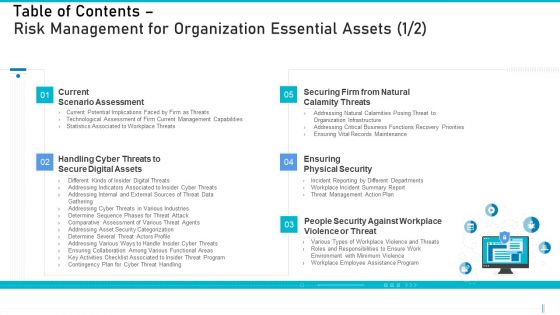
Table Of Contents Risk Management For Organization Essential Assets Priorities Infographics PDF
This is a table of contents risk management for organization essential assets priorities infographics pdf template with various stages. Focus and dispense information on five stages using this creative set, that comes with editable features. It contains large content boxes to add your information on topics like leveraging workforce, dashboard, impact assessment, budget assessment, ensuring financial assets security. You can also showcase facts, figures, and other relevant content using this PPT layout. Grab it now.
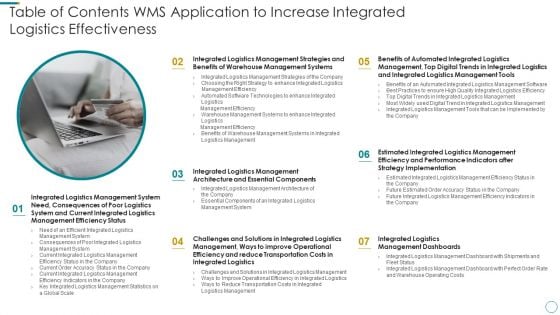
Table Of Contents WMS Application To Increase Integrated Logistics Effectiveness Background PDF
This is a table of contents wms application to increase integrated logistics effectiveness background pdf template with various stages. Focus and dispense information on seven stages using this creative set, that comes with editable features. It contains large content boxes to add your information on topics like management, dashboards, strategy, implementation, operational efficiency. You can also showcase facts, figures, and other relevant content using this PPT layout. Grab it now.
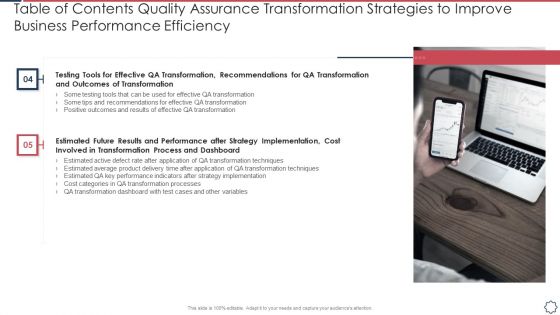
Table Of Contents Quality Assurance Transformation Strategies To Improve Business Performance Efficiency Formats PDF
This is a table of contents quality assurance transformation strategies to improve business performance efficiency formats pdf template with various stages. Focus and dispense information on two stages using this creative set, that comes with editable features. It contains large content boxes to add your information on topics like transformation process and dashboard, outcomes of transformation. You can also showcase facts, figures, and other relevant content using this PPT layout. Grab it now.
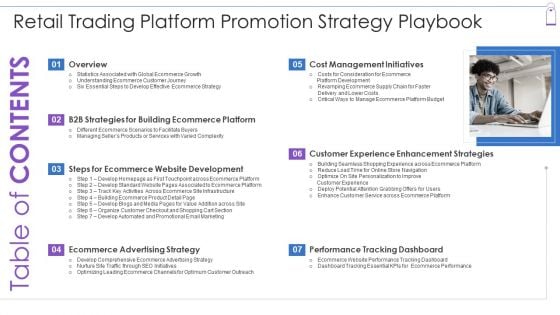
Table Of Contents Retail Trading Platform Promotion Strategy Playbook Slide4 Elements PDF
This is a table of contents retail trading platform promotion strategy playbook slide4 elements pdf template with various stages. Focus and dispense information on seven stages using this creative set, that comes with editable features. It contains large content boxes to add your information on topics like b2b strategies, building ecommerce platform, ecommerce advertising strategy, performance tracking dashboard. You can also showcase facts, figures, and other relevant content using this PPT layout. Grab it now.
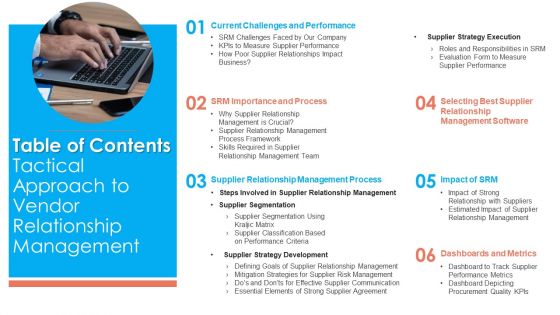
Table Of Contents Tactical Approach To Vendor Relationship Management Topics PDF
This is a Table Of Contents Tactical Approach To Vendor Relationship Management Topics PDF template with various stages. Focus and dispense information on six stages using this creative set, that comes with editable features. It contains large content boxes to add your information on topics like Supplier Strategy Execution, Impact Of SRM, Dashboards And Metrics You can also showcase facts, figures, and other relevant content using this PPT layout. Grab it now.
Business Process Flow Diagram Communication PowerPoint Templates Ppt Backgrounds For Slides
We present our business process flow diagram communication PowerPoint templates PPT backgrounds for slides.Present our Globe PowerPoint Templates because Our PowerPoint Templates and Slides will let your ideas bloom. Create a bed of roses for your audience. Use our Earth PowerPoint Templates because Our PowerPoint Templates and Slides are created by a hardworking bunch of busybees. Always flitting around with solutions gauranteed to please. Use our Success PowerPoint Templates because It can Conjure up grand ideas with our magical PowerPoint Templates and Slides. Leave everyone awestruck by the end of your presentation. Download our Business PowerPoint Templates because you can Set pulses racing with our PowerPoint Templates and Slides. They will raise the expectations of your team. Download and present our Shapes PowerPoint Templates because Our PowerPoint Templates and Slides are aesthetically designed to attract attention. We gaurantee that they will grab all the eyeballs you need.Use these PowerPoint slides for presentations relating to 3d, abstract, america, analyzing, background, business, communication, concept, continent, curiosity, data, discovery, earth, equipment, europe, figure, find, focus, glass, global, globe, human, icon, idea, illustration, instrument, internet, isolated, lens, loupe, magnify, magnifying, man, map, object, pattern, people, person, planet, research, science, search, study, symbol, tool, web, white, work. The prominent colors used in the PowerPoint template are Red, Green, White. Customers tell us our business process flow diagram communication PowerPoint templates PPT backgrounds for slides are topically designed to provide an attractive backdrop to any subject. We assure you our continent PowerPoint templates and PPT Slides will help them to explain complicated concepts. Customers tell us our business process flow diagram communication PowerPoint templates PPT backgrounds for slides will help them to explain complicated concepts. Use our business PowerPoint templates and PPT Slides look good visually. PowerPoint presentation experts tell us our business process flow diagram communication PowerPoint templates PPT backgrounds for slides effectively help you save your valuable time. You can be sure our concept PowerPoint templates and PPT Slides will help them to explain complicated concepts. Decrease conflict with your thoughts.Enable communication with our Business Process Flow Diagram Communication PowerPoint Templates Ppt Backgrounds For Slides.
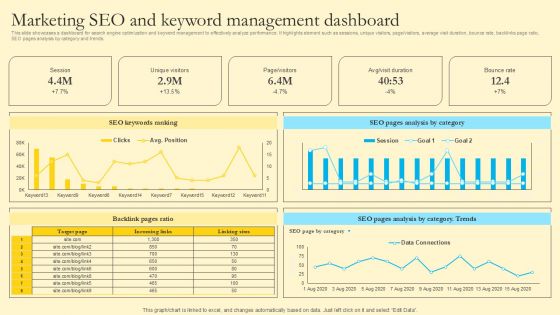
Comprehensive Guide For Sales And Advertising Processes Marketing SEO And Keyword Management Dashboard Pictures PDF
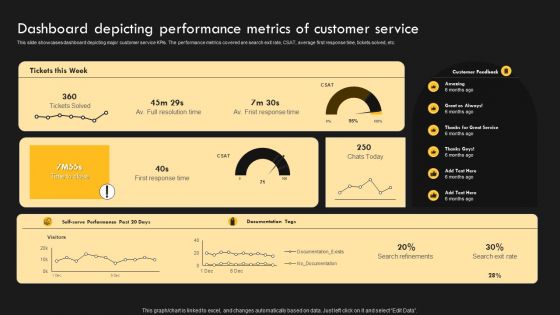
Service Improvement Techniques For Client Retention Dashboard Depicting Performance Metrics Diagrams PDF
This slide provides an overview of customer feedback survey conducted to evaluate their satisfaction level. It includes description, steps and benefits which are measure customer satisfaction This modern and well arranged Service Improvement Techniques For Client Retention Dashboard Depicting Performance Metrics Diagrams PDF provides lots of creative possibilities. It is very simple to customize and edit with the Powerpoint Software. Just drag and drop your pictures into the shapes. All facets of this template can be edited with Powerpoint no extra software is necessary. Add your own material, put your images in the places assigned for them, adjust the colors, and then you can show your slides to the world, with an animated slide included.
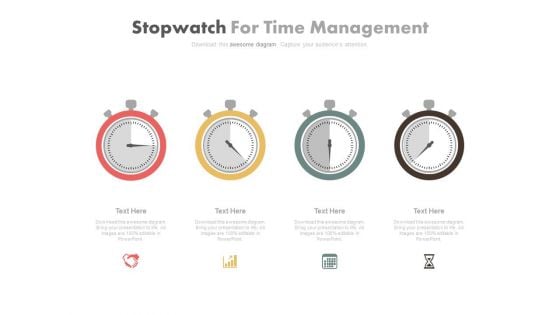
Dashboard Diagram For Time Management Powerpoint Slides
This PPT slide has been designed with graphics of four stop watches. You may sue this PowerPoint template for time management. This dashboard slide may useful for multilevel status report creation and approval process.
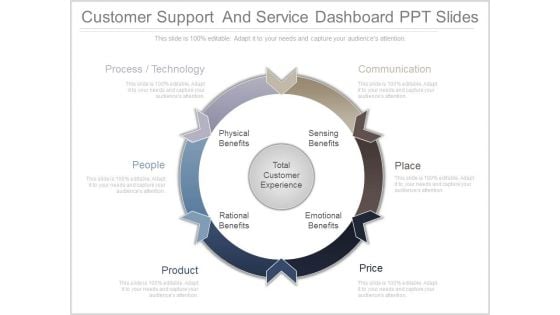
Customer Support And Service Dashboard Ppt Slides
This is a customer support and service dashboard ppt slides. This is a six stage process. The stages in this process are total customer experience, physical benefits, rational benefits, emotional benefits, sensing benefits, people, product.
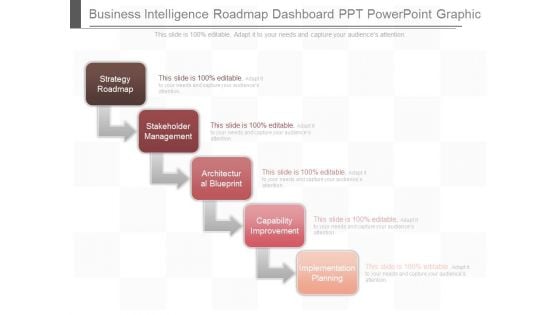
Business Intelligence Roadmap Dashboard Ppt Powerpoint Graphic
This is a business intelligence roadmap dashboard ppt powerpoint graphic. This is a five stage process. The stages in this process are strategy roadmap, stakeholder management, architectural blueprint, capability improvement, implementation planning.
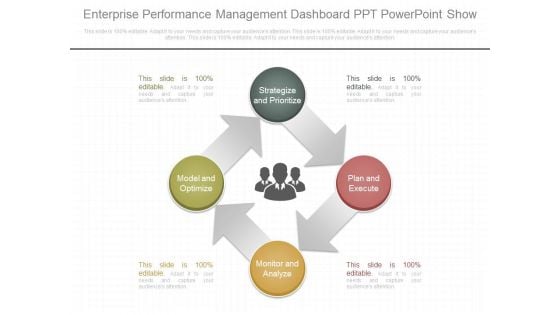
Enterprise Performance Management Dashboard Ppt Powerpoint Show
This is a enterprise performance management dashboard ppt powerpoint show. This is a four stage process. The stages in this process are strategize and prioritize, plan and execute, monitor and analyze, model and optimize.
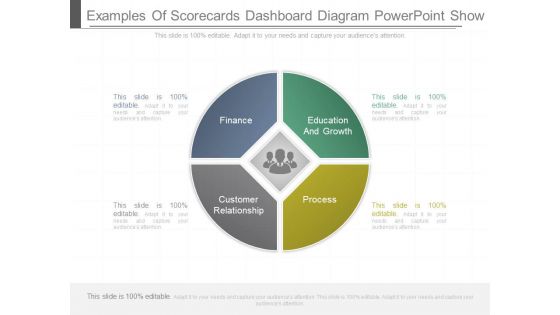
Examples Of Scorecards Dashboard Diagram Powerpoint Show
This is a examples of scorecards dashboard diagram powerpoint show. This is a four stage process. The stages in this process are finance, education and growth, customer relationship, process.

Clear Point Community Dashboard Example Ppt Slide
This is a clear point community dashboard example ppt slide. This is a four stage process. The stages in this process are internal perspective, learning and growth, financial perspective, customer perspective.
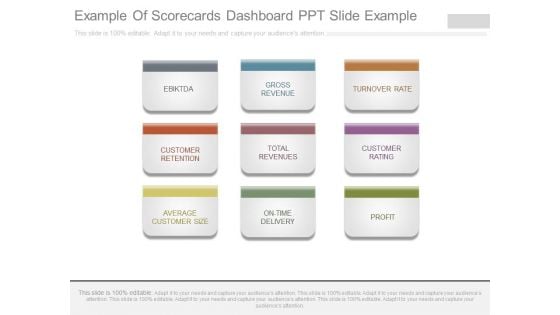
Example Of Scorecards Dashboard Ppt Slide Example
This is a example of scorecards dashboard ppt slide example. This is a nine stage process. The stages in this process are ebiktda, gross revenue, turnover rate, customer retention, total revenues, customer rating, average customer size, on time delivery, profit.
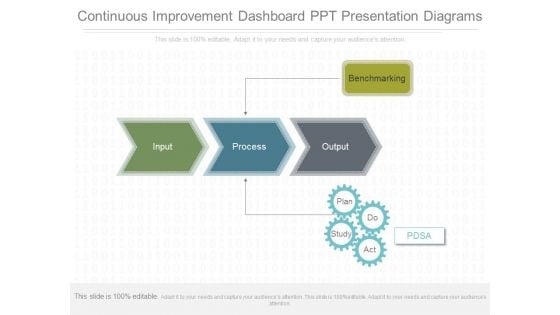
Continuous Improvement Dashboard Ppt Presentation Diagrams
This is a continuous improvement dashboard ppt presentation diagrams. This is a five stage process. The stages in this process are benchmarking, input, process, output, pdsa, plan, do, study, act.
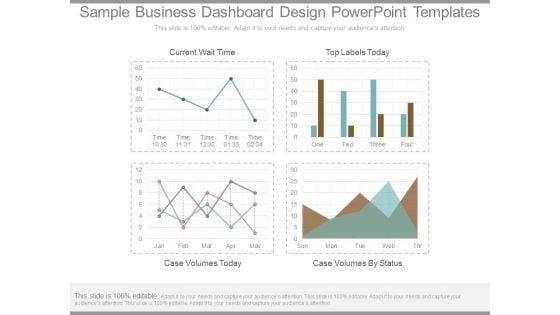
Sample Business Dashboard Design Powerpoint Templates
This is a sample business dashboard design powerpoint templates. This is a four stage process. The stages in this process are current wait time, top labels today, case volumes today, case volumes by status.
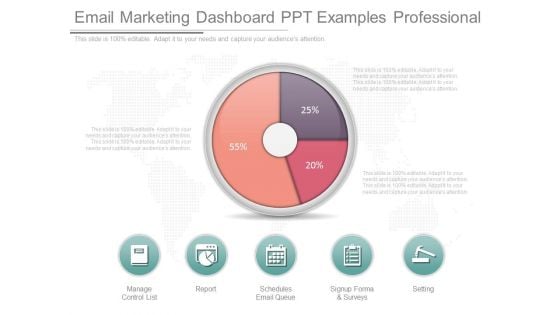
Email Marketing Dashboard Ppt Examples Professional
This is a email marketing dashboard ppt examples professional. This is a three stage process. The stages in this process are manage control list, report, schedules email queue, signup forma and surveys, setting.
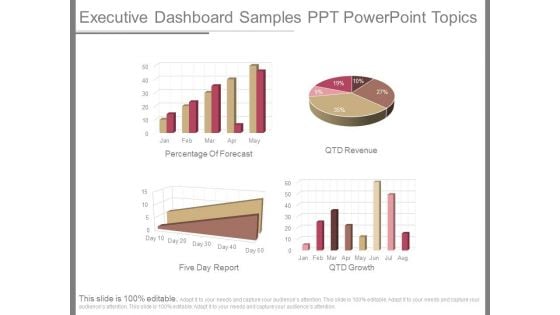
Executive Dashboard Samples Ppt Powerpoint Topics
This is a executive dashboard samples ppt powerpoint topics. This is a four stage process. The stages in this process are percentage of forecast, qtd revenue, five day report, qtd growth
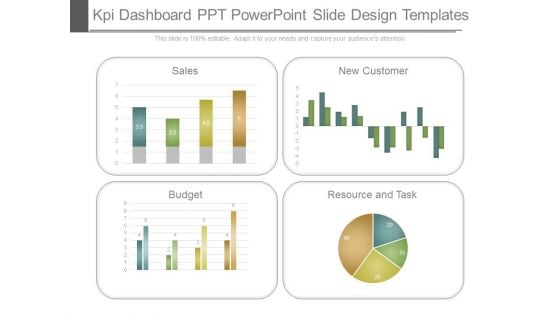
Kpi Dashboard Ppt Powerpoint Slide Design Templates
This is a kpi dashboard ppt powerpoint slide design templates. This is a four stage process. The stages in this process are sales, new customer, budget, resource and task.
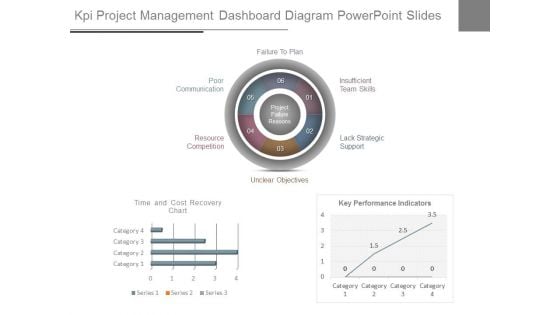
Kpi Project Management Dashboard Diagram Powerpoint Slides
This is a kpi project management dashboard diagram powerpoint slides. This is a three stage process. The stages in this process are unclear objectives, resource competition, poor communication, failure to plan, insufficient team skills, lack strategic support.
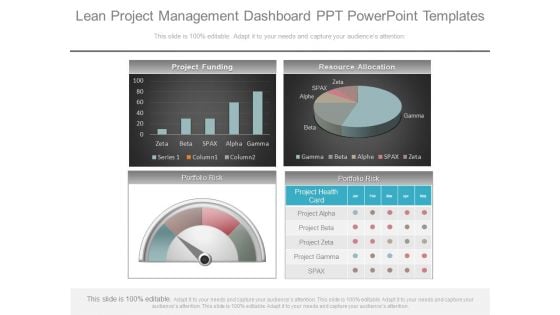
Lean Project Management Dashboard Ppt Powerpoint Templates
This is a lean project management dashboard ppt powerpoint templates. This is a four stage process. The stages in this process are project funding, resource allocation, portfolio risk, project health card, project alpha, project beta, project zeta, project gamma, spax.
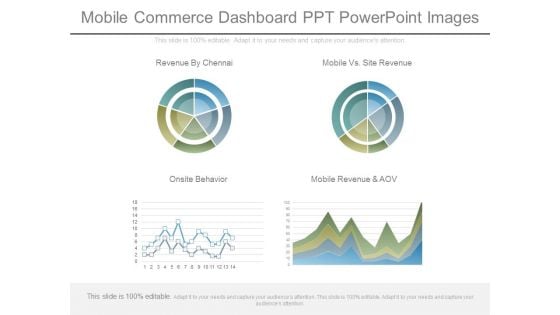
Mobile Commerce Dashboard Ppt Powerpoint Images
This is a mobile commerce dashboard ppt powerpoint images. This is a four stage process. The stages in this process are revenue by chennai, mobile vs site revenue, onsite behavior, mobile revenue and aov.
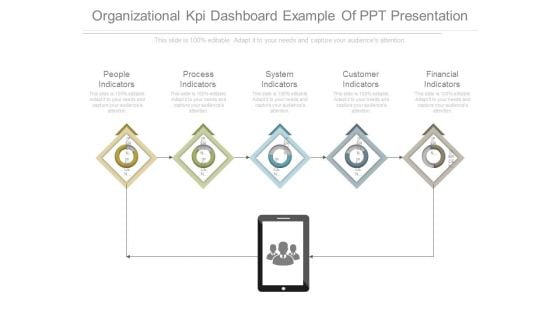
Organizational Kpi Dashboard Example Of Ppt Presentation
This is a organizational kpi dashboard example of ppt presentation. This is a five stage process. The stages in this process are people indicators, process indicators, system indicators, customer indicators, financial indicators.
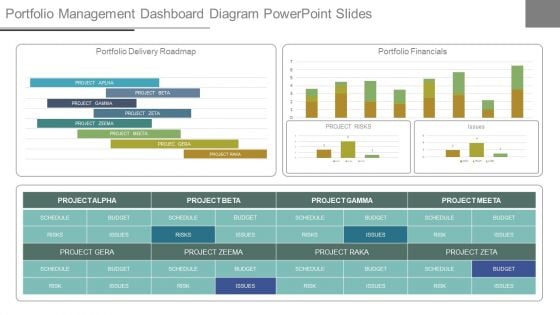
Portfolio Management Dashboard Diagram Powerpoint Slides
This is a portfolio management dashboard diagram powerpoint slides. This is a three stage process. The stages in this process are portfolio delivery roadmap, portfolio financials, project alpha, project beeta, project gama, project zeta, project zeema, schedule, risks, issues, budget.
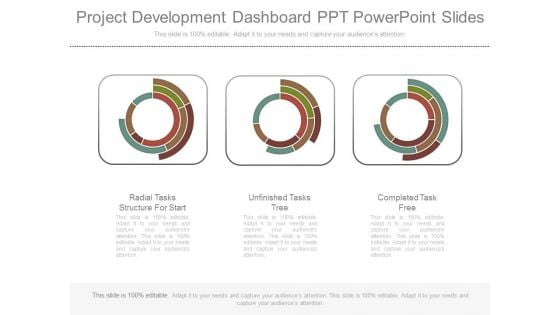
Project Development Dashboard Ppt Powerpoint Slides
This is a project development dashboard ppt powerpoint slides. This is a three stage process. The stages in this process are radial tasks structure for start, unfinished tasks tree, completed task free.
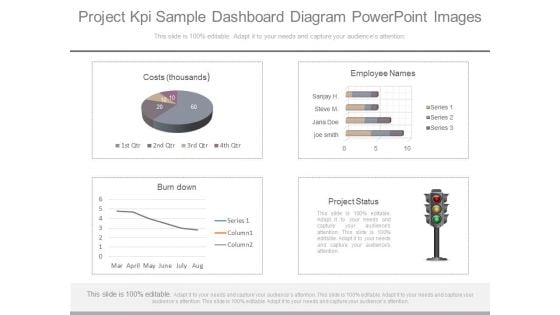
Project Kpi Sample Dashboard Diagram Powerpoint Images
This is a project kpi sample dashboard diagram powerpoint images. This is a four stage process. The stages in this process are costs thousands, employee names, burndown, project status.
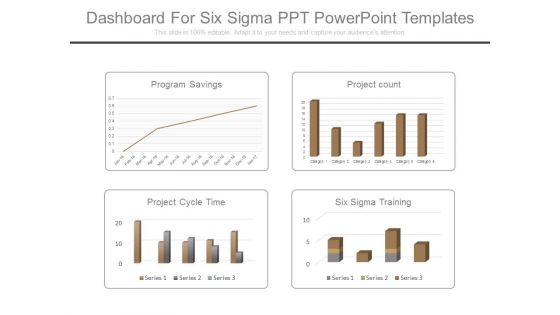
Dashboard For Six Sigma Ppt Powerpoint Templates
This is a dashboard for six sigma ppt powerpoint templates. This is a four stage process. The stages in this process are program savings, project count, project cycle time, six sigma training.
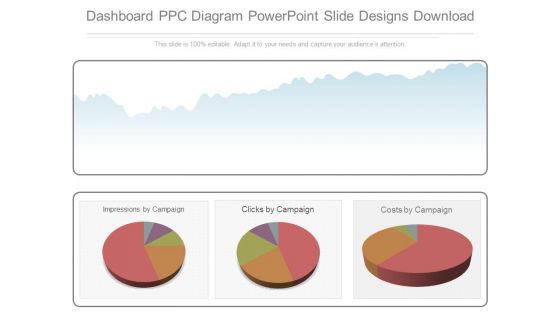
Dashboard Ppc Diagram Powerpoint Slide Designs Download
This is a dashboard ppc diagram powerpoint slide designs download. This is a three stage process. The stages in this process are impressions by campaign, clicks by campaign, costs by campaign.

Email Program Dashboard Ppt Powerpoint Slides
This is a email program dashboard ppt powerpoint slides. This is a four stage process. The stages in this process are send test, clicks, clicks to open, summary, admin, administrator, chris, hssadmin.
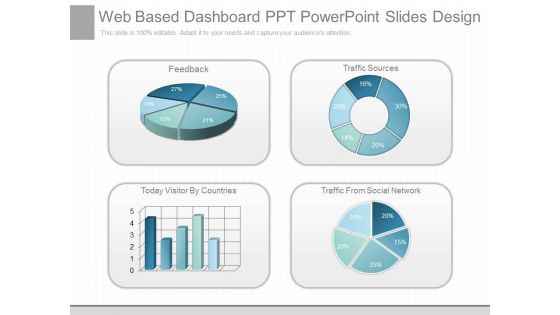
Web Based Dashboard Ppt Powerpoint Slides Design
This is a web based dashboard ppt powerpoint slides design. This is a four stage process. The stages in this process are feedback, traffic sources, today visitor by countries, traffic from social network.
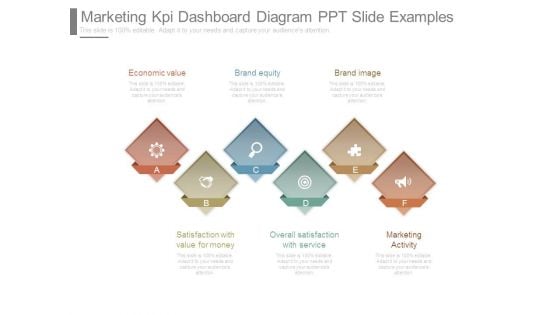
Marketing Kpi Dashboard Diagram Ppt Slide Examples
This is a marketing kpi dashboard diagram ppt slide examples. This is a six stage process. The stages in this process are economic value, satisfaction with value for money, brand equity, overall satisfaction with service, brand image, marketing activity.

Basic Localization Dashboard Diagram Ppt Example
This is a basic localization dashboard diagram ppt example. This is a two stage process. The stages in this process are quantity details of products sold by countries, products sold by month.


 Continue with Email

 Home
Home


