data analytics
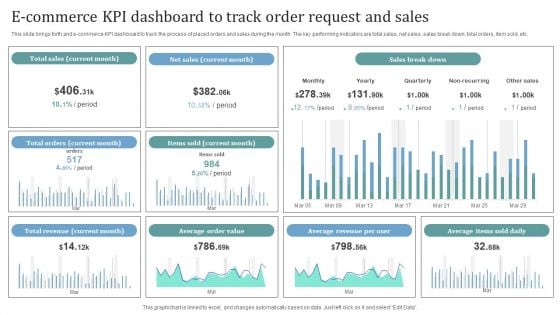
E Commerce KPI Dashboard To Track Order Request And Sales Introduction PDF
This slide brings forth and e commerce KPI dashboard to track the process of placed orders and sales during the month. The key performing indicators are total sales, net sales, sales break down, total orders, item sold, etc. Showcasing this set of slides titled E Commerce KPI Dashboard To Track Order Request And Sales Introduction PDF. The topics addressed in these templates are Total Sales, Net Sales, Sales Break Down. All the content presented in this PPT design is completely editable. Download it and make adjustments in color, background, font etc. as per your unique business setting.
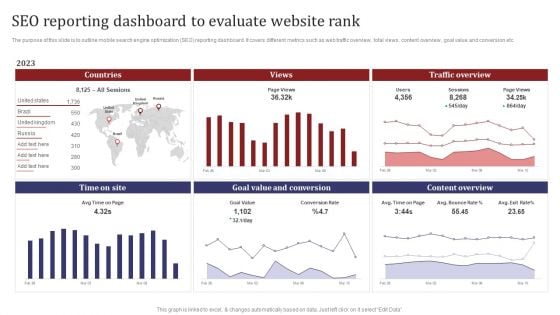
Mobile Search Engine Optimization Plan SEO Reporting Dashboard To Evaluate Website Rank Structure PDF
The purpose of this slide is to outline mobile search engine optimization SEO reporting dashboard. It covers different metrics such as web traffic overview, total views, content overview, goal value and conversion etc. There are so many reasons you need a Mobile Search Engine Optimization Plan SEO Reporting Dashboard To Evaluate Website Rank Structure PDF. The first reason is you can not spend time making everything from scratch, Thus, Slidegeeks has made presentation templates for you too. You can easily download these templates from our website easily.
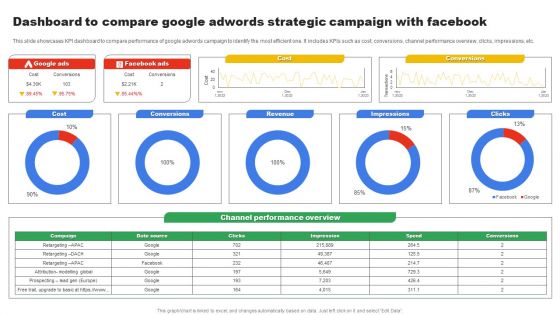
Dashboard To Compare Google Adwords Strategic Campaign With Facebook Microsoft PDF
This slide showcases KPI dashboard to compare performance of google adwords campaign to identify the most efficient one. It includes KPIs such as cost, conversions, channel performance overview, clicks, impressions, etc. Showcasing this set of slides titled Dashboard To Compare Google Adwords Strategic Campaign With Facebook Microsoft PDF. The topics addressed in these templates are Cost, Conversions, Revenue. All the content presented in this PPT design is completely editable. Download it and make adjustments in color, background, font etc. as per your unique business setting.
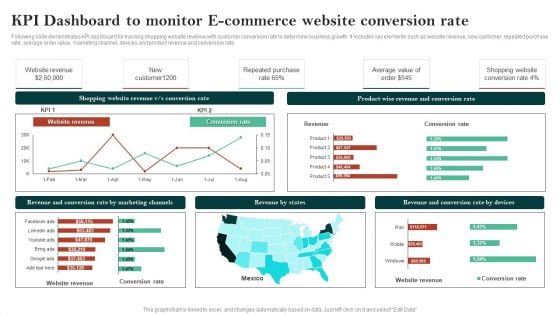
Kpi Dashboard To Monitor E Commerce Website Conversion Rate Clipart PDF
Following slide demonstrates KPI dashboard for tracking shopping website revenue with customer conversion rate to determine business growth. It includes key elements such as website revenue, new customer, repeated purchase rate, average order value, marketing channel, devices and product revenue and conversion rate. Showcasing this set of slides titled Kpi Dashboard To Monitor E Commerce Website Conversion Rate Clipart PDF. The topics addressed in these templates are Shopping Website Revenue, Conversion Rate, Website Revenue. All the content presented in this PPT design is completely editable. Download it and make adjustments in color, background, font etc. as per your unique business setting.
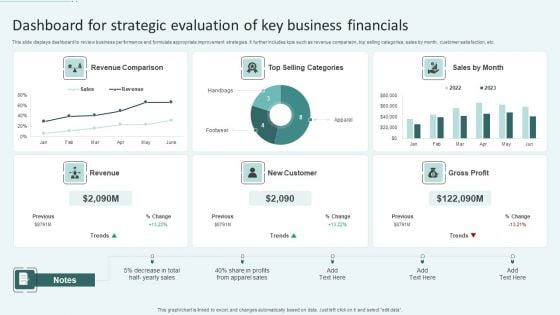
Dashboard For Strategic Evaluation Of Key Business Financials Ppt Gallery Aids PDF
This slide displays dashboard to review business performance and formulate appropriate improvement strategies. It further includes kpis such as revenue comparison, top selling categories, sales by month, customer satisfaction, etc. Showcasing this set of slides titled Dashboard For Strategic Evaluation Of Key Business Financials Ppt Gallery Aids PDF. The topics addressed in these templates are Revenue Comparison, Top Selling Categories, New Customer. All the content presented in this PPT design is completely editable. Download it and make adjustments in color, background, font etc. as per your unique business setting.
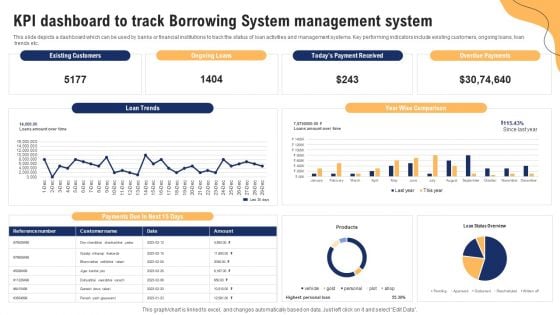
KPI Dashboard To Track Borrowing System Management System Ppt Visual Aids Portfolio PDF
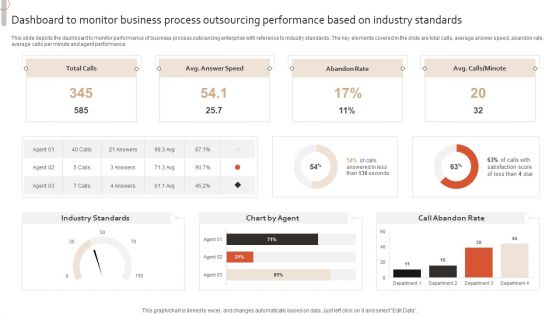
Dashboard To Monitor Business Process Outsourcing Performance Based On Industry Standards Infographics PDF
This slide depicts the dashboard to monitor performance of business process outsourcing enterprise with reference to industry standards. The key elements covered in the slide are total calls, average answer speed, abandon rate, average calls per minute and agent performanc. Showcasing this set of slides titled Dashboard To Monitor Business Process Outsourcing Performance Based On Industry Standards Infographics PDF. The topics addressed in these templates are Industry Standards, Chart By Agent, Call Abandon Rate, Total Calls. All the content presented in this PPT design is completely editable. Download it and make adjustments in color, background, font etc. as per your unique business setting.
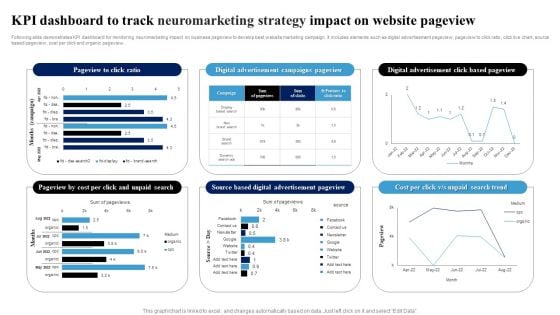
KPI Dashboard To Track Neuromarketing Strategy Impact On Website Pageview Ppt Model Templates PDF
Following slide demonstrates KPI dashboard for monitoring neuromarketing impact on business pageview to develop best website marketing campaign. It includes elements such as digital advertisement pageview, pageview to click ratio, click live chart, source based pageview, cost per click and organic pageview. Showcasing this set of slides titled KPI Dashboard To Track Neuromarketing Strategy Impact On Website Pageview Ppt Model Templates PDF. The topics addressed in these templates are Digital Advertisement, Campaigns Pageview, Click Based Pageview. All the content presented in this PPT design is completely editable. Download it and make adjustments in color, background, font etc. as per your unique business setting.
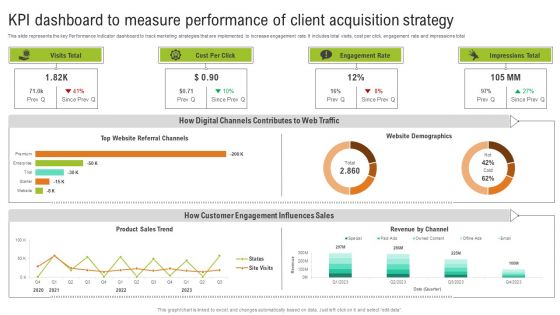
KPI Dashboard To Measure Performance Of Client Acquisition Strategy Slides PDF
This slide represents the key Performance Indicator dashboard to track marketing strategies that are implemented to increase engagement rate. It includes total visits, cost per click, engagement rate and impressions total. Showcasing this set of slides titled KPI Dashboard To Measure Performance Of Client Acquisition Strategy Slides PDF. The topics addressed in these templates are Visits Total, Cost Per Click, Engagement Rate, Impressions Total. All the content presented in this PPT design is completely editable. Download it and make adjustments in color, background, font etc. as per your unique business setting.
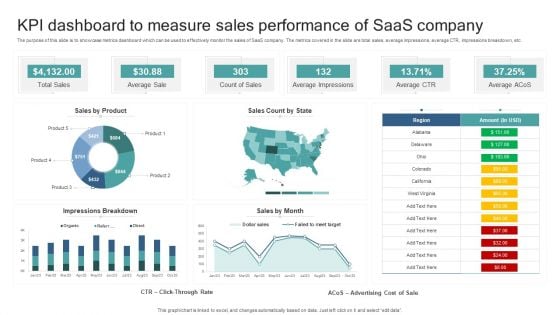
KPI Dashboard To Measure Sales Performance Of Saas Company Summary PDF
The purpose of this slide is to showcase metrics dashboard which can be used to effectively monitor the sales of SaaS company. The metrics covered in the slide are total sales, average impressions, average CTR, impressions breakdown, etc. Showcasing this set of slides titled KPI Dashboard To Measure Sales Performance Of Saas Company Summary PDF. The topics addressed in these templates are Total Sales, Average Sale, Count Of Sales, Average Impressions, Average Ctr. All the content presented in this PPT design is completely editable. Download it and make adjustments in color, background, font etc. as per your unique business setting.
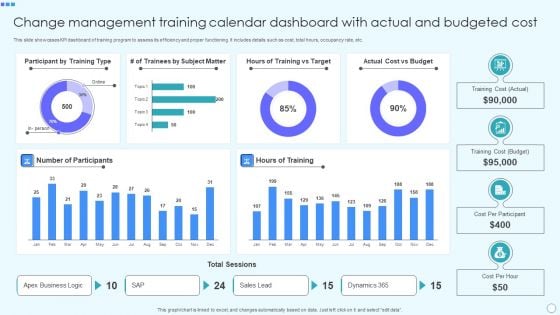
Change Management Training Calendar Dashboard With Actual And Budgeted Cost Demonstration PDF
This slide showcases KPI dashboard of training program to assess its efficiency and proper functioning. It includes details such as cost, total hours, occupancy rate, etc. Showcasing this set of slides titled Change Management Training Calendar Dashboard With Actual And Budgeted Cost Demonstration PDF. The topics addressed in these templates are Actual, Budget, Cost Per Participant, Cost Per Hour. All the content presented in this PPT design is completely editable. Download it and make adjustments in color, background, font etc. as per your unique business setting.
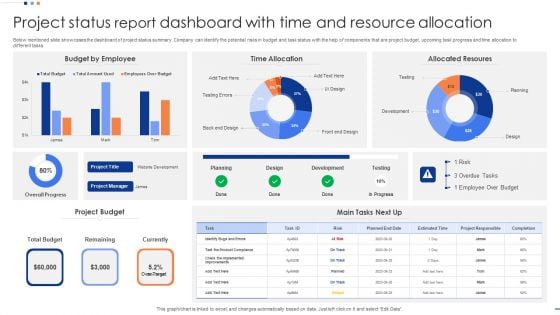
Project Status Report Dashboard With Time And Resource Allocation Inspiration PDF
Below mentioned slide showcases the dashboard of project status summary. Company can identify the potential risks in budget and task status with the help of components that are project budget, upcoming task progress and time allocation to different tasks. Showcasing this set of slides titled Project Status Report Dashboard With Time And Resource Allocation Inspiration PDF. The topics addressed in these templates are Budget By Employee, Time Allocation, Allocated Resoures. All the content presented in this PPT design is completely editable. Download it and make adjustments in color, background, font etc. as per your unique business setting.
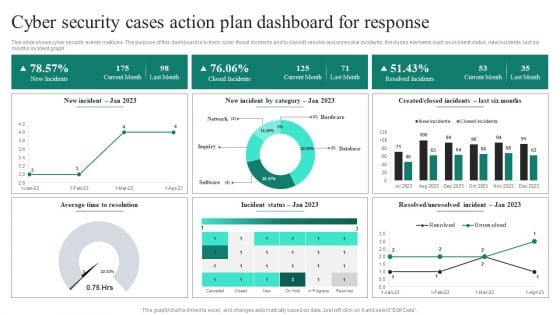
Cyber Security Cases Action Plan Dashboard For Response Ppt PowerPoint Presentation File Deck PDF
This slide shows cyber security events matrices. The purpose of this dashboard is to track cyber threat incidents and to classify resolve and unresolve incidents. It includes elements such as incident status, new incidents, last six months incident graph. Showcasing this set of slides titled Cyber Security Cases Action Plan Dashboard For Response Ppt PowerPoint Presentation File Deck PDF. The topics addressed in these templates are Current Month, Closed Incidents, Last Month, Resolved Incidents. All the content presented in this PPT design is completely editable. Download it and make adjustments in color, background, font etc. as per your unique business setting.
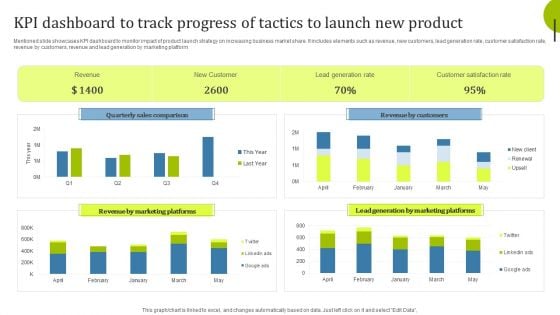
Kpi Dashboard To Track Progress Of Tactics To Launch New Product Infographics PDF
Mentioned slide showcases KPI dashboard to monitor impact of product launch strategy on increasing business market share. It includes elements such as revenue, new customers, lead generation rate, customer satisfaction rate, revenue by customers, revenue and lead generation by marketing platform. Showcasing this set of slides titled Kpi Dashboard To Track Progress Of Tactics To Launch New Product Infographics PDF. The topics addressed in these templates are Quarterly Sales Comparison, Revenue Marketing, Revenue Customers. All the content presented in this PPT design is completely editable. Download it and make adjustments in color, background, font etc. as per your unique business setting.
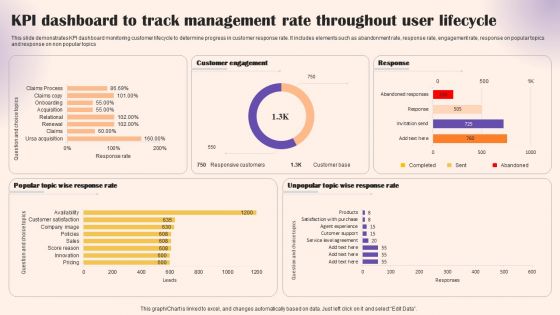
KPI Dashboard To Track Management Rate Throughout User Lifecycle Portrait PDF
This slide demonstrates KPI dashboard monitoring customer lifecycle to determine progress in customer response rate. It includes elements such as abandonment rate, response rate, engagement rate, response on popular topics and response on non popular topics. Showcasing this set of slides titled KPI Dashboard To Track Management Rate Throughout User Lifecycle Portrait PDF. The topics addressed in these templates are Customer Engagement, Response, Response Rate. All the content presented in this PPT design is completely editable. Download it and make adjustments in color, background, font etc. as per your unique business setting.
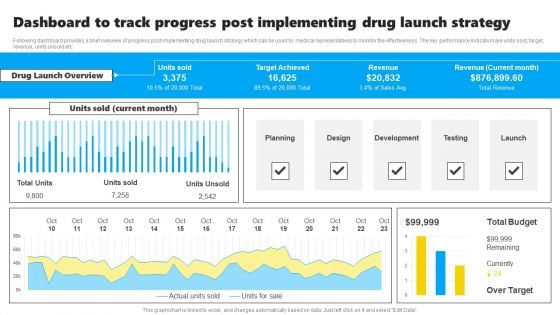
Dashboard To Track Progress Post Implementing Drug Launch Strategy Slides PDF
Following dashboard provides a brief overview of progress post implementing drug launch strategy which can be used by medical representatives to monitor the effectiveness. The key performance indicators are units sold, target, revenue, units unsold etc. Showcasing this set of slides titled Dashboard To Track Progress Post Implementing Drug Launch Strategy Slides PDF. The topics addressed in these templates are Planning, Design, Development, Testing, Launch. All the content presented in this PPT design is completely editable. Download it and make adjustments in color, background, font etc. as per your unique business setting.
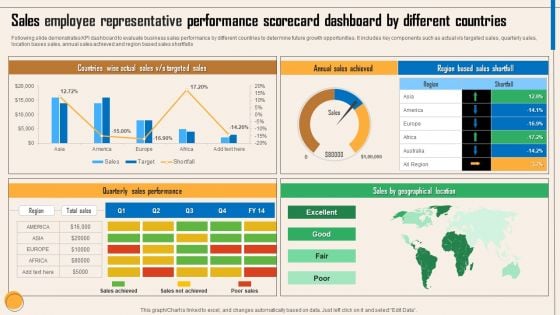
Sales Employee Representative Performance Scorecard Dashboard By Different Countries Themes PDF
Following slide demonstrates KPI dashboard to evaluate business sales performance by different countries to determine future growth opportunities. It includes key components such as actual v or s targeted sales, quarterly sales, location bases sales, annual sales achieved and region based sales shortfalls. Showcasing this set of slides titled Sales Employee Representative Performance Scorecard Dashboard By Different Countries Themes PDF. The topics addressed in these templates are Countries Wise Actual Sales, V Or S Targeted Sales, Annual Sales Achieved, Quarterly Sales Performance, Sales By Geographical Location. All the content presented in this PPT design is completely editable. Download it and make adjustments in color, background, font etc. as per your unique business setting.
Monthly Sales KPI Dashboard For Tracking Brand Recommendation Progress Background PDF
Following slide demonstrates key performance indicator dashboard for tracking monthly sales to monitor business performance. It includes components such as monthly execution cost, sales, state wise events, Brand market, and programs. Showcasing this set of slides titled Monthly Sales KPI Dashboard For Tracking Brand Recommendation Progress Background PDF. The topics addressed in these templates are Products Sold, Engagements, Events, Active Markets, Sampled, Attendance. All the content presented in this PPT design is completely editable. Download it and make adjustments in color, background, font etc. as per your unique business setting.
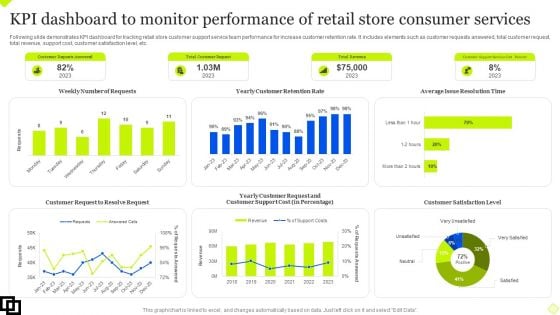
KPI Dashboard To Monitor Performance Of Retail Store Consumer Services Summary PDF
Following slide demonstrates KPI dashboard for tracking retail store customer support service team performance for increase customer retention rate. It includes elements such as customer requests answered, total customer request, total revenue, support cost, customer satisfaction level, etc. Showcasing this set of slides titled KPI Dashboard To Monitor Performance Of Retail Store Consumer Services Summary PDF. The topics addressed in these templates are Customer Request, Customer Retention Rate, Customer Satisfaction Level. All the content presented in this PPT design is completely editable. Download it and make adjustments in color, background, font etc. as per your unique business setting.
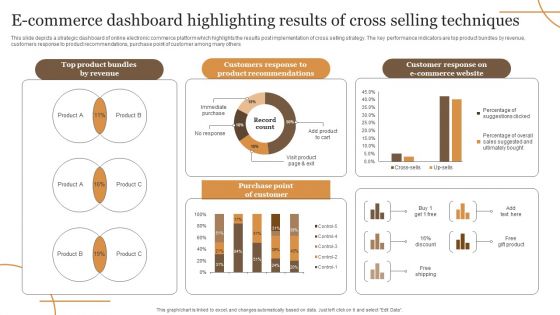
E Commerce Dashboard Highlighting Results Of Cross Selling Techniques Elements PDF
This slide depicts a strategic dashboard of online electronic commerce platform which highlights the results post implementation of cross selling strategy. The key performance indicators are top product bundles by revenue, customers response to product recommendations, purchase point of customer among many others. Showcasing this set of slides titled E Commerce Dashboard Highlighting Results Of Cross Selling Techniques Elements PDF. The topics addressed in these templates are Revenue, E Commerce Website, Purchase. All the content presented in this PPT design is completely editable. Download it and make adjustments in color, background, font etc. as per your unique business setting.
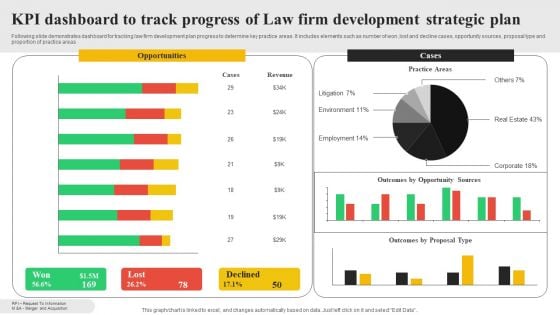
KPI Dashboard To Track Progress Of Law Firm Development Strategic Plan Infographics PDF
Following slide demonstrates dashboard for tracking law firm development plan progress to determine key practice areas. It includes elements such as number of won ,lost and decline cases, opportunity sources, proposal type and proportion of practice areas. Showcasing this set of slides titled KPI Dashboard To Track Progress Of Law Firm Development Strategic Plan Infographics PDF. The topics addressed in these templates are Opportunities, Cases, Practice Areas. All the content presented in this PPT design is completely editable. Download it and make adjustments in color, background, font etc. as per your unique business setting.
Real Time Employment Tracking Dashboard With Human Resource Metrics Brochure PDF
This slide showcases dashboard that can help human resource manager to track the salary and hiring status of employee in organization. Its key KPIs are permanent rate, turnover rate, absenteeism rate, employees hired and employees left. Showcasing this set of slides titled Real Time Employment Tracking Dashboard With Human Resource Metrics Brochure PDF. The topics addressed in these templates are Average Age, Permanent Rate, Headcount. All the content presented in this PPT design is completely editable. Download it and make adjustments in color, background, font etc. as per your unique business setting.
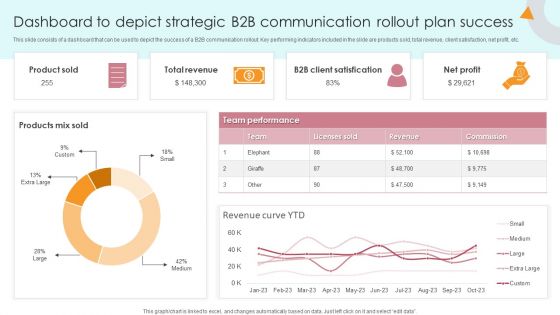
Dashboard To Depict Strategic B2B Communication Rollout Plan Success Portrait PDF
This slide consists of a dashboard that can be used to depict the success of a B2B communication rollout. Key performing indicators included in the slide are products sold, total revenue, client satisfaction, net profit, etc. Showcasing this set of slides titled Dashboard To Depict Strategic B2B Communication Rollout Plan Success Portrait PDF. The topics addressed in these templates are Product Sold, Total Revenue, B2b Client Satisfication. All the content presented in this PPT design is completely editable. Download it and make adjustments in color, background, font etc. as per your unique business setting.

Business Continuous Process Improvement KPI Dashboard In Healthcare Industry Guidelines PDF
Following slides shows the complete outline of healthcare business process improvement KPI dashboard which will assist in providing better services to patients . The major metrics mentioned in a slide are such as average patients discharge by hour or on weekly basis Showcasing this set of slides titled Business Continuous Process Improvement KPI Dashboard In Healthcare Industry Guidelines PDF. The topics addressed in these templates are Patients, Discharge List, Healthcare Industry. All the content presented in this PPT design is completely editable. Download it and make adjustments in color, background, font etc. as per your unique business setting.
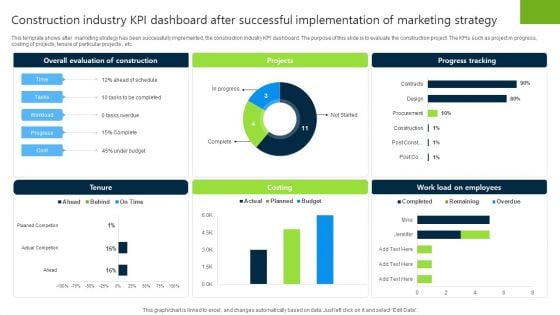
Construction Industry KPI Dashboard After Successful Implementation Of Marketing Strategy Sample PDF
This template shows after marketing strategy has been successfully implemented, the construction industry KPI dashboard. The purpose of this slide is to evaluate the construction project. The KPIs such as project in progress, costing of projects, tenure of particular projects , etc. Showcasing this set of slides titled Construction Industry KPI Dashboard After Successful Implementation Of Marketing Strategy Sample PDF. The topics addressed in these templates are Projetcs, Progress Tracking, Costing. All the content presented in this PPT design is completely editable. Download it and make adjustments in color, background, font etc. as per your unique business setting.
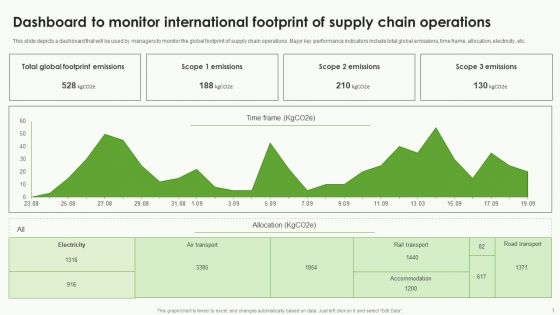
Dashboard To Monitor International Footprint Of Supply Chain Operations Brochure PDF
This slide depicts a dashboard that will be used by managers to monitor the global footprint of supply chain operations. Major key performance indicators include total global emissions, time frame, allocation, electricity, etc. Showcasing this set of slides titled Dashboard To Monitor International Footprint Of Supply Chain Operations Brochure PDF. The topics addressed in these templates are Electricity, Footprint Emissions, Allocation. All the content presented in this PPT design is completely editable. Download it and make adjustments in color, background, font etc. as per your unique business setting.
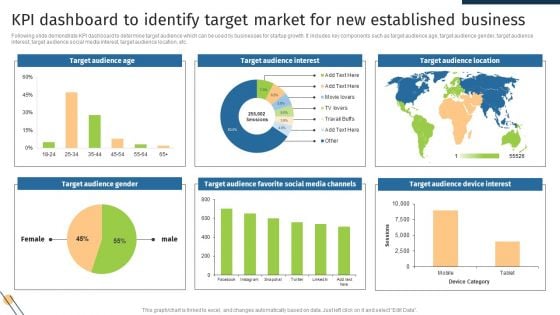
KPI Dashboard To Identify Target Market For New Established Business Formats PDF
Following slide demonstrate KPI dashboard to determine target audience which can be used by businesses for startup growth. It includes key components such as target audience age, target audience gender, target audience interest, target audience social media interest, target audience location, etc. Showcasing this set of slides titled KPI Dashboard To Identify Target Market For New Established Business Formats PDF. The topics addressed in these templates are Target Audience Age, Target Audience Interest, Target Audience Location. All the content presented in this PPT design is completely editable. Download it and make adjustments in color, background, font etc. as per your unique business setting.
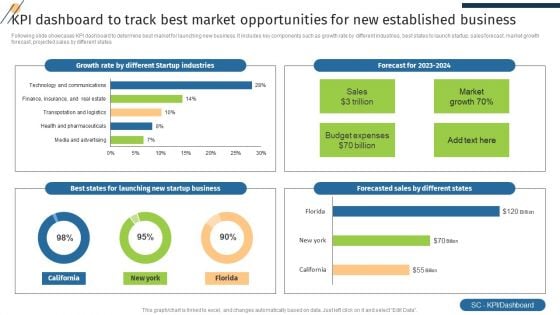
KPI Dashboard To Track Best Market Opportunities For New Established Business Pictures PDF
Following slide showcases KPI dashboard to determine best market for launching new business. It includes key components such as growth rate by different industries, best states to launch startup, sales forecast, market growth forecast, projected sales by different states. Showcasing this set of slides titled KPI Dashboard To Track Best Market Opportunities For New Established Business Pictures PDF. The topics addressed in these templates are Forecasted Sales, Growth Rate, Startup Industries. All the content presented in this PPT design is completely editable. Download it and make adjustments in color, background, font etc. as per your unique business setting.
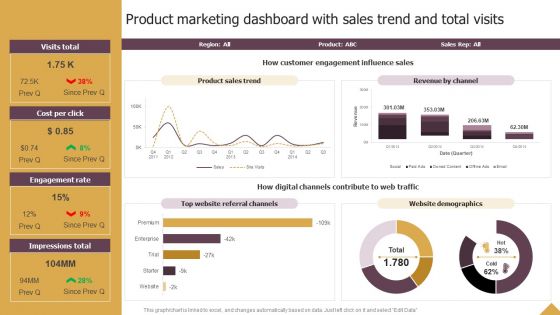
Product Marketing Dashboard With Sales Trend And Total Visits Ppt Inspiration Show PDF
Explore a selection of the finest Product Marketing Dashboard With Sales Trend And Total Visits Ppt Inspiration Show PDF here. With a plethora of professionally designed and pre made slide templates, you can quickly and easily find the right one for your upcoming presentation. You can use our Product Marketing Dashboard With Sales Trend And Total Visits Ppt Inspiration Show PDF to effectively convey your message to a wider audience. Slidegeeks has done a lot of research before preparing these presentation templates. The content can be personalized and the slides are highly editable. Grab templates today from Slidegeeks.
Implementing Change Management Strategy To Transform Business Processes Dashboard Depicting Kpis To Track Icons PDF
This slide covers the dashboard that depicts metrics to track company sales performance that focuses on number of sales, cost breakdown, accumulated revenues, incremental sales, etc. Boost your pitch with our creative Implementing Change Management Strategy To Transform Business Processes Dashboard Depicting Kpis To Track Icons PDF. Deliver an awe-inspiring pitch that will mesmerize everyone. Using these presentation templates you will surely catch everyones attention. You can browse the ppts collection on our website. We have researchers who are experts at creating the right content for the templates. So you do not have to invest time in any additional work. Just grab the template now and use them.
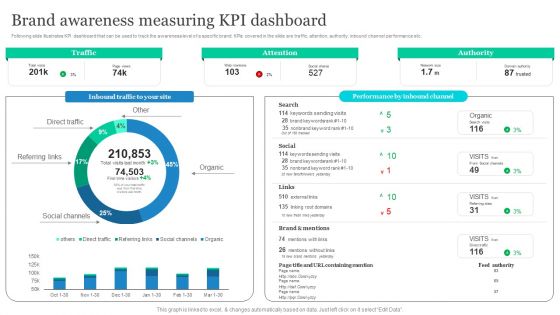
Effective Product Positioning Approach Brand Awareness Measuring Kpi Dashboard Ideas PDF
Following slide illustrates KPI dashboard that can be used to track the awareness level of a specific brand. KPIs covered in the slide are traffic, attention, authority, inbound channel performance etc. Boost your pitch with our creative Effective Product Positioning Approach Brand Awareness Measuring Kpi Dashboard Ideas PDF. Deliver an awe-inspiring pitch that will mesmerize everyone. Using these presentation templates you will surely catch everyones attention. You can browse the ppts collection on our website. We have researchers who are experts at creating the right content for the templates. So you do not have to invest time in any additional work. Just grab the template now and use them.
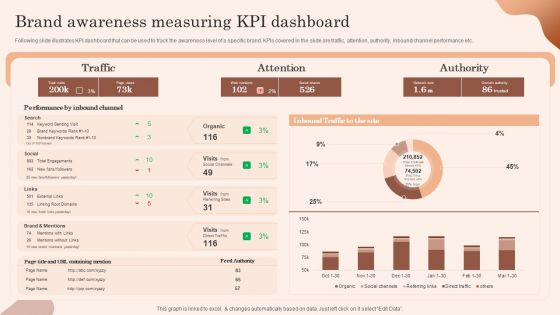
Building Market Brand Leadership Strategies Brand Awareness Measuring Kpi Dashboard Structure PDF
Following slide illustrates KPI dashboard that can be used to track the awareness level of a specific brand. KPIs covered in the slide are traffic, attention, authority, inbound channel performance etc. Boost your pitch with our creative Building Market Brand Leadership Strategies Brand Awareness Measuring Kpi Dashboard Structure PDF. Deliver an awe-inspiring pitch that will mesmerize everyone. Using these presentation templates you will surely catch everyones attention. You can browse the ppts collection on our website. We have researchers who are experts at creating the right content for the templates. So you do not have to invest time in any additional work. Just grab the template now and use them.
Effective Lead Generation For Higher Conversion Rates Dashboard For Tracking Lead Generation And Conversion Structure PDF
This slide covers the KPI dashboard for analyzing metrics such as cost per lead, cost per conversion, average time conversion, conversion rate, monthly new leads, and qualified leads per month. Boost your pitch with our creative Effective Lead Generation For Higher Conversion Rates Dashboard For Tracking Lead Generation And Conversion Structure PDF. Deliver an awe-inspiring pitch that will mesmerize everyone. Using these presentation templates you will surely catch everyones attention. You can browse the ppts collection on our website. We have researchers who are experts at creating the right content for the templates. So you do not have to invest time in any additional work. Just grab the template now and use them.
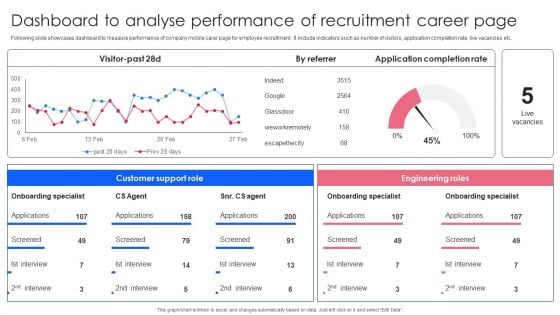
Effective Guide To Build Strong Online Hiring Strategy Dashboard To Analyse Performance Of Recruitment Download PDF
Following slide showcases dashboard to measure performance of company mobile carer page for employee recruitment . It include indicators such as number of visitors, application completion rate, live vacancies etc. Boost your pitch with our creative Effective Guide To Build Strong Online Hiring Strategy Dashboard To Analyse Performance Of Recruitment Download PDF. Deliver an awe-inspiring pitch that will mesmerize everyone. Using these presentation templates you will surely catch everyones attention. You can browse the ppts collection on our website. We have researchers who are experts at creating the right content for the templates. So you do not have to invest time in any additional work. Just grab the template now and use them.
Dashboard For Enterprise Recruitment With Time To Hire And Fill Icons PDF
In this slide corporate staffing dashboard highlights important recruitment KPIs to review application trends and candidate response to job vacancy. It further includes details about application, review, assessment, interview, etc. Showcasing this set of slides titled Dashboard For Enterprise Recruitment With Time To Hire And Fill Icons PDF. The topics addressed in these templates are Key Metrics, Experienced Ratio, Applicants. All the content presented in this PPT design is completely editable. Download it and make adjustments in color, background, font etc. as per your unique business setting.
Online Risk Management Dashboard For Tracking Threats And Attacks Icons PDF
The purpose of this slide is to represent dashboard to monitor risks and cyber threats for efficient risk management. It includes various types of key performance indicators such as types of risks, severities, sources and risk meter. Showcasing this set of slides titled Online Risk Management Dashboard For Tracking Threats And Attacks Icons PDF. The topics addressed in these templates are Attack, Indication Severities, Sources. All the content presented in this PPT design is completely editable. Download it and make adjustments in color, background, font etc. as per your unique business setting.
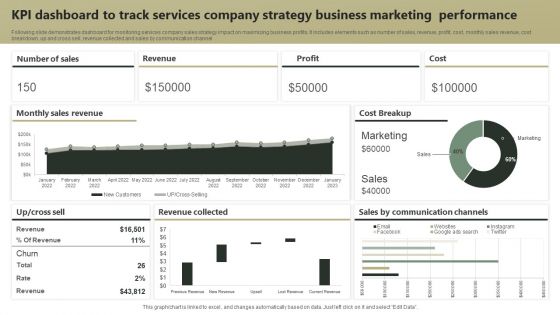
KPI Dashboard To Track Services Company Strategy Business Marketing Performance Guidelines PDF
Following slide demonstrates dashboard for monitoring services company sales strategy impact on maximizing business profits. It includes elements such as number of sales, revenue, profit, cost, monthly sales revenue, cost breakdown, up and cross sell, revenue collected and sales by communication channel. Showcasing this set of slides titled KPI Dashboard To Track Services Company Strategy Business Marketing Performance Guidelines PDF. The topics addressed in these templates are Revenue, Profit, Cost. All the content presented in this PPT design is completely editable. Download it and make adjustments in color, background, font etc. as per your unique business setting.
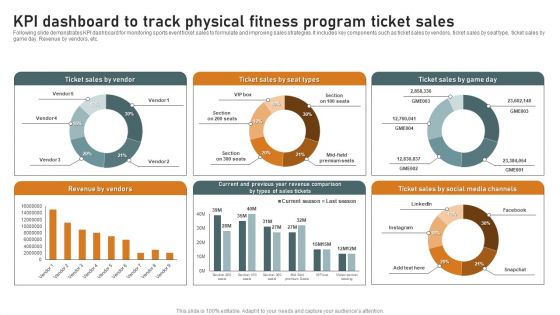
KPI Dashboard To Track Physical Fitness Program Ticket Sales Summary PDF
Following slide demonstrates KPI dashboard for monitoring sports event ticket sales to formulate and improving sales strategies. It includes key components such as ticket sales by vendors, ticket sales by seat type, ticket sales by game day. Revenue by vendors, etc. Showcasing this set of slides titled KPI Dashboard To Track Physical Fitness Program Ticket Sales Summary PDF. The topics addressed in these templates are Revenue By Vendors, Sales By Vendor, Social Media Channels. All the content presented in this PPT design is completely editable. Download it and make adjustments in color, background, font etc. as per your unique business setting.
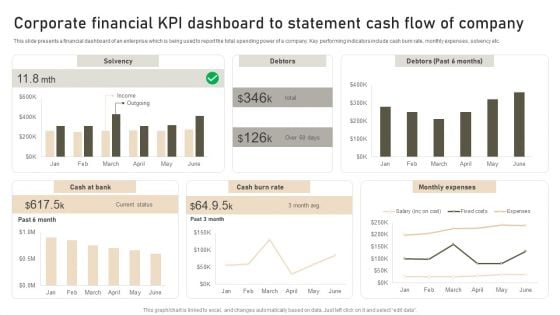
Corporate Financial KPI Dashboard To Statement Cash Flow Of Company Diagrams PDF
This slide presents a financial dashboard of an enterprise which is being used to report the total spending power of a company. Key performing indicators include cash burn rate, monthly expenses, solvency etc. Showcasing this set of slides titled Corporate Financial KPI Dashboard To Statement Cash Flow Of Company Diagrams PDF. The topics addressed in these templates are Solvency, Debtors, Monthly Expenses. All the content presented in this PPT design is completely editable. Download it and make adjustments in color, background, font etc. as per your unique business setting.
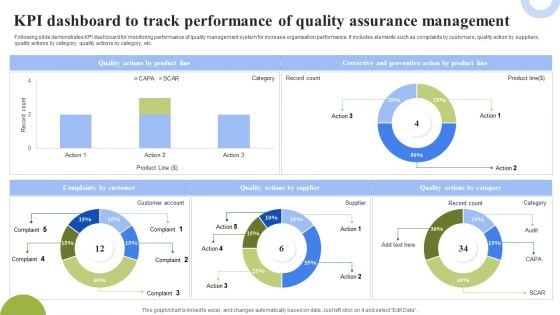
KPI Dashboard To Track Performance Of Quality Assurance Management Topics PDF
Following slide demonstrates KPI dashboard for monitoring performance of quality management system for increase organisation performance. It includes elements such as complaints by customers, quality action by suppliers, quality actions by category, quality actions by category, etc. Showcasing this set of slides titled KPI Dashboard To Track Performance Of Quality Assurance Management Topics PDF. The topics addressed in these templates are Corrective Preventive Action, Quality Actions Supplier, Quality Actions Category. All the content presented in this PPT design is completely editable. Download it and make adjustments in color, background, font etc. as per your unique business setting.
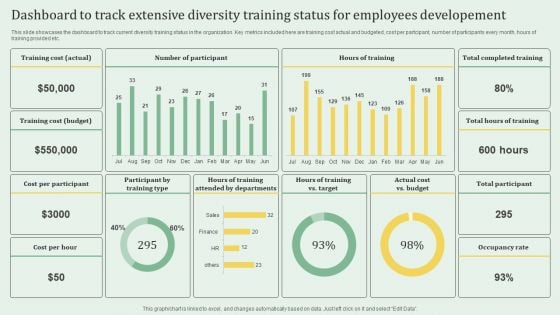
Dashboard To Track Extensive Diversity Training Status For Employees Developement Elements PDF
This slide showcases the dashboard to track current diversity training status in the organization. Key metrics included here are training cost actual and budgeted, cost per partcipant, number of participants every month, hours of training provided etc. Showcasing this set of slides titled Dashboard To Track Extensive Diversity Training Status For Employees Developement Elements PDF. The topics addressed in these templates are Training Cost, Budget, Occupancy Rate. All the content presented in this PPT design is completely editable. Download it and make adjustments in color, background, font etc. as per your unique business setting.
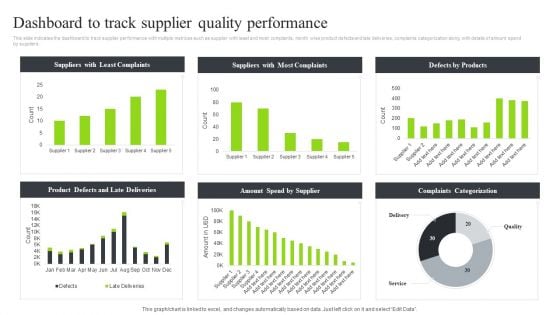
Strategic Sourcing And Supplier Quality Dashboard To Track Supplier Quality Performance Microsoft PDF
This slide indicates the dashboard to track supplier performance with multiple metrices such as supplier with least and most complaints, month wise product defects and late deliveries, complaints categorization along with details of amount spend by suppliers.Slidegeeks has constructed Strategic Sourcing And Supplier Quality Dashboard To Track Supplier Quality Performance Microsoft PDF after conducting extensive research and examination. These presentation templates are constantly being generated and modified based on user preferences and critiques from editors. Here, you will find the most attractive templates for a range of purposes while taking into account ratings and remarks from users regarding the content. This is an excellent jumping-off point to explore our content and will give new users an insight into our top-notch PowerPoint Templates.
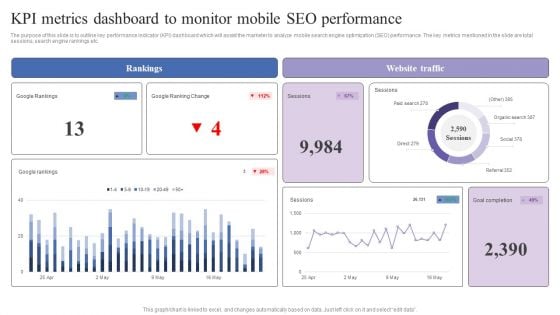
KPI Metrics Dashboard To Monitor Mobile Seo Performance Mobile Search Engine Optimization Guide Professional PDF
The purpose of this slide is to outline key performance indicator KPI dashboard which will assist the marketer to analyze mobile search engine optimization SEO performance. The key metrics mentioned in the slide are total sessions, search engine rankings etc. Slidegeeks has constructed KPI Metrics Dashboard To Monitor Mobile Seo Performance Mobile Search Engine Optimization Guide Professional PDF after conducting extensive research and examination. These presentation templates are constantly being generated and modified based on user preferences and critiques from editors. Here, you will find the most attractive templates for a range of purposes while taking into account ratings and remarks from users regarding the content. This is an excellent jumping-off point to explore our content and will give new users an insight into our top-notch PowerPoint Templates.
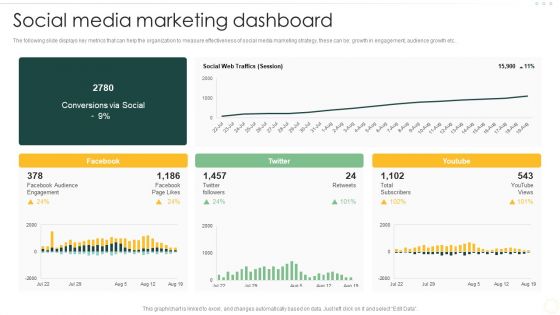
Effective Organizational B2B And B2C Social Media Marketing Dashboard Brochure PDF
The following slide displays key metrics that can help the organization to measure effectiveness of social media marketing strategy, these can be growth in engagement, audience growth etc. Formulating a presentation can take up a lot of effort and time, so the content and message should always be the primary focus. The visuals of the PowerPoint can enhance the presenters message, so our Effective Organizational B2B And B2C Social Media Marketing Dashboard Brochure PDF was created to help save time. Instead of worrying about the design, the presenter can concentrate on the message while our designers work on creating the ideal templates for whatever situation is needed. Slidegeeks has experts for everything from amazing designs to valuable content, we have put everything into Effective Organizational B2B And B2C Social Media Marketing Dashboard Brochure PDF.
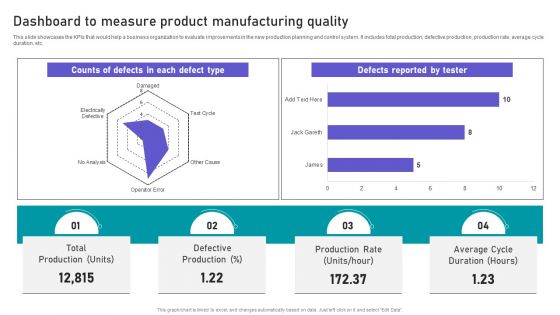
Effective Manufacturing Planning And Control Administration System Dashboard To Measure Product Pictures PDF
This slide showcases the KPIs that would help a business organization to evaluate improvements in the new production planning and control system. It includes total production, defective production, production rate, average cycle duration, etc. Here you can discover an assortment of the finest PowerPoint and Google Slides templates. With these templates, you can create presentations for a variety of purposes while simultaneously providing your audience with an eye-catching visual experience. Download Effective Manufacturing Planning And Control Administration System Dashboard To Measure Product Pictures PDF to deliver an impeccable presentation. These templates will make your job of preparing presentations much quicker, yet still, maintain a high level of quality. Slidegeeks has experienced researchers who prepare these templates and write high-quality content for you. Later on, you can personalize the content by editing the Effective Manufacturing Planning And Control Administration System Dashboard To Measure Product Pictures PDF.
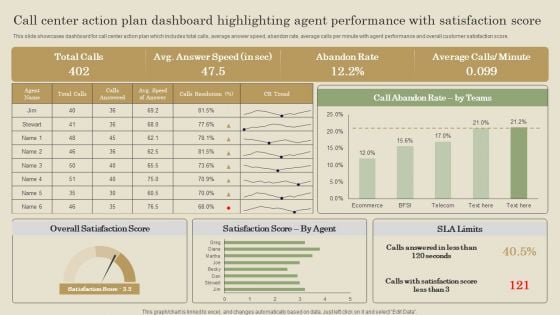
Call Center Action Plan Dashboard Highlighting Agent Performance With Satisfaction Score Diagrams PDF
This slide showcases dashboard for call center action plan which includes total calls, average answer speed, abandon rate, average calls per minute with agent performance and overall customer satisfaction score. Slidegeeks has constructed Call Center Action Plan Dashboard Highlighting Agent Performance With Satisfaction Score Diagrams PDF after conducting extensive research and examination. These presentation templates are constantly being generated and modified based on user preferences and critiques from editors. Here, you will find the most attractive templates for a range of purposes while taking into account ratings and remarks from users regarding the content. This is an excellent jumping off point to explore our content and will give new users an insight into our top notch PowerPoint Templates.
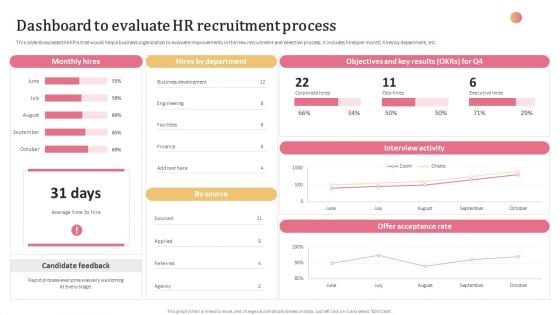
Aligning Human Resource Hiring Procedure Dashboard To Evaluate HR Recruitment Process Portrait PDF
This slide showcases the KPIs that would help a business organization to evaluate improvements in the new recruitment and selection process. It includes hires per month, hires by department, etc. Here you can discover an assortment of the finest PowerPoint and Google Slides templates. With these templates, you can create presentations for a variety of purposes while simultaneously providing your audience with an eye catching visual experience. Download Aligning Human Resource Hiring Procedure Dashboard To Evaluate HR Recruitment Process Portrait PDF to deliver an impeccable presentation. These templates will make your job of preparing presentations much quicker, yet still, maintain a high level of quality. Slidegeeks has experienced researchers who prepare these templates and write high quality content for you. Later on, you can personalize the content by editing the Aligning Human Resource Hiring Procedure Dashboard To Evaluate HR Recruitment Process Portrait PDF.
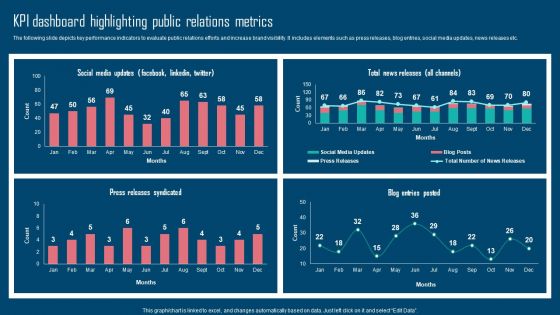
Adopting IMC Technique To Boost Brand Recognition Kpi Dashboard Highlighting Public Relations Metrics Brochure PDF
The following slide depicts key performance indicators to evaluate public relations efforts and increase brand visibility. It includes elements such as press releases, blog entries, social media updates, news releases etc. Formulating a presentation can take up a lot of effort and time, so the content and message should always be the primary focus. The visuals of the PowerPoint can enhance the presenters message, so our Adopting IMC Technique To Boost Brand Recognition Kpi Dashboard Highlighting Public Relations Metrics Brochure PDF was created to help save time. Instead of worrying about the design, the presenter can concentrate on the message while our designers work on creating the ideal templates for whatever situation is needed. Slidegeeks has experts for everything from amazing designs to valuable content, we have put everything into Adopting IMC Technique To Boost Brand Recognition Kpi Dashboard Highlighting Public Relations Metrics Brochure PDF
Reinforcement Learning Techniques And Applications Performance Tracking Dashboard Reinforcement Diagrams PDF
This slide shows the roadmap for the reinforcement learning project, including the list of tasks to be performed from March 2023 to February 2024. The tasks include initializing the values table, observing the current state, choosing an action for that state, and so on. Formulating a presentation can take up a lot of effort and time, so the content and message should always be the primary focus. The visuals of the PowerPoint can enhance the presenters message, so our Reinforcement Learning Techniques And Applications Performance Tracking Dashboard Reinforcement Diagrams PDF was created to help save time. Instead of worrying about the design, the presenter can concentrate on the message while our designers work on creating the ideal templates for whatever situation is needed. Slidegeeks has experts for everything from amazing designs to valuable content, we have put everything into Reinforcement Learning Techniques And Applications Performance Tracking Dashboard Reinforcement Diagrams PDF
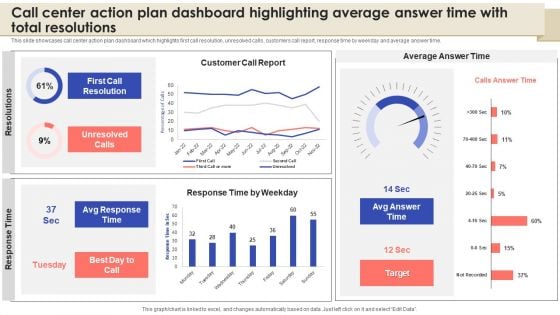
Call Center Action Plan Dashboard Highlighting Average Answer Time With Total Resolutions Themes PDF
Here you can discover an assortment of the finest PowerPoint and Google Slides templates. With these templates, you can create presentations for a variety of purposes while simultaneously providing your audience with an eye catching visual experience. Download Call Center Action Plan Dashboard Highlighting Average Answer Time With Total Resolutions Themes PDF to deliver an impeccable presentation. These templates will make your job of preparing presentations much quicker, yet still, maintain a high level of quality. Slidegeeks has experienced researchers who prepare these templates and write high quality content for you. Later on, you can personalize the content by editing the Call Center Action Plan Dashboard Highlighting Average Answer Time With Total Resolutions Themes PDF.
Lead Generation Dashboard For Tracking Conversion Rates Enhancing Client Lead Conversion Rates Inspiration PDF
This slide covers the KPI dashboard for tracking lead conversion rates. It includes metrics such as visitors, average session rate, per visit, bounce rate, page views, etc. Slidegeeks has constructed Lead Generation Dashboard For Tracking Conversion Rates Enhancing Client Lead Conversion Rates Inspiration PDF after conducting extensive research and examination. These presentation templates are constantly being generated and modified based on user preferences and critiques from editors. Here, you will find the most attractive templates for a range of purposes while taking into account ratings and remarks from users regarding the content. This is an excellent jumping off point to explore our content and will give new users an insight into our top notch PowerPoint Templates.
Lead Generation Dashboard For Tracking Conversion Rates Improving Lead Generation Process Background PDF
This slide covers the KPI dashboard for tracking lead conversion rates. It includes metrics such as visitors, average session rate, per visit, bounce rate, page views, etc. Slidegeeks has constructed Lead Generation Dashboard For Tracking Conversion Rates Improving Lead Generation Process Background PDF after conducting extensive research and examination. These presentation templates are constantly being generated and modified based on user preferences and critiques from editors. Here, you will find the most attractive templates for a range of purposes while taking into account ratings and remarks from users regarding the content. This is an excellent jumping off point to explore our content and will give new users an insight into our top notch PowerPoint Templates.
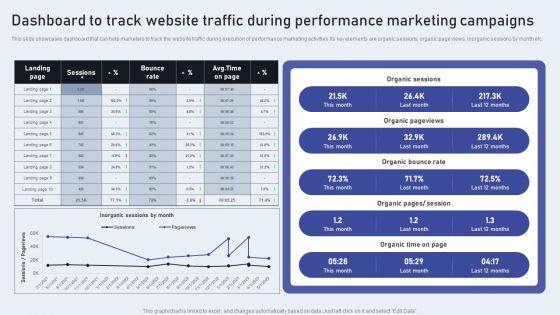
Dashboard To Track Website Traffic During Performance Marketing Campaigns Topics PDF
This slide showcases dashboard that can help marketers to track the website traffic during execution of performance marketing activities.Its key elements are organic sessions, organic page views, inorganic sessions by month etc. Slidegeeks has constructed Dashboard To Track Website Traffic During Performance Marketing Campaigns Topics PDF after conducting extensive research and examination. These presentation templates are constantly being generated and modified based on user preferences and critiques from editors. Here, you will find the most attractive templates for a range of purposes while taking into account ratings and remarks from users regarding the content. This is an excellent jumping-off point to explore our content and will give new users an insight into our top-notch PowerPoint Templates.
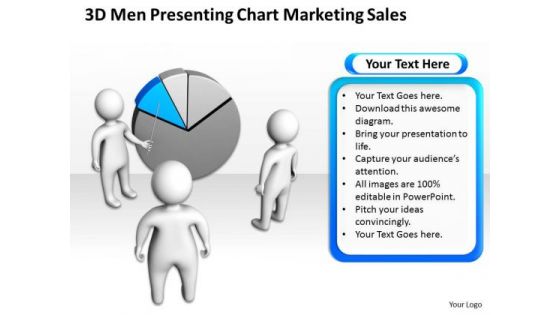
Business Charts Marketing Sales PowerPoint Templates Ppt Backgrounds For Slides
We present our business charts marketing sales PowerPoint templates PPT backgrounds for slides.Download our Communication PowerPoint Templates because Our PowerPoint Templates and Slides will weave a web of your great ideas. They are gauranteed to attract even the most critical of your colleagues. Download our Business PowerPoint Templates because Our PowerPoint Templates and Slides will effectively help you save your valuable time. They are readymade to fit into any presentation structure. Download our Success PowerPoint Templates because You are an avid believer in ethical practices. Highlight the benefits that accrue with our PowerPoint Templates and Slides. Download and present our People PowerPoint Templates because Our PowerPoint Templates and Slides are aesthetically designed to attract attention. We gaurantee that they will grab all the eyeballs you need. Present our Shapes PowerPoint Templates because It will Raise the bar of your Thoughts. They are programmed to take you to the next level.Use these PowerPoint slides for presentations relating to 3d, Arrow, Business, Businessman, Cartoon, Character, Chart, Concept, Corporate, Data, Development, Diagram, Display, Figure, Finance, Financial, Graph, Graphic, Green, Growth, Guy, Human, Icon, Idea, Illustration, Information, Investment, Isolated, Market, Marketing, Men, Office, Part, People, Person, Pie, Presentation, Professional, Progress, Red, Reflection, Report, Shape, Shiny, Sign, Success. The prominent colors used in the PowerPoint template are Blue, Gray, White. Presenters tell us our business charts marketing sales PowerPoint templates PPT backgrounds for slides are aesthetically designed to attract attention. We guarantee that they will grab all the eyeballs you need. PowerPoint presentation experts tell us our Concept PowerPoint templates and PPT Slides will help them to explain complicated concepts. Professionals tell us our business charts marketing sales PowerPoint templates PPT backgrounds for slides are specially created by a professional team with vast experience. They diligently strive to come up with the right vehicle for your brilliant Ideas. People tell us our Cartoon PowerPoint templates and PPT Slides will make the presenter successul in his career/life. The feedback we get is that our business charts marketing sales PowerPoint templates PPT backgrounds for slides provide great value for your money. Be assured of finding the best projection to highlight your words. Customers tell us our Business PowerPoint templates and PPT Slides provide great value for your money. Be assured of finding the best projection to highlight your words. Attain promotions with our Business Charts Marketing Sales PowerPoint Templates Ppt Backgrounds For Slides. You will come out on top.

Sales Management Dashboard With Win Rate Ppt PowerPoint Presentation Show Demonstration PDF
Presenting this set of slides with name sales management dashboard with win rate ppt powerpoint presentation show demonstration pdf. The topics discussed in these slides are team quota attainment for quarter, current sales content, team closed deals qtd, win rate, closed business by type, pipeline top deals. This is a completely editable PowerPoint presentation and is available for immediate download. Download now and impress your audience.
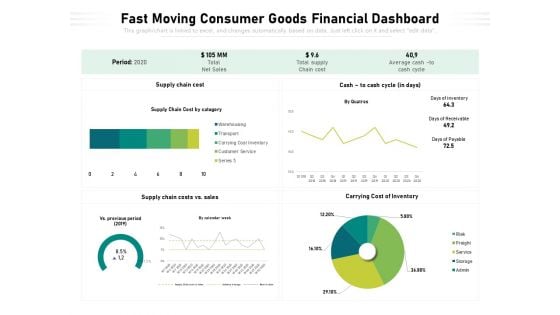
Fast Moving Consumer Goods Financial Dashboard Ppt PowerPoint Presentation Infographic Template Guide PDF
Showcasing this set of slides titled fast moving consumer goods financial dashboard ppt powerpoint presentation infographic template guide pdf. The topics addressed in these templates are supply chain cost, cash to cash cycle in days, supply chain costs vs sales. All the content presented in this PPT design is completely editable. Download it and make adjustments in color, background, font etc. as per your unique business setting.
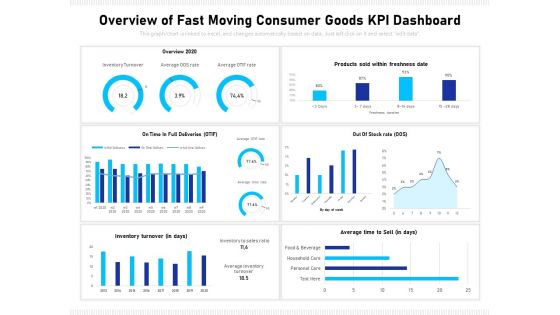
Overview Of Fast Moving Consumer Goods Kpi Dashboard Ppt PowerPoint Presentation Show Visual Aids PDF
Showcasing this set of slides titled overview of fast moving consumer goods kpi dashboard ppt powerpoint presentation show visual aids pdf. The topics addressed in these templates are overview 2020, on time in full deliveries otif, out of stock rate oos, inventory turnover in days, average time to sell in days. All the content presented in this PPT design is completely editable. Download it and make adjustments in color, background, font etc. as per your unique business setting.
CRM System Competitive Dashboard With Sales Pipeline Ppt PowerPoint Presentation Icon Outfit PDF
Showcasing this set of slides titled crm system competitive dashboard with sales pipeline ppt powerpoint presentation icon outfit pdf. The topics addressed in these templates are sales forecast by competitor, win loss report, open opportunity revenue by competitor, sales pipeline by sales rep, competitor. All the content presented in this PPT design is completely editable. Download it and make adjustments in color, background, font etc. as per your unique business setting.

Dashboard For Business Investment Management Ppt PowerPoint Presentation Inspiration Images PDF
Showcasing this set of slides titled dashboard for business investment management ppt powerpoint presentation inspiration images pdf. The topics addressed in these templates are total invested amount, number of investments, rate of return, total investment by assets class. All the content presented in this PPT design is completely editable. Download it and make adjustments in color, background, font etc. as per your unique business setting.
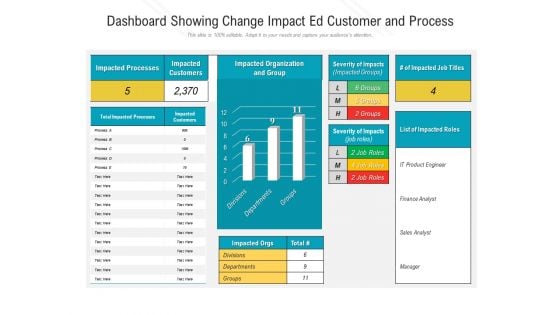
Dashboard Showing Change Impact Ed Customer And Process Ppt Professional Example PDF
Showcasing this set of slides titled dashboard showing change impact ed customer and process ppt professional example pdf. The topics addressed in these templates are impacted processes, impacted customers, impacted organization and group, severity of impacts impacted groups, total impacted processes. All the content presented in this PPT design is completely editable. Download it and make adjustments in colour, background, font etc. as per your unique business setting.


 Continue with Email

 Home
Home


