data analytics
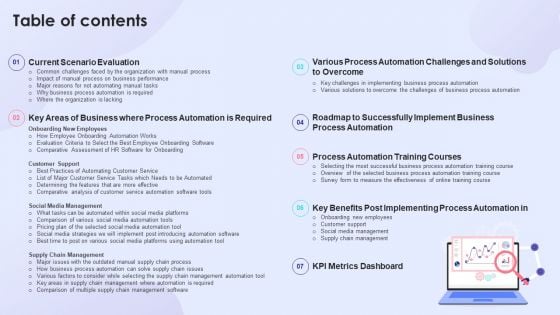
Table Of Contents Enhancing Process Improvement Culture Through Automation Software Brochure PDF
Presenting Table Of Contents Enhancing Process Improvement Culture Through Automation Software Brochure PDF to provide visual cues and insights. Share and navigate important information on seven stages that need your due attention. This template can be used to pitch topics like Current Scenario Evaluation, Process Automation Training Courses, Kpi Metrics Dashboard. In addtion, this PPT design contains high resolution images, graphics, etc, that are easily editable and available for immediate download.

Table Of Contents Digitally Streamline Automation Sales Operations Performance Slides PDF
Presenting Table Of Contents Digitally Streamline Automation Sales Operations Performance Slides PDF to provide visual cues and insights. Share and navigate important information on six stages that need your due attention. This template can be used to pitch topics like Implementation Of Sales, Dashboard And Metrics, Sales Automation. In addtion, this PPT design contains high resolution images, graphics, etc, that are easily editable and available for immediate download.
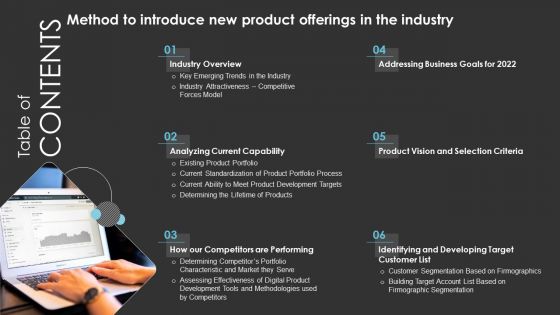
Table Of Contents Method To Introduce New Product Offerings Microsoft PDF
Presenting Table Of Contents Method To Introduce New Product Offerings Microsoft PDF to provide visual cues and insights. Share and navigate important information on thirteen stages that need your due attention. This template can be used to pitch topics like Product Portfolio Roadmap, Performance Evaluation Dashboards, Optimize Sales. In addtion, this PPT design contains high resolution images, graphics, etc, that are easily editable and available for immediate download.
Dashboard For Tracking Impact Of Supply Chain Automation Inspiration PDF
This slide covers the dashboard for back-end tracking of overall impact automation. It include KPIs such as retailer capacity, warehouse capacity, truck efficiency, time to reach warehouse, sustainability, etc. Do you have an important presentation coming up Are you looking for something that will make your presentation stand out from the rest Look no further than Dashboard For Tracking Impact Of Supply Chain Automation Inspiration PDF. With our professional designs, you can trust that your presentation will pop and make delivering it a smooth process. And with Slidegeeks, you can trust that your presentation will be unique and memorable. So why wait Grab Dashboard For Tracking Impact Of Supply Chain Automation Inspiration PDF today and make your presentation stand out from the rest.
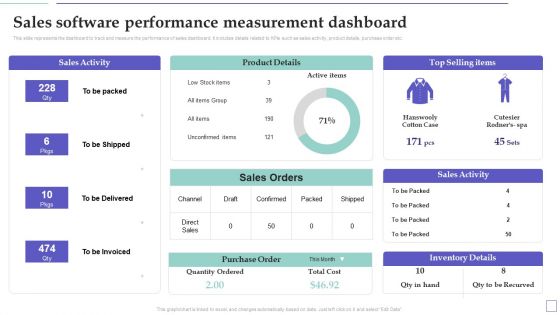
System Deployment Project Sales Software Performance Measurement Dashboard Summary PDF
This slide represents the dashboard to track and measure the performance of sales dashboard. It includes details related to KPIs such as sales activity, product details, purchase order etc. Welcome to our selection of the System Deployment Project Sales Software Performance Measurement Dashboard Summary PDF. These are designed to help you showcase your creativity and bring your sphere to life. Planning and Innovation are essential for any business that is just starting out. This collection contains the designs that you need for your everyday presentations. All of our PowerPoints are 100 percent editable, so you can customize them to suit your needs. This multi-purpose template can be used in various situations. Grab these presentation templates today.
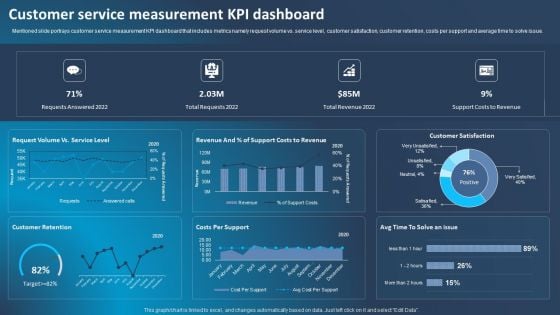
Improving Corporate Performance Customer Service Measurement Kpi Dashboard Microsoft PDF
Mentioned slide portrays customer service measurement KPI dashboard that includes metrics namely request volume vs. service level, customer satisfaction, customer retention, costs per support and average time to solve issue. Do you have to make sure that everyone on your team knows about any specific topic I yes, then you should give Improving Corporate Performance Customer Service Measurement Kpi Dashboard Microsoft PDF a try. Our experts have put a lot of knowledge and effort into creating this impeccable Improving Corporate Performance Customer Service Measurement Kpi Dashboard Microsoft PDF. You can use this template for your upcoming presentations, as the slides are perfect to represent even the tiniest detail. You can download these templates from the Slidegeeks website and these are easy to edit. So grab these today.
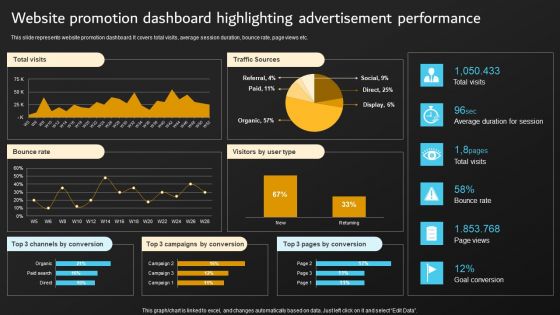
Implementation Of Digital Marketing Website Promotion Dashboard Highlighting Guidelines PDF
This slide represents website promotion dashboard. It covers total visits, average session duration, bounce rate, page views etc. Do you have to make sure that everyone on your team knows about any specific topic I yes, then you should give Implementation Of Digital Marketing Website Promotion Dashboard Highlighting Guidelines PDF a try. Our experts have put a lot of knowledge and effort into creating this impeccable Implementation Of Digital Marketing Website Promotion Dashboard Highlighting Guidelines PDF. You can use this template for your upcoming presentations, as the slides are perfect to represent even the tiniest detail. You can download these templates from the Slidegeeks website and these are easy to edit. So grab these today.

Enterprise Risk Management Enterprise Cyber Risk Management Dashboard Infographics PDF
This slide represents dashboard representing details related to management of strategic risks in the organization. It includes details related to risk rating breakdown, risk heat map, top 5 vulnerabilities etc. Do you have an important presentation coming up Are you looking for something that will make your presentation stand out from the rest Look no further than Enterprise Risk Management Enterprise Cyber Risk Management Dashboard Infographics PDF. With our professional designs, you can trust that your presentation will pop and make delivering it a smooth process. And with Slidegeeks, you can trust that your presentation will be unique and memorable. So why wait Grab Enterprise Risk Management Enterprise Cyber Risk Management Dashboard Infographics PDF today and make your presentation stand out from the rest.
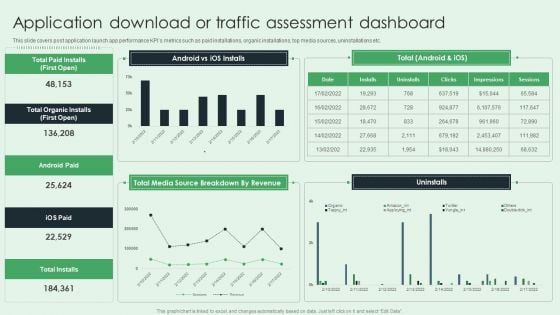
Application Download Or Traffic Assessment Dashboard Formats PDF
This slide covers post application launch app performance KPIs metrics such as paid installations, organic installations, top media sources, uninstallations etc. Presenting this PowerPoint presentation, titled Application Download Or Traffic Assessment Dashboard Formats PDF, with topics curated by our researchers after extensive research. This editable presentation is available for immediate download and provides attractive features when used. Download now and captivate your audience. Presenting this Application Download Or Traffic Assessment Dashboard Formats PDF. Our researchers have carefully researched and created these slides with all aspects taken into consideration. This is a completely customizable Application Download Or Traffic Assessment Dashboard Formats PDF that is available for immediate downloading. Download now and make an impact on your audience. Highlight the attractive features available with our PPTs.
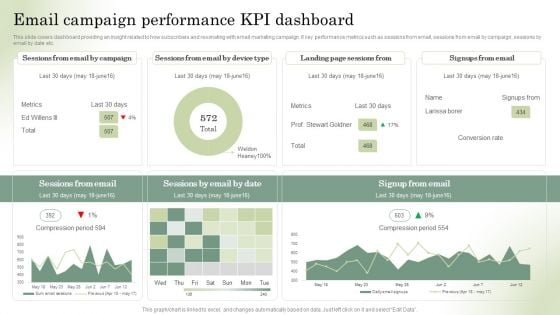
Optimizing Online Stores Email Campaign Performance KPI Dashboard Graphics PDF
This slide covers dashboard providing an insight related to how subscribers and resonating with email marketing campaign. It key performance metrics such as sessions from email, sessions from email by campaign, sessions by email by date etc. Crafting an eye-catching presentation has never been more straightforward. Let your presentation shine with this tasteful yet straightforward Optimizing Online Stores Email Campaign Performance KPI Dashboard Graphics PDF template. It offers a minimalistic and classy look that is great for making a statement. The colors have been employed intelligently to add a bit of playfulness while still remaining professional. Construct the ideal Optimizing Online Stores Email Campaign Performance KPI Dashboard Graphics PDF that effortlessly grabs the attention of your audience Begin now and be certain to wow your customers.
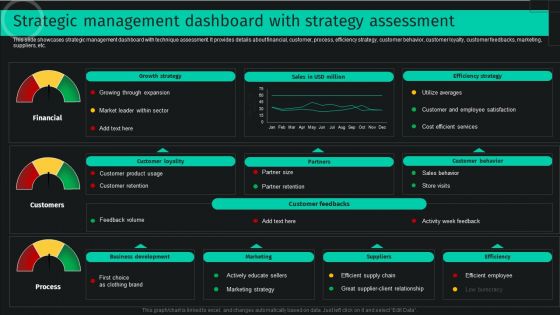
Strategic Management Dashboard With Strategy Assessment Sample PDF
This slide showcases strategic management dashboard with technique assessment. It provides details about financial, customer, process, efficiency strategy, customer behavior, customer loyalty, customer feedbacks, marketing, suppliers, etc. Do you have to make sure that everyone on your team knows about any specific topic I yes, then you should give Strategic Management Dashboard With Strategy Assessment Sample PDF a try. Our experts have put a lot of knowledge and effort into creating this impeccable Strategic Management Dashboard With Strategy Assessment Sample PDF. You can use this template for your upcoming presentations, as the slides are perfect to represent even the tiniest detail. You can download these templates from the Slidegeeks website and these are easy to edit. So grab these today.
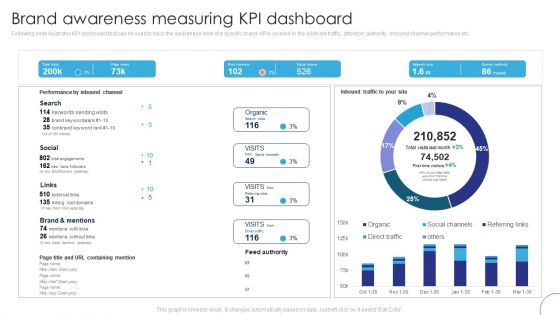
Implementing Brand Leadership Brand Awareness Measuring Kpi Dashboard Template PDF
Following slide illustrates KPI dashboard that can be used to track the awareness level of a specific brand. KPIs covered in the slide are traffic, attention, authority, inbound channel performance etc. Get a simple yet stunning designed Implementing Brand Leadership Brand Awareness Measuring Kpi Dashboard Template PDF. It is the best one to establish the tone in your meetings. It is an excellent way to make your presentations highly effective. So, download this PPT today from Slidegeeks and see the positive impacts. Our easy-to-edit Implementing Brand Leadership Brand Awareness Measuring Kpi Dashboard Template PDF can be your go-to option for all upcoming conferences and meetings. So, what are you waiting for Grab this template today.
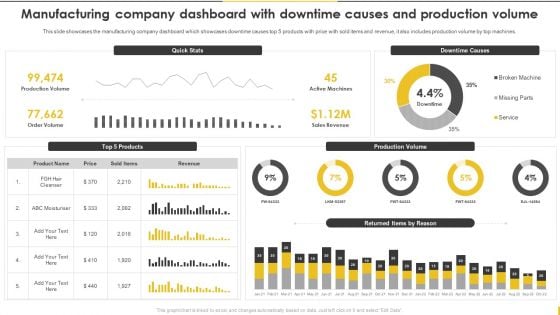
Customer Goods Production Manufacturing Company Dashboard With Downtime Pictures PDF
This slide showcases the manufacturing company dashboard which showcases downtime causes top 5 products with price with sold items and revenue, it also includes production volume by top machines. This Customer Goods Production Manufacturing Company Dashboard With Downtime Pictures PDF is perfect for any presentation, be it in front of clients or colleagues. It is a versatile and stylish solution for organizing your meetings. The Customer Goods Production Manufacturing Company Dashboard With Downtime Pictures PDF features a modern design for your presentation meetings. The adjustable and customizable slides provide unlimited possibilities for acing up your presentation. Slidegeeks has done all the homework before launching the product for you. So, dont wait, grab the presentation templates today.
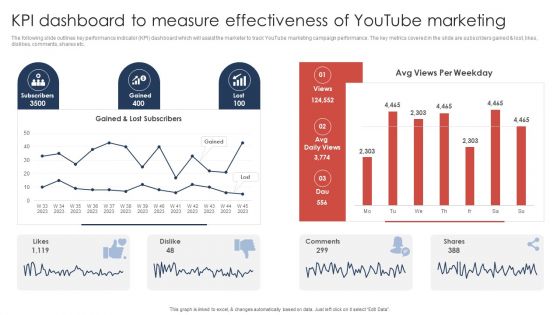
Kpi Dashboard To Measure Effectiveness Of Youtube Marketing Slides PDF
The following slide outlines key performance indicator KPI dashboard which will assist the marketer to track YouTube marketing campaign performance. The key metrics covered in the slide are subscribers gained and lost, likes, dislikes, comments, shares etc. Do you have an important presentation coming up Are you looking for something that will make your presentation stand out from the rest Look no further than Kpi Dashboard To Measure Effectiveness Of Youtube Marketing Slides PDF. With our professional designs, you can trust that your presentation will pop and make delivering it a smooth process. And with Slidegeeks, you can trust that your presentation will be unique and memorable. So why wait Grab Kpi Dashboard To Measure Effectiveness Of Youtube Marketing Slides PDF today and make your presentation stand out from the rest.
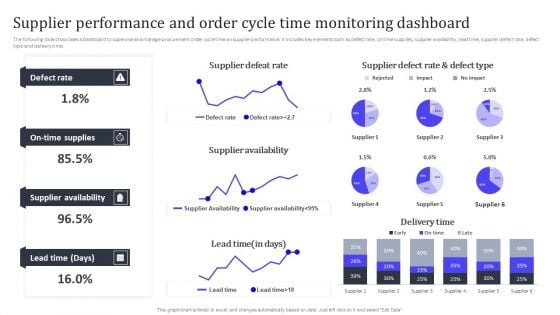
Supplier Performance And Order Cycle Time Monitoring Dashboard Introduction PDF
The following slide showcases a dashboard to supervise and manage procurement order cycle time an supplier performance. It includes key elements such as defect rate, on time supplies, supplier availability, lead time, supplier defect rate, defect type and delivery time. Do you have to make sure that everyone on your team knows about any specific topic I yes, then you should give Supplier Performance And Order Cycle Time Monitoring Dashboard Introduction PDF a try. Our experts have put a lot of knowledge and effort into creating this impeccable Supplier Performance And Order Cycle Time Monitoring Dashboard Introduction PDF. You can use this template for your upcoming presentations, as the slides are perfect to represent even the tiniest detail. You can download these templates from the Slidegeeks website and these are easy to edit. So grab these today.
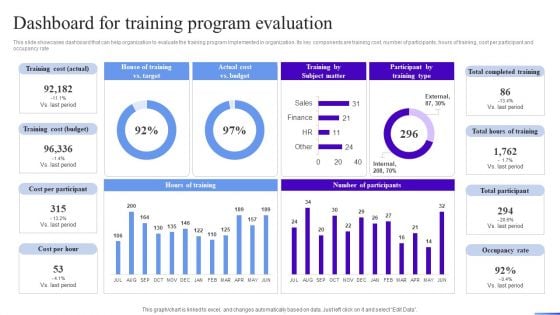
Business Development Program Dashboard For Training Program Evaluation Infographics PDF
This slide showcases dashboard that can help organization to evaluate the training program implemented in organization. Its key components are training cost, number of participants, hours of training, cost per participant and occupancy rate. Get a simple yet stunning designed Business Development Program Dashboard For Training Program Evaluation Infographics PDF. It is the best one to establish the tone in your meetings. It is an excellent way to make your presentations highly effective. So, download this PPT today from Slidegeeks and see the positive impacts. Our easy-to-edit Business Development Program Dashboard For Training Program Evaluation Infographics PDF can be your go-to option for all upcoming conferences and meetings. So, what are you waiting for Grab this template today.
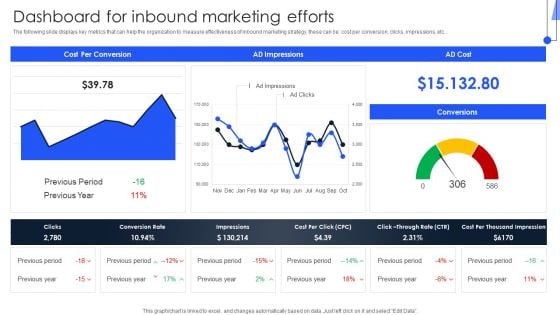
Implementing Marketing Strategies Dashboard For Inbound Marketing Efforts Guidelines PDF
The following slide displays key metrics that can help the organization to measure effectiveness of inbound marketing strategy, these can be cost per conversion, clicks, impressions, etc. Presenting this PowerPoint presentation, titled Implementing Marketing Strategies Dashboard For Inbound Marketing Efforts Guidelines PDF, with topics curated by our researchers after extensive research. This editable presentation is available for immediate download and provides attractive features when used. Download now and captivate your audience. Presenting this Implementing Marketing Strategies Dashboard For Inbound Marketing Efforts Guidelines PDF. Our researchers have carefully researched and created these slides with all aspects taken into consideration. This is a completely customizable Implementing Marketing Strategies Dashboard For Inbound Marketing Efforts Guidelines PDF that is available for immediate downloading. Download now and make an impact on your audience. Highlight the attractive features available with our PPTs.
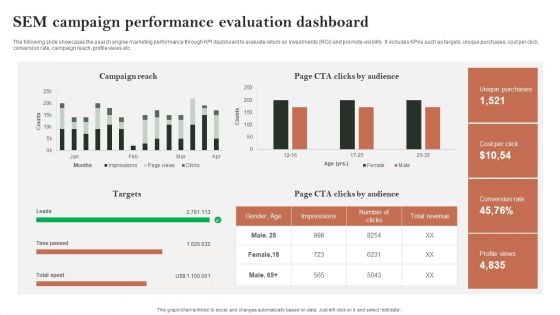
Search Engine Marketing Sem Campaign Performance Evaluation Dashboard Mockup PDF
The following slide showcases the search engine marketing performance through KPI dashboard to evaluate return on investments ROI and promote visibility. It includes KPAs such as targets, unique purchases, cost per click, conversion rate, campaign reach, profile views etc. Crafting an eye-catching presentation has never been more straightforward. Let your presentation shine with this tasteful yet straightforward Search Engine Marketing Sem Campaign Performance Evaluation Dashboard Mockup PDF template. It offers a minimalistic and classy look that is great for making a statement. The colors have been employed intelligently to add a bit of playfulness while still remaining professional. Construct the ideal Search Engine Marketing Sem Campaign Performance Evaluation Dashboard Mockup PDF that effortlessly grabs the attention of your audience Begin now and be certain to wow your customers.
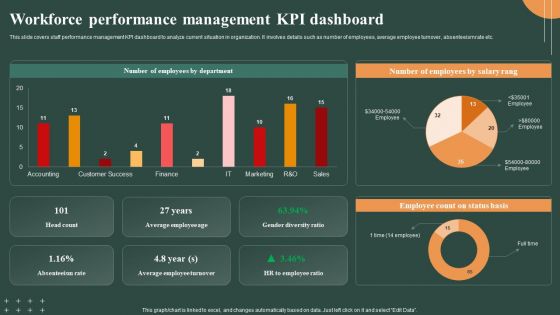
Techniques To Optimize Workforce Performance Management Kpi Dashboard Professional PDF
This slide covers staff performance management KPI dashboard to analyze current situation in organization. It involves details such as number of employees, average employee turnover, absenteeism rate etc. Whether you have daily or monthly meetings, a brilliant presentation is necessary. Techniques To Optimize Workforce Performance Management Kpi Dashboard Professional PDF can be your best option for delivering a presentation. Represent everything in detail using Techniques To Optimize Workforce Performance Management Kpi Dashboard Professional PDF and make yourself stand out in meetings. The template is versatile and follows a structure that will cater to your requirements. All the templates prepared by Slidegeeks are easy to download and edit. Our research experts have taken care of the corporate themes as well. So, give it a try and see the results.
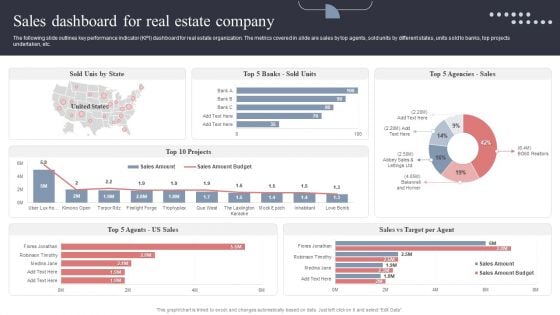
Sales Dashboard For Real Estate Company Topics PDF
The following slide outlines key performance indicator KPI dashboard for real estate organization. The metrics covered in slide are sales by top agents, sold units by different states, units sold to banks, top projects undertaken, etc. This Sales Dashboard For Real Estate Company Topics PDF is perfect for any presentation, be it in front of clients or colleagues. It is a versatile and stylish solution for organizing your meetings. The Sales Dashboard For Real Estate Company Topics PDF features a modern design for your presentation meetings. The adjustable and customizable slides provide unlimited possibilities for acing up your presentation. Slidegeeks has done all the homework before launching the product for you. So, do not wait, grab the presentation templates today
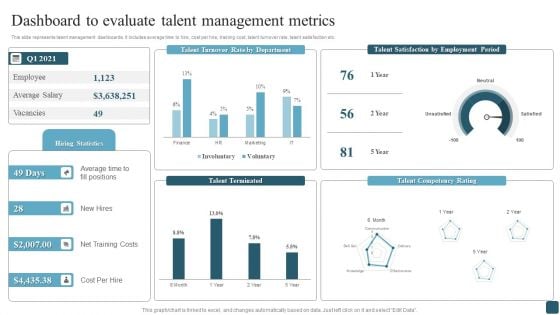
Dashboard To Evaluate Talent Management Metrics Professional PDF
This slide represents talent management dashboards. It includes average time to hire, cost per hire, training cost, talent turnover rate, talent satisfaction etc. Whether you have daily or monthly meetings, a brilliant presentation is necessary. Dashboard To Evaluate Talent Management Metrics Professional PDF can be your best option for delivering a presentation. Represent everything in detail using Dashboard To Evaluate Talent Management Metrics Professional PDF and make yourself stand out in meetings. The template is versatile and follows a structure that will cater to your requirements. All the templates prepared by Slidegeeks are easy to download and edit. Our research experts have taken care of the corporate themes as well. So, give it a try and see the results.
CRM Dashboard For Tracking Sales Pipeline Brochure PDF
This slide covers the CRM KPI dashboard for monitoring lead status in the sales funnel. It includes metrics such as open pipeline value, open pipeline by product package, pipeline value forecast, etc. Crafting an eye catching presentation has never been more straightforward. Let your presentation shine with this tasteful yet straightforward CRM Dashboard For Tracking Sales Pipeline Brochure PDF template. It offers a minimalistic and classy look that is great for making a statement. The colors have been employed intelligently to add a bit of playfulness while still remaining professional. Construct the ideal CRM Dashboard For Tracking Sales Pipeline Brochure PDF that effortlessly grabs the attention of your audience Begin now and be certain to wow your customers.
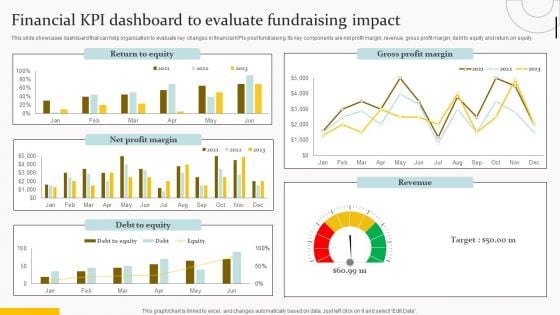
Financial Kpi Dashboard To Evaluate Fundraising Impact Topics PDF
This slide showcases dashboard that can help organization to evaluate key changes in financial KPIs post fundraising. Its key components are net profit margin, revenue, gross profit margin, debt to equity and return on equity. Do you have to make sure that everyone on your team knows about any specific topic I yes, then you should give Financial Kpi Dashboard To Evaluate Fundraising Impact Topics PDF a try. Our experts have put a lot of knowledge and effort into creating this impeccable Financial Kpi Dashboard To Evaluate Fundraising Impact Topics PDF. You can use this template for your upcoming presentations, as the slides are perfect to represent even the tiniest detail. You can download these templates from the Slidegeeks website and these are easy to edit. So grab these today.
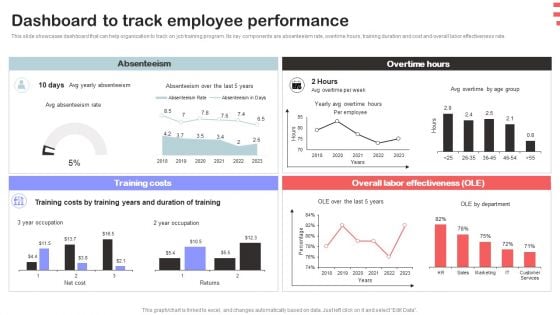
Corporate Training Program Dashboard To Track Employee Performance Portrait PDF
This slide showcases dashboard that can help organization to track on job training program. Its key components are absenteeism rate, overtime hours, training duration and cost and overall labor effectiveness rate. Crafting an eye catching presentation has never been more straightforward. Let your presentation shine with this tasteful yet straightforward Corporate Training Program Dashboard To Track Employee Performance Portrait PDF template. It offers a minimalistic and classy look that is great for making a statement. The colors have been employed intelligently to add a bit of playfulness while still remaining professional. Construct the ideal Corporate Training Program Dashboard To Track Employee Performance Portrait PDF that effortlessly grabs the attention of your audience. Begin now and be certain to wow your customers.
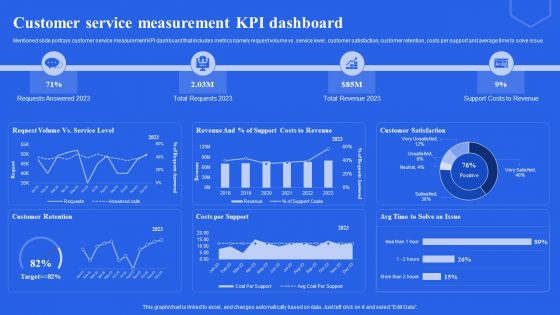
Customer Service Measurement KPI Dashboard Ppt File Portfolio PDF
Mentioned slide portrays customer service measurement KPI dashboard that includes metrics namely request volume vs. service level, customer satisfaction, customer retention, costs per support and average time to solve issue. Do you have to make sure that everyone on your team knows about any specific topic I yes, then you should give Customer Service Measurement KPI Dashboard Ppt File Portfolio PDF a try. Our experts have put a lot of knowledge and effort into creating this impeccable Customer Service Measurement KPI Dashboard Ppt File Portfolio PDF. You can use this template for your upcoming presentations, as the slides are perfect to represent even the tiniest detail. You can download these templates from the Slidegeeks website and these are easy to edit. So grab these today.
Website Performance Tracking And Monitoring Dashboard Ppt Summary Rules PDF
The following slide showcases a dashboard to track and measure website performance. It includes key elements such as visits, average session duration, bounce rate, page views, goal conversion, visits by week, traffic sources, top channels by conversions, etc. Do you have to make sure that everyone on your team knows about any specific topic I yes, then you should give Website Performance Tracking And Monitoring Dashboard Ppt Summary Rules PDF a try. Our experts have put a lot of knowledge and effort into creating this impeccable Website Performance Tracking And Monitoring Dashboard Ppt Summary Rules PDF. You can use this template for your upcoming presentations, as the slides are perfect to represent even the tiniest detail. You can download these templates from the Slidegeeks website and these are easy to edit. So grab these today.
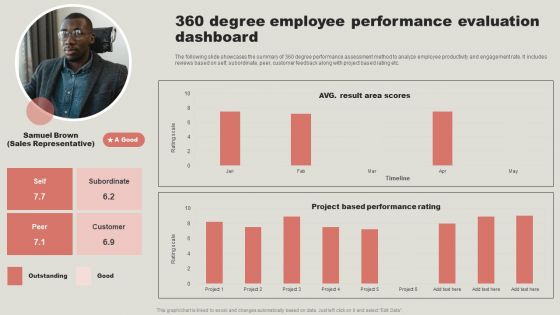
360 Degree Employee Performance Evaluation Dashboard Elements PDF
The following slide showcases the summary of 360 degree performance assessment method to analyze employee productivity and engagement rate. It includes reviews based on self, subordinate, peer, customer feedback along with project based rating etc. Presenting this PowerPoint presentation, titled 360 Degree Employee Performance Evaluation Dashboard Elements PDF, with topics curated by our researchers after extensive research. This editable presentation is available for immediate download and provides attractive features when used. Download now and captivate your audience. Presenting this 360 Degree Employee Performance Evaluation Dashboard Elements PDF. Our researchers have carefully researched and created these slides with all aspects taken into consideration. This is a completely customizable 360 Degree Employee Performance Evaluation Dashboard Elements PDF that is available for immediate downloading. Download now and make an impact on your audience. Highlight the attractive features available with our PPTs.
Website Performance Tracking And Monitoring Dashboard Ppt Slides Files PDF
The following slide showcases a dashboard to track and measure website performance. It includes key elements such as visits, average session duration, bounce rate, page views, goal conversion, visits by week, traffic sources, top channels by conversions, etc. Whether you have daily or monthly meetings, a brilliant presentation is necessary. Website Performance Tracking And Monitoring Dashboard Ppt Slides Files PDF can be your best option for delivering a presentation. Represent everything in detail using Website Performance Tracking And Monitoring Dashboard Ppt Slides Files PDF and make yourself stand out in meetings. The template is versatile and follows a structure that will cater to your requirements. All the templates prepared by Slidegeeks are easy to download and edit. Our research experts have taken care of the corporate themes as well. So, give it a try and see the results.
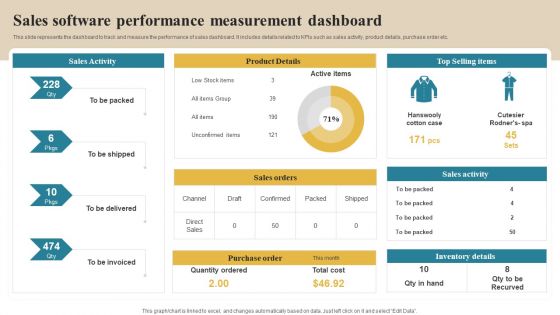
Software Implementation Technique Sales Software Performance Measurement Dashboard Slides PDF
This slide represents the dashboard to track and measure the performance of sales dashboard. It includes details related to KPIs such as sales activity, product details, purchase order etc. This modern and well arranged Software Implementation Technique Sales Software Performance Measurement Dashboard Slides PDF provides lots of creative possibilities. It is very simple to customize and edit with the Powerpoint Software. Just drag and drop your pictures into the shapes. All facets of this template can be edited with Powerpoint no extra software is necessary. Add your own material, put your images in the places assigned for them, adjust the colors, and then you can show your slides to the world, with an animated slide included.
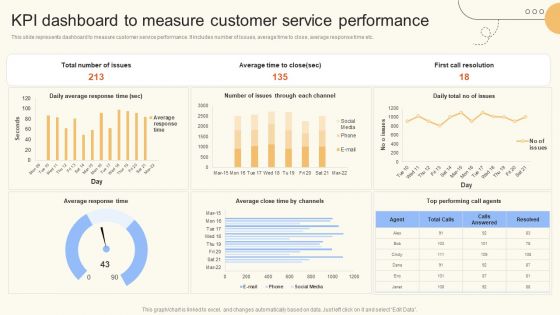
KPI Dashboard To Measure Customer Service Performance Pictures PDF
This slide represents dashboard to measure customer service performance. It includes number of issues, average time to close, average response time etc. Whether you have daily or monthly meetings, a brilliant presentation is necessary. KPI Dashboard To Measure Customer Service Performance Pictures PDF can be your best option for delivering a presentation. Represent everything in detail using KPI Dashboard To Measure Customer Service Performance Pictures PDF and make yourself stand out in meetings. The template is versatile and follows a structure that will cater to your requirements. All the templates prepared by Slidegeeks are easy to download and edit. Our research experts have taken care of the corporate themes as well. So, give it a try and see the results.
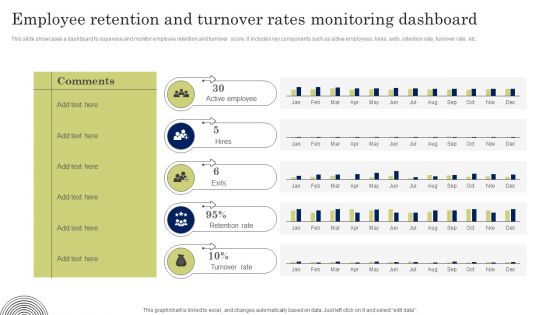
Employee Retention And Turnover Rates Monitoring Dashboard Designs PDF
This slide showcases a dashboard to supervise and monitor employee retention and turnover score. It includes key components such as active employees, hires, exits, retention rate, turnover rate, etc. Whether you have daily or monthly meetings, a brilliant presentation is necessary. Employee Retention And Turnover Rates Monitoring Dashboard Designs PDF can be your best option for delivering a presentation. Represent everything in detail using Employee Retention And Turnover Rates Monitoring Dashboard Designs PDF and make yourself stand out in meetings. The template is versatile and follows a structure that will cater to your requirements. All the templates prepared by Slidegeeks are easy to download and edit. Our research experts have taken care of the corporate themes as well. So, give it a try and see the results.
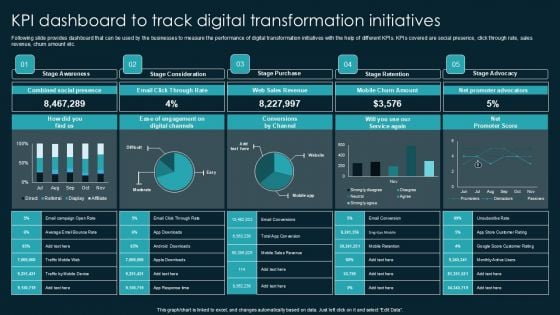
Kpi Dashboard To Track Digital Transformation Initiatives Formats PDF
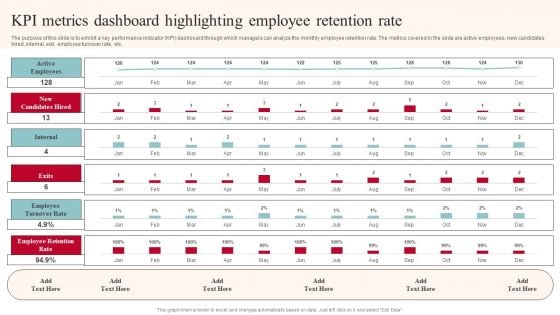
KPI Metrics Dashboard Highlighting Employee Retention Rate Structure PDF
The purpose of this slide is to exhibit a key performance indicator KPI dashboard through which managers can analyze the monthly employee retention rate. The metrics covered in the slide are active employees, new candidates hired, internal, exit, employee turnover rate, etc. Do you have to make sure that everyone on your team knows about any specific topic I yes, then you should give KPI Metrics Dashboard Highlighting Employee Retention Rate Structure PDF a try. Our experts have put a lot of knowledge and effort into creating this impeccable KPI Metrics Dashboard Highlighting Employee Retention Rate Structure PDF. You can use this template for your upcoming presentations, as the slides are perfect to represent even the tiniest detail. You can download these templates from the Slidegeeks website and these are easy to edit. So grab these today.
Dashboard Tracking Warehouse Capacity And Utilization Metrics Icons PDF
This slide represents a dashboard providing an enterprise-level view of warehouse capacity and utilization to enable process improvements. It monitors KPIs such as shelf capacity used by inventory type, storage device, honeycomb percentage, days on hand by inventory type, and by items. Create an editable Dashboard Tracking Warehouse Capacity And Utilization Metrics Icons PDF that communicates your idea and engages your audience. Whether you are presenting a business or an educational presentation, pre-designed presentation templates help save time. Dashboard Tracking Warehouse Capacity And Utilization Metrics Icons PDF is highly customizable and very easy to edit, covering many different styles from creative to business presentations. Slidegeeks has creative team members who have crafted amazing templates. So, go and get them without any delay.
SMS Marketing Automated Campaigns Performance Tracking Dashboard Professional PDF
This slide represents the key metrics dashboard to track, monitor and analyze the performance of SMS marketing automated campaign. It includes details related to KPIs such as new subscribers, responses received, total earned and top live automations etc. Get a simple yet stunning designed SMS Marketing Automated Campaigns Performance Tracking Dashboard Professional PDF. It is the best one to establish the tone in your meetings. It is an excellent way to make your presentations highly effective. So, download this PPT today from Slidegeeks and see the positive impacts. Our easy to edit SMS Marketing Automated Campaigns Performance Tracking Dashboard Professional PDF can be your go to option for all upcoming conferences and meetings. So, what are you waiting for Grab this template today.
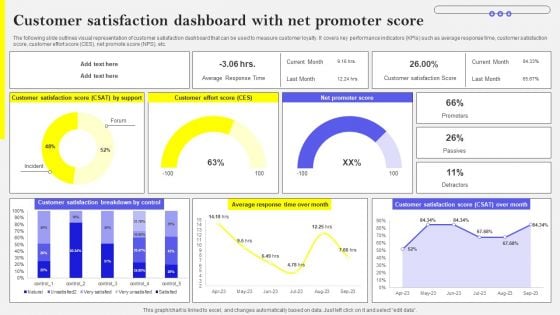
Customer Satisfaction Dashboard With Net Promoter Score Introduction PDF
The following slide outlines visual representation of customer satisfaction dashboard that can be used to measure customer loyalty. It covers key performance indicators KPIs such as average response time, customer satisfaction score, customer effort score CES, net promote score NPS, etc. Do you have to make sure that everyone on your team knows about any specific topic I yes, then you should give Customer Satisfaction Dashboard With Net Promoter Score Introduction PDF a try. Our experts have put a lot of knowledge and effort into creating this impeccable Customer Satisfaction Dashboard With Net Promoter Score Introduction PDF. You can use this template for your upcoming presentations, as the slides are perfect to represent even the tiniest detail. You can download these templates from the Slidegeeks website and these are easy to edit. So grab these today
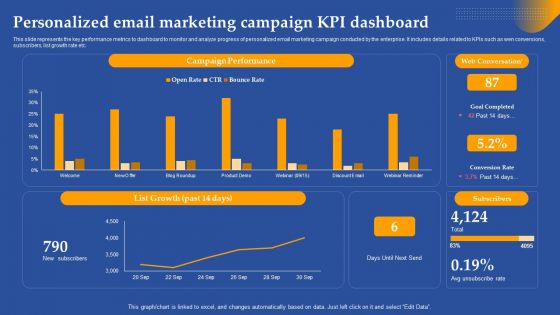
Personalized Email Marketing Campaign KPI Dashboard Ppt Outline Example PDF
This slide represents the key performance metrics to dashboard to monitor and analyze progress of personalized email marketing campaign conducted by the enterprise. It includes details related to KPIs such as wen conversions, subscribers, list growth rate etc. Do you have to make sure that everyone on your team knows about any specific topic I yes, then you should give Personalized Email Marketing Campaign KPI Dashboard Ppt Outline Example PDF a try. Our experts have put a lot of knowledge and effort into creating this impeccable Personalized Email Marketing Campaign KPI Dashboard Ppt Outline Example PDF. You can use this template for your upcoming presentations, as the slides are perfect to represent even the tiniest detail. You can download these templates from the Slidegeeks website and these are easy to edit. So grab these today.
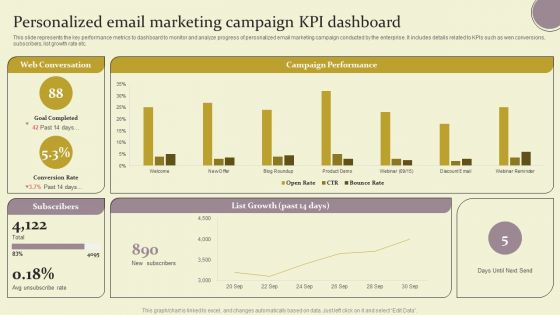
Personalized Email Marketing Campaign KPI Dashboard Ppt Professional Ideas PDF
This slide represents the key performance metrics to dashboard to monitor and analyze progress of personalized email marketing campaign conducted by the enterprise. It includes details related to KPIs such as wen conversions, subscribers, list growth rate etc. Do you have to make sure that everyone on your team knows about any specific topic I yes, then you should give Personalized Email Marketing Campaign KPI Dashboard Ppt Professional Ideas PDF a try. Our experts have put a lot of knowledge and effort into creating this impeccable Personalized Email Marketing Campaign KPI Dashboard Ppt Professional Ideas PDF. You can use this template for your upcoming presentations, as the slides are perfect to represent even the tiniest detail. You can download these templates from the Slidegeeks website and these are easy to edit. So grab these today.
Unlocking Potential Enhancing Team Members Performance Tracking Dashboards
This slide depicts performance tracking dashboard for project manager to analyze work being done by the team. It includes average rating for the week, total work done and weekly change, employee rating and work done. Take your projects to the next level with our ultimate collection of Unlocking Potential Enhancing Team Members Performance Tracking Dashboards. Slidegeeks has designed a range of layouts that are perfect for representing task or activity duration, keeping track of all your deadlines at a glance. Tailor these designs to your exact needs and give them a truly corporate look with your own brand colors they will make your projects stand out from the rest This slide depicts performance tracking dashboard for project manager to analyze work being done by the team. It includes average rating for the week, total work done and weekly change, employee rating and work done.
Unlocking Potential Enhancing Team Training And Development Program Tracking Dashboard
This slide depicts team development program tracking dashboard to analyze the impact of implementing training plan for the members. It includes training satisfaction rate, engagement score, drop-out rate and top 5 trainees. Find a pre-designed and impeccable Unlocking Potential Enhancing Team Training And Development Program Tracking Dashboard. The templates can ace your presentation without additional effort. You can download these easy-to-edit presentation templates to make your presentation stand out from others. So, what are you waiting for Download the template from Slidegeeks today and give a unique touch to your presentation. This slide depicts team development program tracking dashboard to analyze the impact of implementing training plan for the members. It includes training satisfaction rate, engagement score, drop-out rate and top 5 trainees.

Skill Enhancement Performance Organization Staff Performance Evaluation Dashboard
This slide illustrate dashboard for staff performance evaluation for boosting performance level. it includes elements such as average employee age, average employee tenure, gender diversity ratio etc. Slidegeeks is here to make your presentations a breeze with Skill Enhancement Performance Organization Staff Performance Evaluation Dashboard With our easy-to-use and customizable templates, you can focus on delivering your ideas rather than worrying about formatting. With a variety of designs to choose from, you are sure to find one that suits your needs. And with animations and unique photos, illustrations, and fonts, you can make your presentation pop. So whether you are giving a sales pitch or presenting to the board, make sure to check out Slidegeeks first This slide illustrate dashboard for staff performance evaluation for boosting performance level. it includes elements such as average employee age, average employee tenure, gender diversity ratio etc.
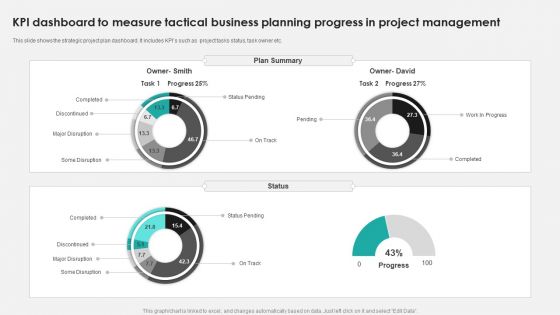
KPI Dashboard To Measure Tactical Business Planning Progress In Project Management Ppt PowerPoint Presentation File Example File PDF
This slide shows the strategic project plan dashboard. It includes KPIs such as project tasks status, task owner etc. Showcasing this set of slides titled KPI Dashboard To Measure Tactical Business Planning Progress In Project Management Ppt PowerPoint Presentation File Example File PDF. The topics addressed in these templates are Discontinued, Some Disruption, Completed. All the content presented in this PPT design is completely editable. Download it and make adjustments in color, background, font etc. as per your unique business setting.
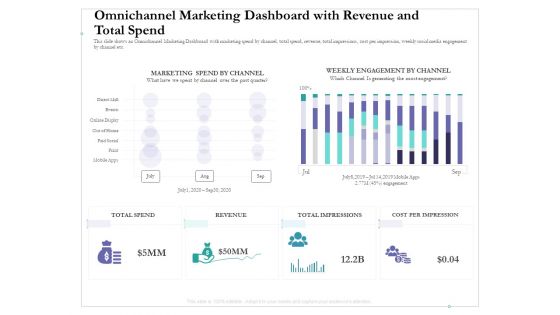
Omnichannel Marketing Dashboard With Revenue And Total Spend Structure PDF
This slide shows an Omnichannel Marketing Dashboard with marketing spend by channel, total spend, revenue, total impressions, cost per impression, weekly social media engagement by channel etc. Deliver and pitch your topic in the best possible manner with this omnichannel marketing dashboard with revenue and total spend structure pdf. Use them to share invaluable insights on marketing spend by channel, weekly engagement by channel, cost per impression and impress your audience. This template can be altered and modified as per your expectations. So, grab it now.
Modifying Banking Functionalities Dashboard Tracking Online Banking Activities Background PDF
This slide contains dashboard that will allow bank to track the online customer activities in terms of new customer connected with bank on online platform, fraud prevention. It will also help the bank in tracking the numbers of employees that are connected to bank through mobile access. Deliver and pitch your topic in the best possible manner with this enhancing financial institution operations dashboard tracking online banking activities rules pdf. Use them to share invaluable insights on management, service, access and impress your audience. This template can be altered and modified as per your expectations. So, grab it now.
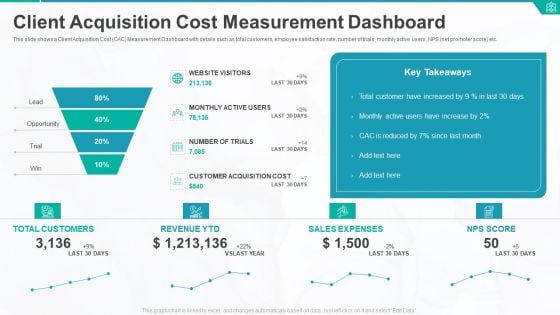
Client Acquisition Cost Measurement Dashboard Ppt Portfolio Graphic Tips PDF
This slide shows a Client Acquisition Cost CAC Measurement Dashboard with details such as total customers, employee satisfaction rate, number of trials, monthly active users, NPS net promoter score etc. Deliver and pitch your topic in the best possible manner with this client acquisition cost measurement dashboard ppt portfolio graphic tips pdf. Use them to share invaluable insights on total customers, revenue, sales expenses, nps score and impress your audience. This template can be altered and modified as per your expectations. So, grab it now.

Shopping Cart Conversion Rate Dashboard Ppt Model Graphics PDF
This slide shows shopping cart conversion rate dashboard. It includes details of online revenue share, shipping error rate, shopping cart conversion rate, coupon conversion, product views per session and revenue per visitors. Deliver an awe-inspiring pitch with this creative shopping cart conversion rate dashboard ppt model graphics pdf. bundle. Topics like shopping cart conversion rate, coupon cart conversion, product views per session, revenue per visitors, avg product views can be discussed with this completely editable template. It is available for immediate download depending on the needs and requirements of the user.
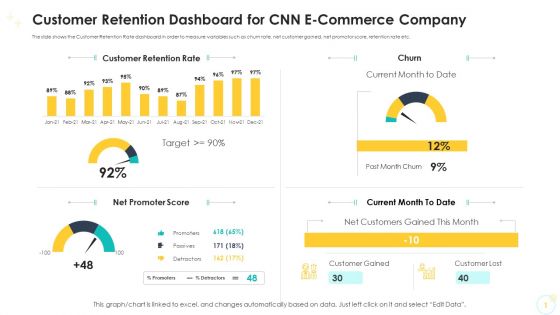
Customer Retention Dashboard For CNN E Commerce Company Ideas PDF
The slide shows the Customer Retention Rate dashboard in order to measure variables such as churn rate, net customer gained, net promotor score, retention rate etc. Deliver and pitch your topic in the best possible manner with this customer retention dashboard for CNN e commerce company ideas pdf. Use them to share invaluable insights on net promoter score, current month to date, current month to date, customer retention rate and impress your audience. This template can be altered and modified as per your expectations. So, grab it now.

Customer Retention Dashboard For CNN E Commerce Company Brochure PDF
The slide shows the Customer Retention Rate dashboard in order to measure variables such as churn rate, net customer gained, net promotor score, retention rate etc. Deliver and pitch your topic in the best possible manner with this customer retention dashboard for CNN e commerce company brochure pdf. Use them to share invaluable insights on net promoter score, current month to date, current month to date, customer retention rate and impress your audience. This template can be altered and modified as per your expectations. So, grab it now.

Sales Measurement Dashboard For ABC Carbonated Drink Company Template PDF
The slide shows the sales measurement dashboard for measuring sales effectiveness, Inventory Turnover rate, Average Time to Sell in days, Freshness duration of Products sold etc. Deliver an awe-inspiring pitch with this creative sales measurement dashboard for abc carbonated drink company template pdf. bundle. Topics like out of stock rate, inventory turnover, inventory turnover, average time to sell, average time to sell can be discussed with this completely editable template. It is available for immediate download depending on the needs and requirements of the user.
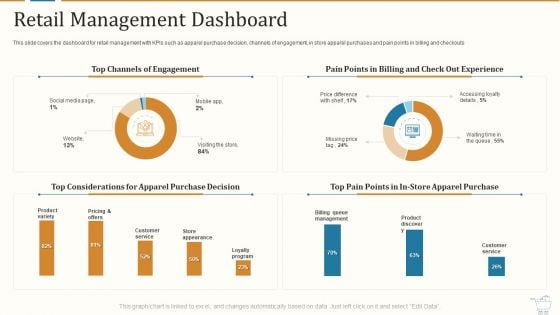
Marketing Strategies For Retail Store Retail Management Dashboard Inspiration PDF
This slide covers the dashboard for retail management with KPIs such as apparel purchase decision, channels of engagement, in store apparel purchases and pain points in billing and checkouts Deliver an awe inspiring pitch with this creative marketing strategies for retail store retail management dashboard inspiration pdf. bundle. Topics like top channels of engagement, pain points in billing and check out experience, top considerations for apparel purchase decision can be discussed with this completely editable template. It is available for immediate download depending on the needs and requirements of the user.
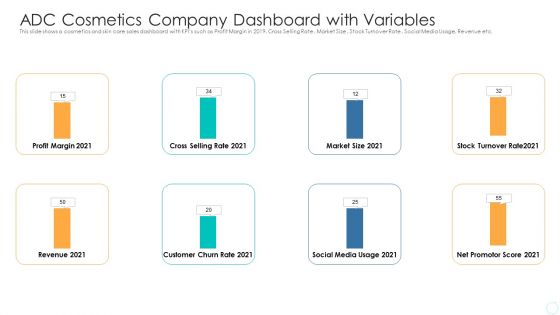
ADC Cosmetics Company Dashboard With Variables Formats PDF
This slide shows a cosmetics and skin care sales dashboard with KPIs such as Profit Margin in 2021, Cross Selling Rate , Market Size, Stock Turnover Rate , Social Media Usage, Revenue etc. Deliver an awe-inspiring pitch with this creative adc cosmetics company dashboard with variables formats pdf bundle. Topics like profit margin, cross selling rate, market size, revenue, social media can be discussed with this completely editable template. It is available for immediate download depending on the needs and requirements of the user.
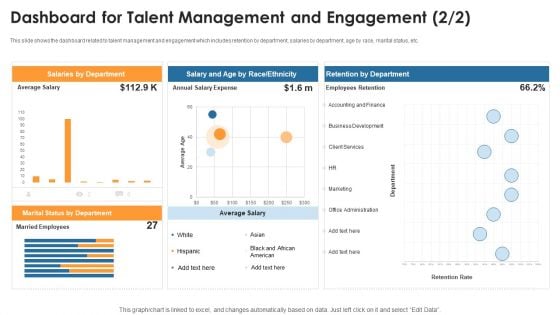
Dashboard For Talent Management And Engagement Retention Microsoft PDF
This slide shows the dashboard related to talent management and engagement which includes retention by department, salaries by department, age by race, marital status, etc.Deliver and pitch your topic in the best possible manner with this dashboard for talent management and engagement retention microsoft pdf. Use them to share invaluable insights on salaries by department, salary and age by race or ethnicity, retention by department and impress your audience. This template can be altered and modified as per your expectations. So, grab it now.
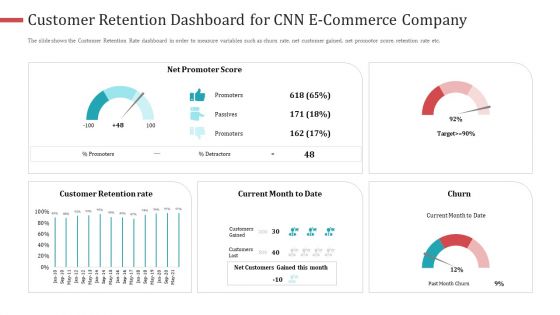
Customer Retention Dashboard For CNN E Commerce Company Sample PDF
The slide shows the Customer Retention Rate dashboard in order to measure variables such as churn rate, net customer gained, net promotor score, retention rate etc. Deliver and pitch your topic in the best possible manner with this customer retention dashboard for CNN e commerce company sample pdf. Use them to share invaluable insights on customer retention rate, net customers gained this month, net promoter score and impress your audience. This template can be altered and modified as per your expectations. So, grab it now.
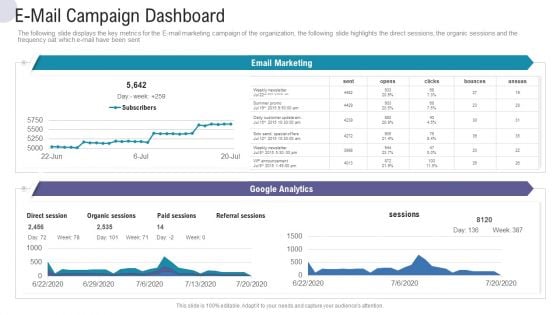
E-Mail Campaign Dashboard Commercial Activities Marketing Tools Mockup PDF
The following slide displays the key metrics for the E mail marketing campaign of the organization, the following slide highlights the direct sessions, the organic sessions and the frequency oat which e mail have been sent. Deliver and pitch your topic in the best possible manner with this e mail campaign dashboard commercial activities marketing tools mockup pdf. Use them to share invaluable insights on e mail campaign dashboard and impress your audience. This template can be altered and modified as per your expectations. So, grab it now.
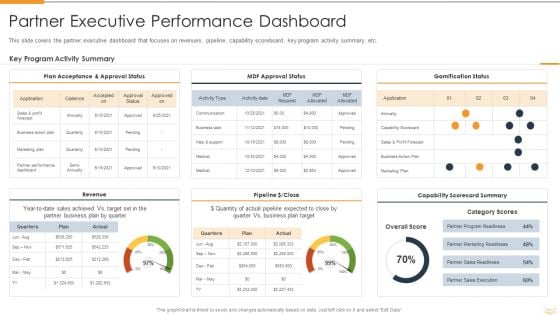
Strategic Partnership Management Plan Partner Executive Performance Dashboard Guidelines PDF
This slide covers the partner executive dashboard that focuses on revenues, pipeline, capability scoreboard, key program activity summary, etc. Deliver and pitch your topic in the best possible manner with this strategic partnership management plan partner executive performance dashboard guidelines pdf. Use them to share invaluable insights on plan acceptance and approval status, revenue, mdf approval status, gamification status, pipeline or close, capability scorecard summary and impress your audience. This template can be altered and modified as per your expectations. So, grab it now.
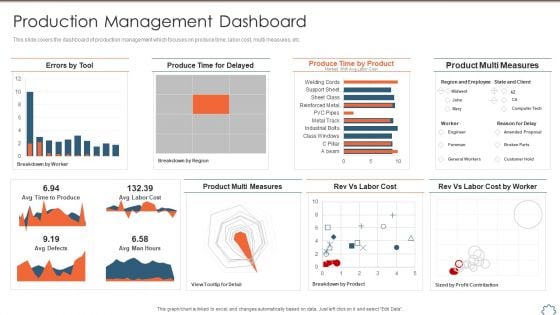
Total Productive Management At Workplace Production Management Dashboard Formats PDF
This slide covers the dashboard of production management which focuses on produce time, labor cost, multi measures, etc. Deliver and pitch your topic in the best possible manner with this total productive management at workplace production management dashboard formats pdf. Use them to share invaluable insights on product multi measures, produce time by product, product multi measures, produce time for delayed, rev vs labor cost and impress your audience. This template can be altered and modified as per your expectations. So, grab it now.
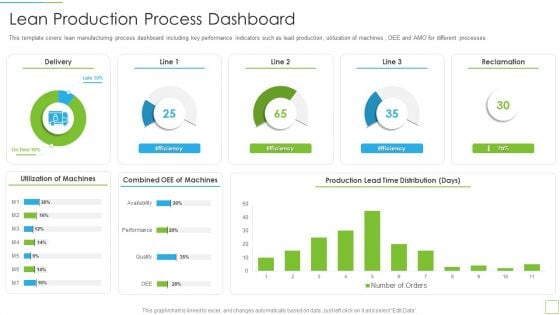
Hoshin Kanri Pitch Deck Lean Production Process Dashboard Guidelines PDF
This template covers lean manufacturing process dashboard including key performance indicators such as lead production, utilization of machines , OEE and AMO for different processes Deliver and pitch your topic in the best possible manner with this hoshin kanri pitch deck lean production process dashboard guidelines pdf Use them to share invaluable insights on utilization of machines, combined oee of machines, production lead time distribution and impress your audience. This template can be altered and modified as per your expectations. So, grab it now.
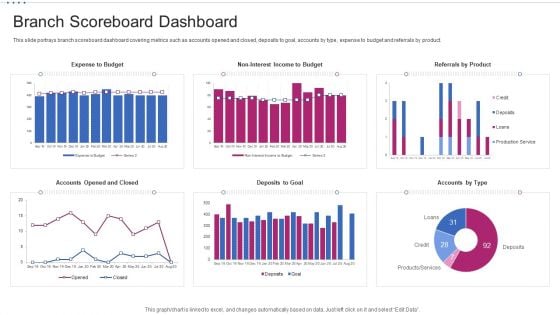
M Banking System Improving Consumer Branch Scoreboard Dashboard Demonstration PDF
This slide portrays branch scoreboard dashboard covering metrics such as accounts opened and closed, deposits to goal, accounts by type, expense to budget and referrals by product. Deliver an awe inspiring pitch with this creative m banking system improving consumer branch scoreboard dashboard demonstration pdf bundle. Topics like expense to budget, no interest income to budget, referrals by product, deposits to goal, accounts opened and closed can be discussed with this completely editable template. It is available for immediate download depending on the needs and requirements of the user.
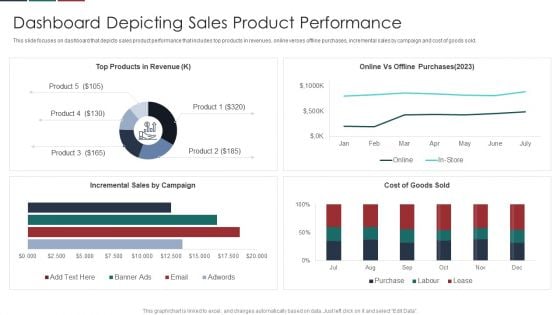
Deliver Efficiency Innovation Dashboard Depicting Sales Product Performance Themes PDF
This slide focuses on dashboard that depicts sales product performance that includes top products in revenues, online verses offline purchases, incremental sales by campaign and cost of goods sold. Deliver an awe inspiring pitch with this creative Deliver Efficiency Innovation Dashboard Depicting Sales Product Performance Themes PDF bundle. Topics like Top Products Revenue, Online Vs Offline Purchases, Incremental Sales Campaign, Cost Goods Sold can be discussed with this completely editable template. It is available for immediate download depending on the needs and requirements of the user.
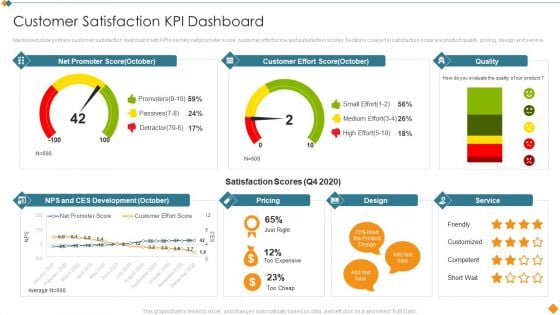
Maintaining Partner Relationships Customer Satisfaction KPI Dashboard Inspiration PDF
Mentioned slide portrays customer satisfaction dashboard with KPIs namely net promoter score, customer effort score and satisfaction scores. Sections covered in satisfaction score are product quality, pricing, design and service. Deliver and pitch your topic in the best possible manner with this Maintaining Partner Relationships Customer Satisfaction KPI Dashboard Inspiration PDF. Use them to share invaluable insights on Net Promoter Score, Customer Effort Score, Quality, Service, Pricing and impress your audience. This template can be altered and modified as per your expectations. So, grab it now.


 Continue with Email

 Home
Home


