data analytics
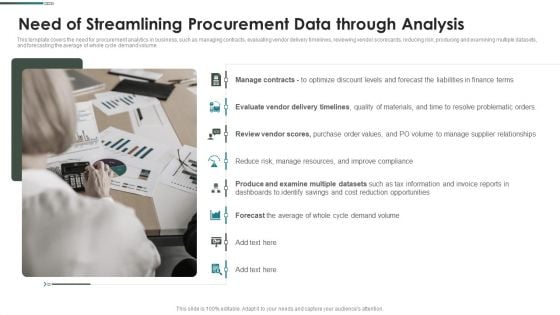
Purchase Assessment Process Need Of Streamlining Procurement Data Through Analysis Information PDF
This template covers the need for procurement analytics in business, such as managing contracts, evaluating vendor delivery timelines, reviewing vendor scorecards, reducing risk, producing and examining multiple datasets, and forecasting the average of whole cycle demand volume. This is a Purchase Assessment Process Need Of Streamlining Procurement Data Through Analysis Information PDF template with various stages. Focus and dispense information on one stage using this creative set, that comes with editable features. It contains large content boxes to add your information on topics like Manage Contracts, Evaluate Vendor, Review Vendor You can also showcase facts, figures, and other relevant content using this PPT layout. Grab it now.

Four Stages Of Strategic Framework For Data Management Strategy Ppt Outline Samples PDF
This slide showcases steps to control and organize business analytics which is increasingly driving decision-making in organizations. It includes information about identify, assess, propose and plot out. Presenting Four Stages Of Strategic Framework For Data Management Strategy Ppt Outline Samples PDF to dispense important information. This template comprises four stages. It also presents valuable insights into the topics including Management Team, Business Goals, Increase Customer. This is a completely customizable PowerPoint theme that can be put to use immediately. So, download it and address the topic impactfully.

Ways For Data Interpretation To Increase Profit In Financial Services Sample Pdf
Entire slide shows the different ways of data analysis to generate maximum of profit in financial sector which assist in gaining personalize customer services to retain the cilents. It includes boosting levers, identify new sources, etc.Pitch your topic with ease and precision using this Ways For Data Interpretation To Increase Profit In Financial Services Sample Pdf This layout presents information on Boosting Traditional, Sources Growth, Analytics Capabilities It is also available for immediate download and adjustment. So, changes can be made in the color, design, graphics or any other component to create a unique layout. Entire slide shows the different ways of data analysis to generate maximum of profit in financial sector which assist in gaining personalize customer services to retain the cilents. It includes boosting levers, identify new sources, etc.
Quantitative Data Analysis Icon For Predictive Modelling Ppt Ideas Images PDF
Presenting Quantitative Data Analysis Icon For Predictive Modelling Ppt Ideas Images PDF to dispense important information. This template comprises one stages. It also presents valuable insights into the topics including Quantitative Data, Analysis Icon, Predictive Modelling. This is a completely customizable PowerPoint theme that can be put to use immediately. So, download it and address the topic impactfully.
Data Maturity Framework Assessment Icon Ppt PowerPoint Presentation Icon Infographic Template PDF
Presenting Data Maturity Framework Assessment Icon Ppt PowerPoint Presentation Icon Infographic Template PDF to dispense important information. This template comprises one stages. It also presents valuable insights into the topics including Data Maturity Framework, Assessment Icon. This is a completely customizable PowerPoint theme that can be put to use immediately. So, download it and address the topic impactfully.
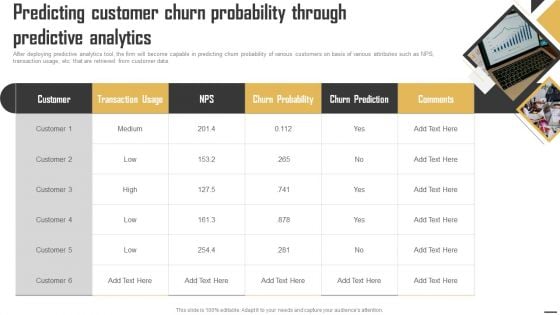
Data Monetization And Management Predicting Customer Churn Probability Through Formats PDF
After deploying predictive analytics tool, the firm will become capable in predicting churn probability of various customers on basis of various attributes such as NPS, transaction usage, etc. that are retrieved from customer data. Are you searching for a Data Monetization And Management Predicting Customer Churn Probability Through Formats PDF that is uncluttered, straightforward, and original Its easy to edit, and you can change the colors to suit your personal or business branding. For a presentation that expresses how much effort youve put in, this template is ideal With all of its features, including tables, diagrams, statistics, and lists, its perfect for a business plan presentation. Make your ideas more appealing with these professional slides. Download Data Monetization And Management Predicting Customer Churn Probability Through Formats PDF from Slidegeeks today.
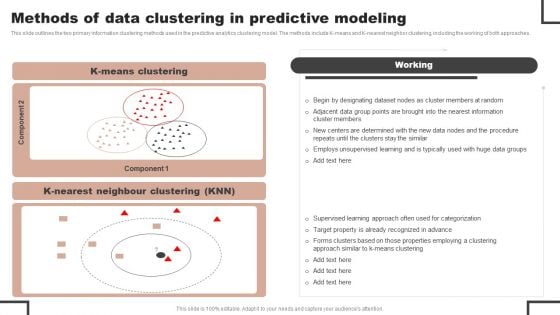
Forecast Analysis Technique IT Methods Of Data Clustering In Predictive Modeling Formats PDF
This slide outlines the two primary information clustering methods used in the predictive analytics clustering model. The methods include K means and K nearest neighbor clustering, including the working of both approaches. Create an editable Forecast Analysis Technique IT Methods Of Data Clustering In Predictive Modeling Formats PDF that communicates your idea and engages your audience. Whether you are presenting a business or an educational presentation, pre designed presentation templates help save time. Forecast Analysis Technique IT Methods Of Data Clustering In Predictive Modeling Formats PDF is highly customizable and very easy to edit, covering many different styles from creative to business presentations. Slidegeeks has creative team members who have crafted amazing templates. So, go and get them without any delay.
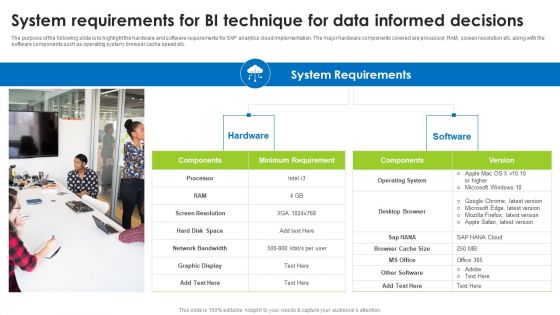
System Requirements For BI Technique For Data Informed Decisions Graphics PDF
The purpose of the following slide is to highlight the hardware and software requirements for SAP analytics cloud implementation. The major hardware components covered are processor, RAM, screen resolution etc. along with the software components such as operating system, browser cache speed etc. Find highly impressive System Requirements For BI Technique For Data Informed Decisions Graphics PDF on Slidegeeks to deliver a meaningful presentation. You can save an ample amount of time using these presentation templates. No need to worry to prepare everything from scratch because Slidegeeks experts have already done a huge research and work for you. You need to download System Requirements For BI Technique For Data Informed Decisions Graphics PDF for your upcoming presentation. All the presentation templates are 100 percent editable and you can change the color and personalize the content accordingly. Download now.
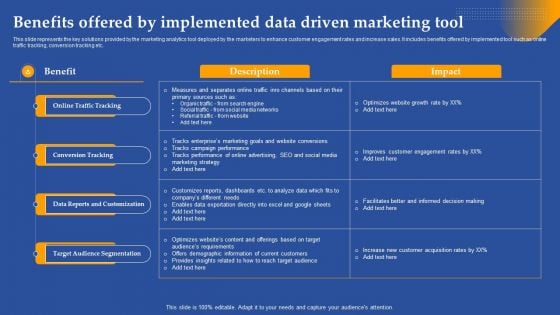
Benefits Offered By Implemented Data Driven Marketing Tool Ppt Inspiration Slides PDF
This slide represents the key solutions provided by the marketing analytics tool deployed by the marketers to enhance customer engagement rates and increase sales. It includes benefits offered by implemented tool such as online traffic tracking, conversion tracking etc. If you are looking for a format to display your unique thoughts, then the professionally designed Benefits Offered By Implemented Data Driven Marketing Tool Ppt Inspiration Slides PDF is the one for you. You can use it as a Google Slides template or a PowerPoint template. Incorporate impressive visuals, symbols, images, and other charts. Modify or reorganize the text boxes as you desire. Experiment with shade schemes and font pairings. Alter, share or cooperate with other people on your work. Download Benefits Offered By Implemented Data Driven Marketing Tool Ppt Inspiration Slides PDF and find out how to give a successful presentation. Present a perfect display to your team and make your presentation unforgettable.
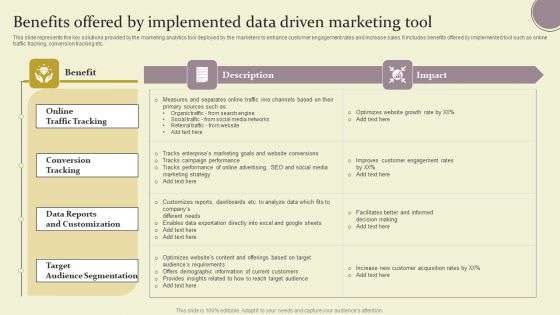
Benefits Offered By Implemented Data Driven Marketing Tool Ppt Ideas Slides PDF
This slide represents the key solutions provided by the marketing analytics tool deployed by the marketers to enhance customer engagement rates and increase sales. It includes benefits offered by implemented tool such as online traffic tracking, conversion tracking etc. If you are looking for a format to display your unique thoughts, then the professionally designed Benefits Offered By Implemented Data Driven Marketing Tool Ppt Ideas Slides PDF is the one for you. You can use it as a Google Slides template or a PowerPoint template. Incorporate impressive visuals, symbols, images, and other charts. Modify or reorganize the text boxes as you desire. Experiment with shade schemes and font pairings. Alter, share or cooperate with other people on your work. Download Benefits Offered By Implemented Data Driven Marketing Tool Ppt Ideas Slides PDF and find out how to give a successful presentation. Present a perfect display to your team and make your presentation unforgettable.
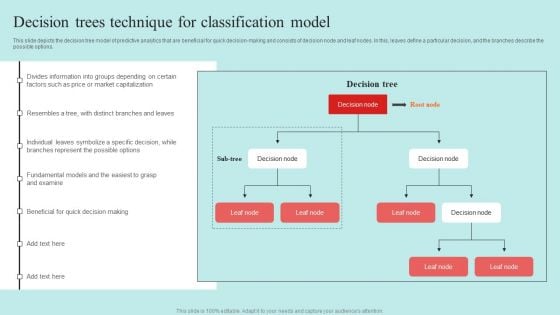
Predictive Data Model Decision Trees Technique For Classification Model Topics PDF
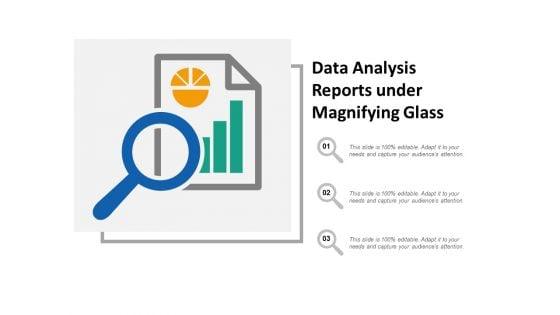
Data Analysis Reports Under Magnifying Glass Ppt Powerpoint Presentation Summary Slideshow
This is a data analysis reports under magnifying glass ppt powerpoint presentation summary slideshow. This is a three stage process. The stages in this process are data visualization icon, data management icon.
Targeted Marketing Campaigns To Improve Buyers Experience Tools To Gather Data From Social Media Platforms Icons PDF
This slide showcases social media tools that can be used to gather data about consumers to formulate personalized marketing campaigns. Twitter analytics, facebook audience insight and instagram insights are the internal tools that can be used. If your project calls for a presentation, then Slidegeeks is your go to partner because we have professionally designed, easy to edit templates that are perfect for any presentation. After downloading, you can easily edit Targeted Marketing Campaigns To Improve Buyers Experience Tools To Gather Data From Social Media Platforms Icons PDF and make the changes accordingly. You can rearrange slides or fill them with different images. Check out all the handy templates
Business Analysis Data Monitoring Vector Icon Ppt Powerpoint Presentation Ideas Design Ideas
This is a business analysis data monitoring vector icon ppt powerpoint presentation ideas design ideas. This is a one stage process. The stages in this process are feedback loop icon, evaluation icon, assessment icon.
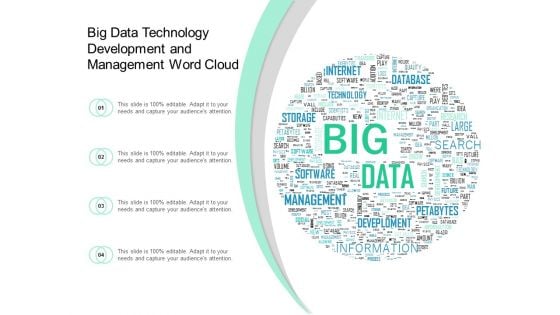
Big Data Technology Development And Management Word Cloud Ppt PowerPoint Presentation File Background Image
Presenting this set of slides with name big data technology development and management word cloud ppt powerpoint presentation file background image. This is a four stage process. The stages in this process are word cloud, term cloud, phrase cloud. This is a completely editable PowerPoint presentation and is available for immediate download. Download now and impress your audience.
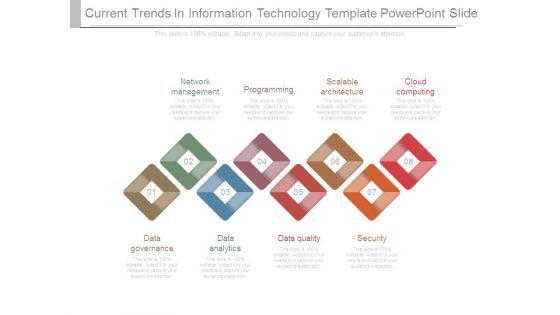
Current Trends In Information Technology Template Powerpoint Slide
This is a current trends in information technology template powerpoint slide. This is a eight stage process. The stages in this process are network management, programming, scalable architecture, cloud computing, data governance, data analytics, data quality, security.
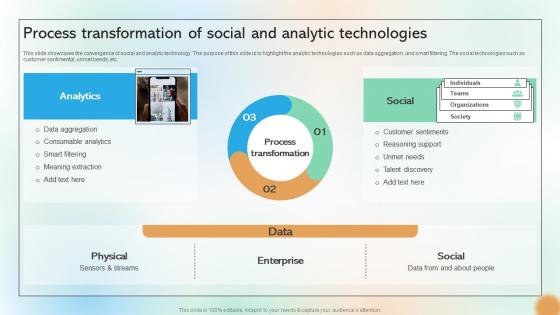
Process Transformation Of Social And Analytic Technologies Cracking The Code Of Social Media
This slide showcases the convergence of social and analytic technology. The purpose of this slide is to highlight the analytic technologies such as data aggregation, and smart filtering. The social technologies such as customer sentimental, unmet needs, etc. Present like a pro with Process Transformation Of Social And Analytic Technologies Cracking The Code Of Social Media. Create beautiful presentations together with your team, using our easy-to-use presentation slides. Share your ideas in real-time and make changes on the fly by downloading our templates. So whether you are in the office, on the go, or in a remote location, you can stay in sync with your team and present your ideas with This slide showcases the convergence of social and analytic technology. The purpose of this slide is to highlight the analytic technologies such as data aggregation, and smart filtering. The social technologies such as customer sentimental, unmet needs, etc.
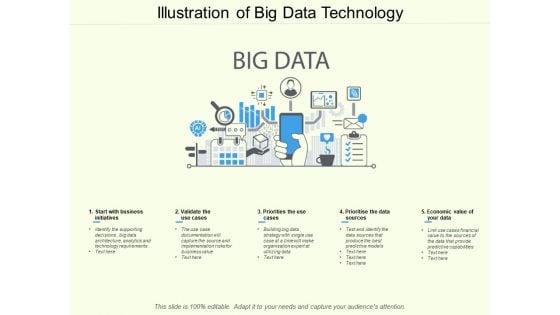
Illustration Of Big Data Technology Ppt PowerPoint Presentation Pictures Slide Download
Presenting this set of slides with name illustration of big data technology ppt powerpoint presentation pictures slide download. This is a five stage process. The stages in this process are big data strategy, data governance strategy, big data technology. This is a completely editable PowerPoint presentation and is available for immediate download. Download now and impress your audience.
Data Identification And Information Analysis Vector Icon Ppt PowerPoint Presentation Gallery Example PDF
Presenting data identification and information analysis vector icon ppt powerpoint presentation gallery example pdf to dispense important information. This template comprises three stages. It also presents valuable insights into the topics including data identification and information analysis vector icon. This is a completely customizable PowerPoint theme that can be put to use immediately. So, download it and address the topic impactfully.
Projected Growth Data Analysis Vector Icon Ppt PowerPoint Presentation Layouts Portfolio PDF
Presenting projected growth data analysis vector icon ppt powerpoint presentation layouts portfolio pdf to dispense important information. This template comprises one stages. It also presents valuable insights into the topics including projected growth data analysis vector icon. This is a completely customizable PowerPoint theme that can be put to use immediately. So, download it and address the topic impactfully.
Data Research And Analysis Vector Icon Ppt PowerPoint Presentation Icon Background Image PDF
Presenting data research and analysis vector icon ppt powerpoint presentation icon background image pdf to dispense important information. This template comprises three stages. It also presents valuable insights into the topics including data research and analysis vector icon. This is a completely customizable PowerPoint theme that can be put to use immediately. So, download it and address the topic impactfully.
Vector Showing Data Quality Analysis Method Icon Ppt PowerPoint Presentation Icon Show PDF
Presenting vector showing data quality analysis method icon ppt powerpoint presentation icon show pdf to dispense important information. This template comprises three stages. It also presents valuable insights into the topics including vector showing data quality analysis method icon. This is a completely customizable PowerPoint theme that can be put to use immediately. So, download it and address the topic impactfully.
Data Analysis Bar Chart With Magnifying Glass Icon Ppt PowerPoint Presentation Icon Layouts PDF
Presenting this set of slides with name data analysis bar chart with magnifying glass icon ppt powerpoint presentation icon layouts pdf. This is a three stage process. The stages in this process are data analysis bar chart with magnifying glass icon. This is a completely editable PowerPoint presentation and is available for immediate download. Download now and impress your audience.
Data Analysis With Bar Chart In Magnifying Glass Vector Icon Ppt PowerPoint Presentation File Model PDF
Presenting this set of slides with name data analysis with bar chart in magnifying glass vector icon ppt powerpoint presentation file model pdf. This is a one stage process. The stages in this process is data analysis with bar chart in magnifying glass vector icon. This is a completely editable PowerPoint presentation and is available for immediate download. Download now and impress your audience.
Magnifying Glass And Data Assessment Vector Icon Ppt PowerPoint Presentation Styles Themes PDF
Presenting magnifying glass and data assessment vector icon ppt powerpoint presentation styles themes pdf to dispense important information. This template comprises three stages. It also presents valuable insights into the topics including magnifying glass and data assessment vector icon. This is a completely customizable PowerPoint theme that can be put to use immediately. So, download it and address the topic impactfully.
Meta Data Inventory Management Vector Icon Ppt PowerPoint Presentation Layouts Designs Download PDF
Presenting meta data inventory management vector icon ppt powerpoint presentation layouts designs download pdf to dispense important information. This template comprises three stages. It also presents valuable insights into the topics including meta data inventory management vector icon. This is a completely customizable PowerPoint theme that can be put to use immediately. So, download it and address the topic impactfully.
IT Management Plan With Data Governance Icon Ppt Styles Design Templates PDF
Presenting it management plan with data governance icon ppt styles design templates pdf to dispense important information. This template comprises three stages. It also presents valuable insights into the topics including it management plan with data governance icon. This is a completely customizable PowerPoint theme that can be put to use immediately. So, download it and address the topic impactfully.
Graphical Representation Of Data Vector Icon Ppt PowerPoint Presentation File Design Templates PDF
Presenting this set of slides with name graphical representation of data vector icon ppt powerpoint presentation file design templates pdf. This is a three stage process. The stages in this process are graphical representation of data vector icon. This is a completely editable PowerPoint presentation and is available for immediate download. Download now and impress your audience.
Data Management Vector Icon Ppt PowerPoint Presentation File Visual Aids PDF
Presenting this set of slides with name data management vector icon ppt powerpoint presentation file visual aids pdf. This is a three stage process. The stages in this process are data management vector icon. This is a completely editable PowerPoint presentation and is available for immediate download. Download now and impress your audience.
Audit Officer Icon For Performing Data Quality Investigation Ppt PowerPoint Presentation File Templates PDF
Presenting this set of slides with name audit officer icon for performing data quality investigation ppt powerpoint presentation file templates pdf. This is a three stage process. The stages in this process are audit officer icon for performing data quality investigation. This is a completely editable PowerPoint presentation and is available for immediate download. Download now and impress your audience.
Magnifying Glass With Data Analysis Vector Icon Ppt PowerPoint Presentation Model Graphics Design PDF
Persuade your audience using this magnifying glass with data analysis vector icon ppt powerpoint presentation model graphics design pdf. This PPT design covers three stages, thus making it a great tool to use. It also caters to a variety of topics including magnifying glass with data analysis vector icon. Download this PPT design now to present a convincing pitch that not only emphasizes the topic but also showcases your presentation skills.
Electronic Data Management For R And D Vector Icon Ppt PowerPoint Presentation File Inspiration PDF
Persuade your audience using this electronic data management for r and d vector icon ppt powerpoint presentation file inspiration pdf. This PPT design covers three stages, thus making it a great tool to use. It also caters to a variety of topics including electronic data management for r and d vector icon. Download this PPT design now to present a convincing pitch that not only emphasizes the topic but also showcases your presentation skills.
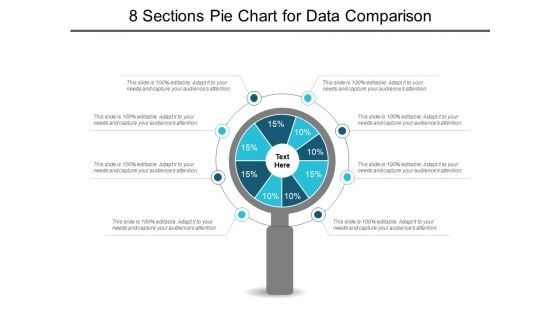
8 Sections Pie Chart For Data Comparison Ppt PowerPoint Presentation Show Slideshow
This is a 8 sections pie chart for data comparison ppt powerpoint presentation show slideshow. This is a eight stage process. The stages in this process are 6 piece pie chart, 6 segment pie chart, 6 parts pie chart.
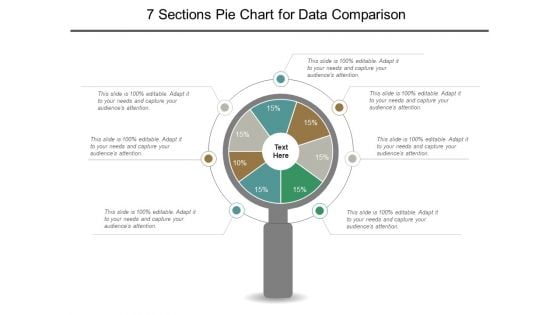
7 Sections Pie Chart For Data Comparison Ppt PowerPoint Presentation File Graphics Template
This is a 7 sections pie chart for data comparison ppt powerpoint presentation file graphics template. This is a seven stage process. The stages in this process are 6 piece pie chart, 6 segment pie chart, 6 parts pie chart.
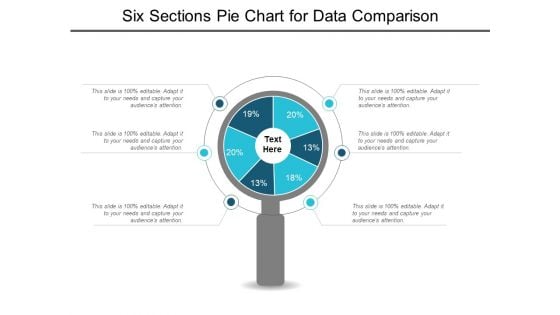
Six Sections Pie Chart For Data Comparison Ppt PowerPoint Presentation Styles Graphics Example
This is a six sections pie chart for data comparison ppt powerpoint presentation styles graphics example. This is a six stage process. The stages in this process are 6 piece pie chart, 6 segment pie chart, 6 parts pie chart.
Data Governance Plan With Server Management Vector Icon Ppt PowerPoint Presentation File Information PDF
Persuade your audience using this data governance plan with server management vector icon ppt powerpoint presentation file information pdf. This PPT design covers three stages, thus making it a great tool to use. It also caters to a variety of topics including data governance plan with server management vector icon. Download this PPT design now to present a convincing pitch that not only emphasizes the topic but also showcases your presentation skills.
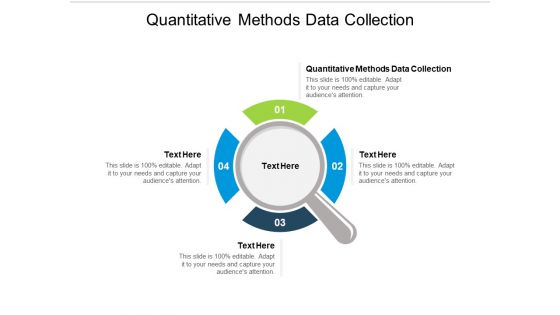
Quantitative Methods Data Collection Ppt PowerPoint Presentation Infographic Template Infographic Template Cpb
Presenting this set of slides with name quantitative methods data collection ppt powerpoint presentation infographic template infographic template cpb. This is an editable Powerpoint four stages graphic that deals with topics like quantitative methods data collection to help convey your message better graphically. This product is a premium product available for immediate download and is 100 percent editable in Powerpoint. Download this now and use it in your presentations to impress your audience.
Data Quality Evaluation Vector Icon Ppt PowerPoint Presentation File Example PDF
Persuade your audience using this data quality evaluation vector icon ppt powerpoint presentation file example pdf. This PPT design covers three stages, thus making it a great tool to use. It also caters to a variety of topics including data quality evaluation vector icon. Download this PPT design now to present a convincing pitch that not only emphasizes the topic but also showcases your presentation skills.
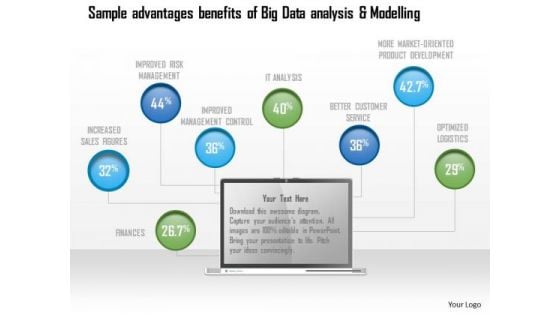
Business Diagram Sample Advantages Benefits Of Big Data Analysis And Modelling Ppt Slide
Explain the concept of sample advantages and benefits of big data analysis with this unique diagram. This slide contains the graphic of data icons. Use this slide to present data analysis and modeling related topics in any presentation.
Magnifying Glass Big Data Analysis Ppt PowerPoint Presentation Layouts Designs Download
Presenting this set of slides with name magnifying glass big data analysis ppt powerpoint presentation layouts designs download. This is a four stage process. The stages in this process are magnifying glass, research, marketing, strategy, business. This is a completely editable PowerPoint presentation and is available for immediate download. Download now and impress your audience.

Financial Data Analysis For Risk Management Ppt PowerPoint Presentation Slides Picture
Presenting this set of slides with name financial data analysis for risk management ppt powerpoint presentation slides picture. This is a one stage process. The stages in this process are risk framework, risk management, planning process. This is a completely editable PowerPoint presentation and is available for immediate download. Download now and impress your audience.
Introducing And Implementing Data Migration Approaches Within The Business Magnifying Glass Ppt File Rules PDF
Presenting this set of slides with name introducing and implementing data migration approaches within the business magnifying glass ppt file rules pdf. This is a one stage process. The stage in this process is magnifying glass. This is a completely editable PowerPoint presentation and is available for immediate download. Download now and impress your audience.
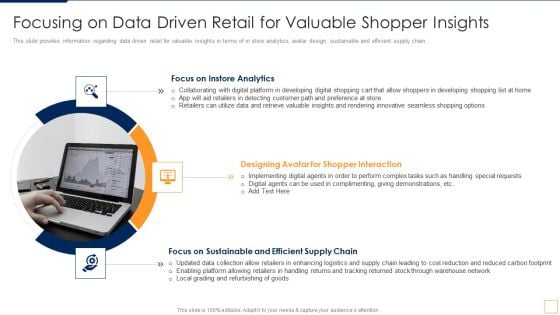
Advancement Of Retail Store In Future Focusing On Data Driven Retail For Valuable Shopper Insights Template PDF
This slide provides information regarding data driven retail for valuable insights in terms of in store analytics, avatar design, sustainable and efficient supply chain. Presenting advancement of retail store in future focusing on data driven retail for valuable shopper insights template pdf to provide visual cues and insights. Share and navigate important information on three stages that need your due attention. This template can be used to pitch topics like focus on instore analytics, designing avatar for shopper interaction, focus on sustainable and efficient supply chain. In addtion, this PPT design contains high resolution images, graphics, etc, that are easily editable and available for immediate download.
Pie Chart For Data Presentation Vector Ppt PowerPoint Presentation Summary Files
Presenting this set of slides with name pie chart for data presentation vector ppt powerpoint presentation summary files. The topics discussed in these slides are data visualization icon, research analysis, business focus. This is a completely editable PowerPoint presentation and is available for immediate download. Download now and impress your audience.
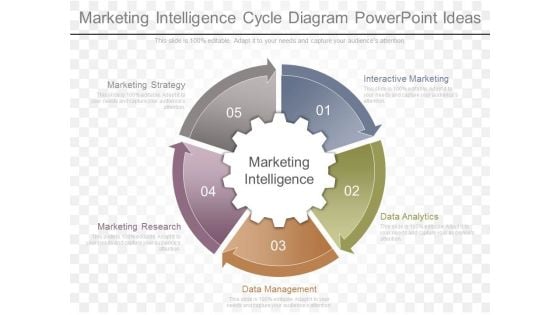
Marketing Intelligence Cycle Diagram Powerpoint Ideas
This is a marketing intelligence cycle diagram powerpoint ideas. This is a five stage process. The stages in this process are marketing strategy, marketing research, interactive marketing, data analytics, data management.
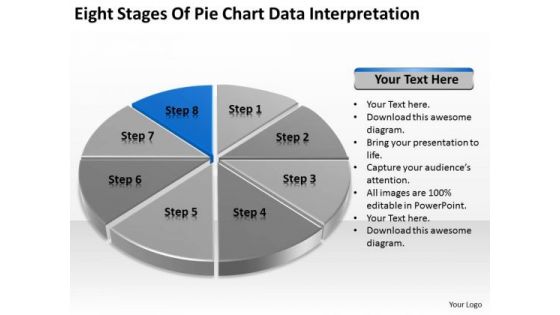
Eight Stages Of Pie Chart Data Interpretation Detailed Business Plan PowerPoint Templates
We present our eight stages of pie chart data interpretation detailed business plan PowerPoint templates.Download and present our Competition PowerPoint Templates because You can Stir your ideas in the cauldron of our PowerPoint Templates and Slides. Cast a magic spell on your audience. Download and present our Marketing PowerPoint Templates because You should Kick up a storm with our PowerPoint Templates and Slides. The heads of your listeners will swirl with your ideas. Download and present our Arrows PowerPoint Templates because Your ideas provide food for thought. Our PowerPoint Templates and Slides will help you create a dish to tickle the most discerning palate. Present our Circle Charts PowerPoint Templates because You can Stir your ideas in the cauldron of our PowerPoint Templates and Slides. Cast a magic spell on your audience. Download our Business PowerPoint Templates because You can Score a slam dunk with our PowerPoint Templates and Slides. Watch your audience hang onto your every word.Use these PowerPoint slides for presentations relating to chart, graph, pie, 3d, diagram, graphic, icon, control, business, data, profit, market, sales, display, corporate, concept, render, success, presentation, finance, report, marketing, accounting, management, piece, strategy, money, growth, company, competition, progress, account, sheet, part, information, investment, improvement, banking, index, financial, reflect, results, performance, exchange. The prominent colors used in the PowerPoint template are Blue, Black, Gray. Exult in the comfort of our Eight Stages Of Pie Chart Data Interpretation Detailed Business Plan PowerPoint Templates. Experience the convenience they deliver.
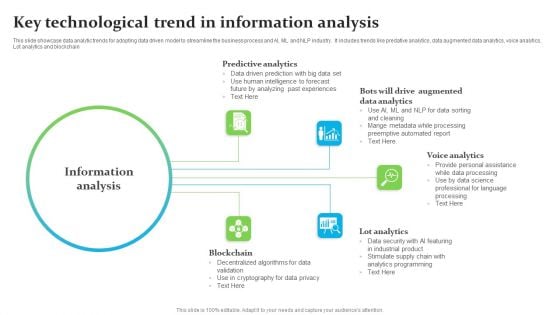
Key Technological Trend In Information Analysis Ppt Ideas Layout PDF
This slide showcase data analytic trends for adopting data driven model to streamline the business process and AI, ML and NLP industry. It includes trends like predative analytics, data augmented data analytics, voice analytics, Lot analytics and blockchain. Presenting Key Technological Trend In Information Analysis Ppt Ideas Layout PDF to dispense important information. This template comprises five stages. It also presents valuable insights into the topics including Predictive Analytics, Voice Analytics, Lot Analytics, Blockchain. This is a completely customizable PowerPoint theme that can be put to use immediately. So, download it and address the topic impactfully.
Data Processing Mainframe Structure Vector Icon Ppt PowerPoint Presentation Model Files PDF
Pitch your topic with ease and precision using this data processing mainframe structure vector icon ppt powerpoint presentation model files pdf. This layout presents information on data processing mainframe structure vector icon. It is also available for immediate download and adjustment. So, changes can be made in the color, design, graphics or any other component to create a unique layout.
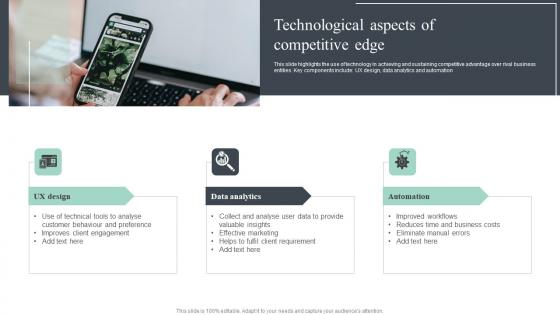
Technological Aspects Of Competitive Edge Guidelines Pdf
This slide highlights the use of technology in achieving and sustaining competitive advantage over rival business entities. Key components include UX design, data analytics and automation Showcasing this set of slides titled Technological Aspects Of Competitive Edge Guidelines Pdf. The topics addressed in these templates are UX Design, Data Analytics, Automation. All the content presented in this PPT design is completely editable. Download it and make adjustments in color, background, font etc. as per your unique business setting. This slide highlights the use of technology in achieving and sustaining competitive advantage over rival business entities. Key components include UX design, data analytics and automation
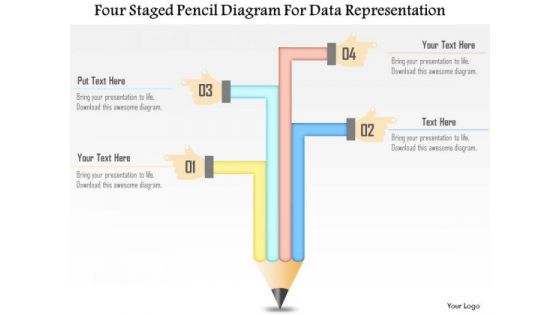
Business Diagram Four Staged Pencil Diagram For Data Representation Presentation Template
This business diagram has been designed with four staged pencil chart. This slide suitable for data representation. You can also use this slide to present four steps of any business process. Use this diagram to present your views in a wonderful manner.
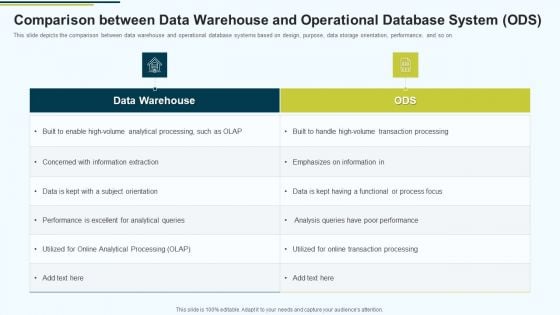
MIS Comparison Between Data Warehouse And Operational Database System ODS Ppt PowerPoint Presentation Show Images PDF
This slide depicts the comparison between data warehouse and operational database systems based on design, purpose, data storage orientation, performance, and so on.Deliver an awe inspiring pitch with this creative MIS Comparison Between Data Warehouse And Operational Database System ODS Ppt PowerPoint Presentation Show Images PDF bundle. Topics like Concerned With Information, Performance Is Excellent, Analytical Processing can be discussed with this completely editable template. It is available for immediate download depending on the needs and requirements of the user.
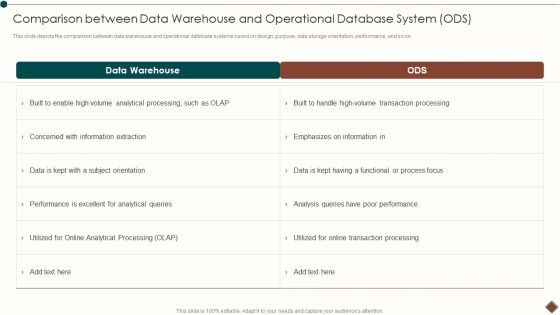
Comparison Between Data Warehouse And Operational Database System ODS Infographics PDF
This slide depicts the comparison between data warehouse and operational database systems based on design, purpose, data storage orientation, performance, and so on.Deliver and pitch your topic in the best possible manner with this Comparison Between Data Warehouse And Operational Database System ODS Infographics PDF. Use them to share invaluable insights on Concerned Information, Analytical Processing, Poor Performance and impress your audience. This template can be altered and modified as per your expectations. So, grab it now.
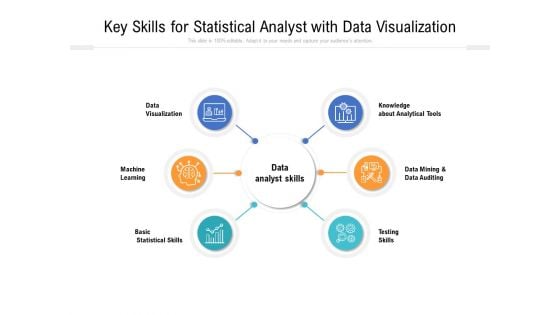
Key Skills For Statistical Analyst With Data Visualization Ppt PowerPoint Presentation Gallery Elements PDF
Presenting key skills for statistical analyst with data visualization ppt powerpoint presentation gallery elements pdf. to dispense important information. This template comprises six stages. It also presents valuable insights into the topics including machine, learning, statistical skills analyst, testing skills, analytical tools, knowledge. This is a completely customizable PowerPoint theme that can be put to use immediately. So, download it and address the topic impactfully.
File Transfer Data Management Vector Icon Ppt PowerPoint Presentation File Graphic Images
Presenting this set of slides with name file transfer data management vector icon ppt powerpoint presentation file graphic images. The topics discussed in these slides are data sources, database management, marketing. This is a completely editable PowerPoint presentation and is available for immediate download. Download now and impress your audience.
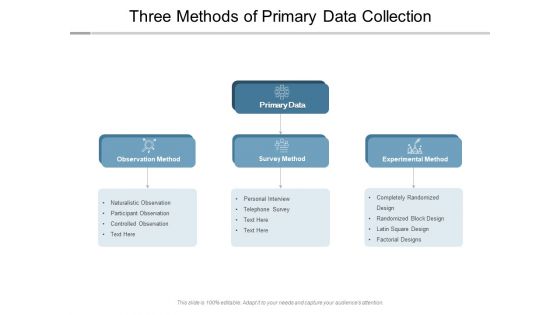
Three Methods Of Primary Data Collection Ppt PowerPoint Presentation Infographics Graphics Design
Presenting this set of slides with name three methods of primary data collection ppt powerpoint presentation infographics graphics design. The topics discussed in these slides are data sources, database management, marketing. This is a completely editable PowerPoint presentation and is available for immediate download. Download now and impress your audience.

Business Diagram 3d Pie Chart With Arrows For Data Representation PowerPoint Slide
This business slide displays pie chart with timeline graphics. This diagram has been designed with graphic of with four arrows representing yearly data. Use this diagram, in your presentations to display process steps, stages, for business management.
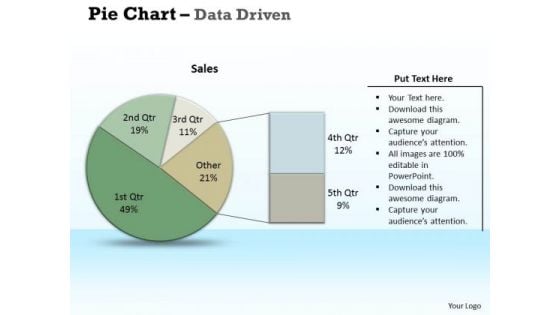
Examples Of Data Analysis Market Driven Pie Chart Research PowerPoint Slides Templates
Chalk It Up With Our examples of data analysis market driven pie chart research powerpoint slides Templates . Add To The Credits Of Your Ideas.
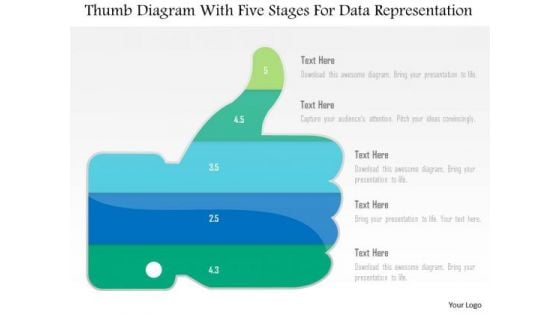
Business Diagram Thumb Diagram With Five Stages For Data Representation PowerPoint Slide
This business diagram displays thumb up with five stages. This diagram contains text boxes for data representation. Use this diagram to display business process workflows in any presentations.

Management Information System OLAP And OLTP In Data Warehousing Infographics PDF
This slide represents the OLAP and OLTP in data warehousing and how OLAP tools are used for multifaceted data analysis and OLTP is designed for transactional applications.This is a Management Information System OLAP And OLTP In Data Warehousing Infographics PDF template with various stages. Focus and dispense information on eight stages using this creative set, that comes with editable features. It contains large content boxes to add your information on topics like Analytical Processing, Multidimensional, Centralized Information. You can also showcase facts, figures, and other relevant content using this PPT layout. Grab it now.
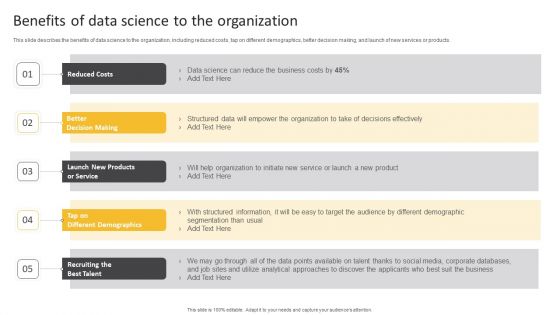
Information Science Benefits Of Data Science To The Organization Ppt PowerPoint Presentation Summary Grid PDF
This slide describes the benefits of data science to the organization, including reduced costs, tap on different demographics, better decision making, and launch of new services or products.This is a Information Science Benefits Of Data Science To The Organization Ppt PowerPoint Presentation Summary Grid PDF template with various stages. Focus and dispense information on five stages using this creative set, that comes with editable features. It contains large content boxes to add your information on topics like Different Demographics, Analytical Approaches, Corporate Databases. You can also showcase facts, figures, and other relevant content using this PPT layout. Grab it now.


 Continue with Email

 Home
Home


