evolution

3d Happy Person With Dollars PowerPoint Templates
Concept of financial growth analysis with happiness has been defined in this PowerPoint template. This diagram slide contains the graphic of 3d man standing over the currency. Use this image for business and finance related topics in any presentation.
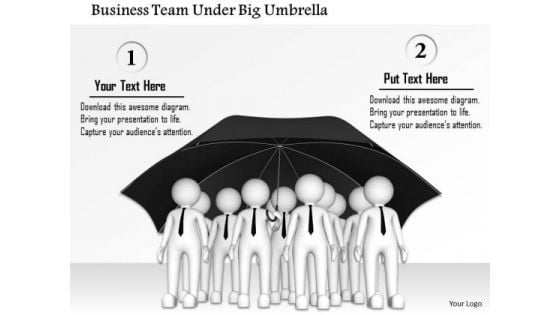
Business Team Under Big Umbrella PowerPoint Templates
Concept of team protection for growth and management has been displayed in this 3d diagram. This unique diagram contains the graphic of team under the umbrella. Use this PPT diagram for business and management related presentations.
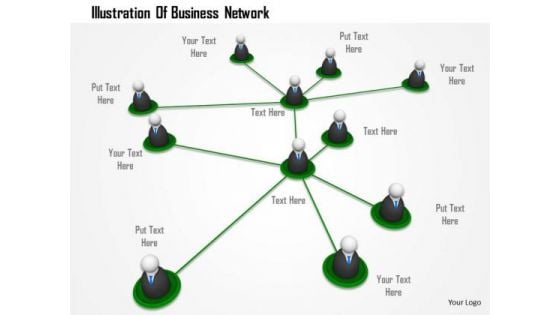
Illustration Of Business Network PowerPoint Templates
Graphic of multiple icons in network has been displayed in this 3d diagram slide This diagram contains the concept of business networking and growth. Use this editable diagram for your business presentation.

Man Under Umbrella Dollar Falling On It PowerPoint Templates
Concept of money protection and growth has been defined in this 3d diagram with suitable graphics. This unique diagram contains the graphic of 3d man and umbrella. Use this diagram slide for finance and currency related presentations.
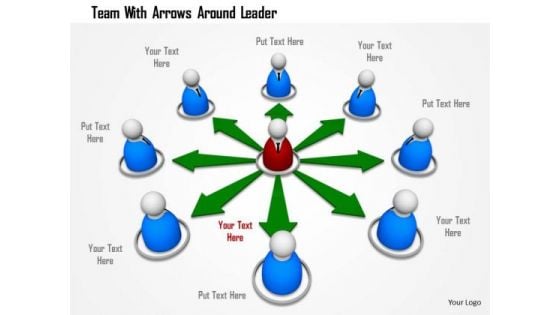
Team With Arrows Around Leader PowerPoint Templates
Concept of business growth and leadership has been defined in this 3d diagram. This diagram contains the graphic of team with arrows around leader. Download this diagram to make professional presentations

Laptop Globe Bar Graph Dollar Coins Ppt Slides Graphics
Icons of laptop, globe and bar graph with dollar coins have been used to design this icon PPT slide. Download these icons to display concepts of technology and financial growth. Use this slide to build an exclusive presentation.
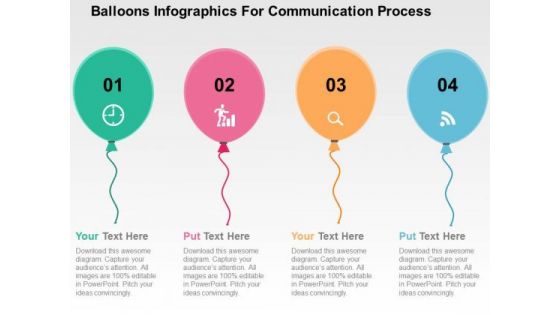
Balloons Infographics For Communication Process PowerPoint Templates
This business slide has been designed with graphics of balloons with icons. Download this diagram to portray concepts like growth, finance, marketing, and communication. This slide is innovatively designed to highlight your worthy view.

Handshake Graphic For Thank You Slide PowerPoint Templates
This PowerPoint template has been designed with handshake graphics and thank you text. Use this unique diagram to portray concepts like business deal, agreement etc. This slide may be used to explain business survival and long term growth.
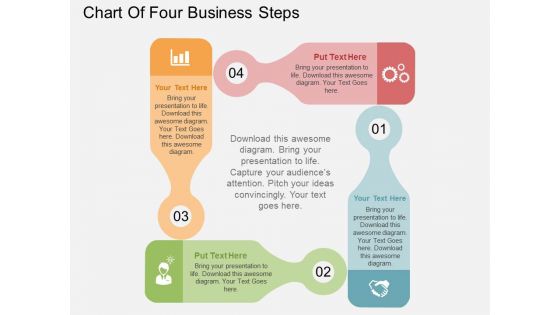
Chart Of Four Business Steps Powerpoint Templates
This business diagram displays flow of four business steps. This editable slide is suitable to present growth management. Use this diagram for business and finance related topics and display complete data analysis in your presentation.
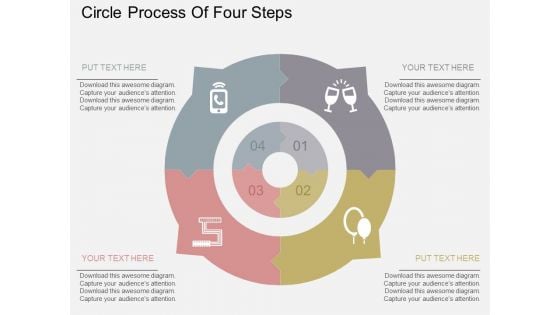
Circle Process Of Four Steps Powerpoint Templates
Our above slide contains graphics of bulb with success graph. It helps to exhibit planning for growth. Use this diagram to impart more clarity to data and to create more sound impact on viewers.
Men On Gears With Icons Powerpoint Templates
This PowerPoint slide has been designed with 3d men icons on gears. This diagram is designed to depict concepts of finance, technology and growth. This professional slide helps in making an instant impact on viewers.
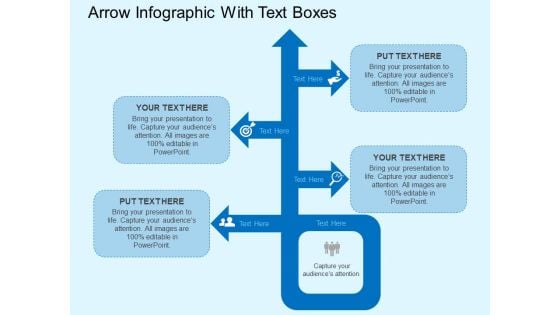
Arrow Infographic With Text Boxes Powerpoint Templates
This business slide has been designed with arrows infographic. Download this diagram to portray concepts like growth, finance, marketing, and communication. This slide is innovatively designed to highlight your worthy view.
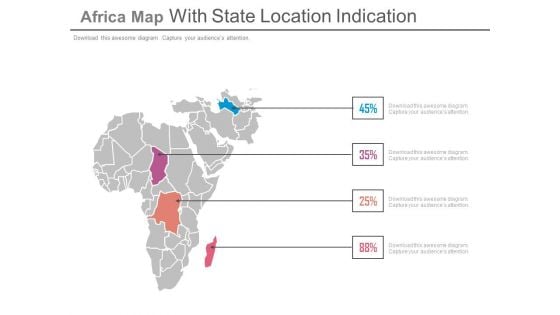
State Location On Africa Map With Percentage Data Powerpoint Slides
This PowerPoint template displays state location on Africa map with percentage data. This Map template can be used for annual growth report. This slide can also be used by school students for educational projects.
Four Staged Interconnected Circles With Icons Powerpoint Templates
Create visually stunning and define your presentations in a unique and inspiring manner using our above template. It contains diagram of circular infographic. Download this slide to display planning for business growth.
Five Mountain Chart With Icons For Financial Analysis Powerpoint Slides
Our above PPT slide contains five mountains with icons and financial values. This PowerPoint template helps to exhibit financial analysis for business growth. Use this diagram to impart more clarity to subject and to create more sound impact on viewers.
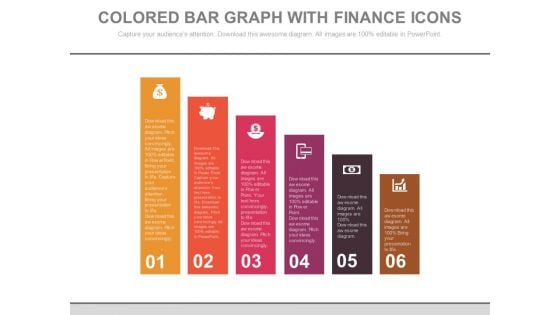
Bar Graph For Marketing Research Data Powerpoint Slides
This PowerPoint template has been designed with diagram of bar graph. This PPT slide can be used to prepare presentations for profit growth report and also for financial data analysis. You can download finance PowerPoint template to prepare awesome presentations.
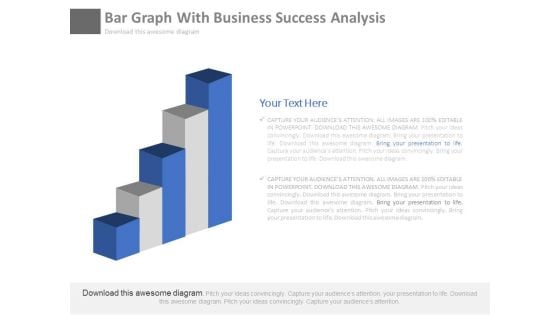
Bar Graph For Marketing Research Process Powerpoint Slides
This PowerPoint template has been designed with diagram of bar graph. This PPT slide can be used to prepare presentations for profit growth report and also for financial data analysis. You can download finance PowerPoint template to prepare awesome presentations.
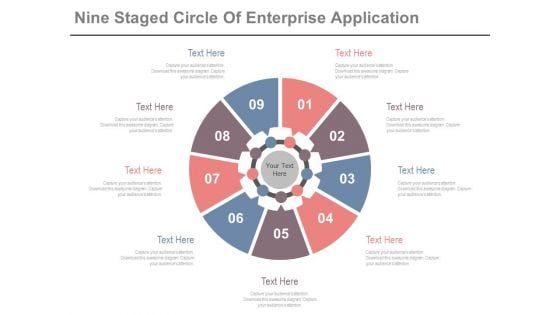
Circle Diagram For Business Marketing Mix Powerpoint Slides
This PowerPoint template has been designed with nine steps circle chart. This PPT slide can be used to prepare presentations for profit growth report and also for financial data analysis. You can download finance PowerPoint template to prepare awesome presentations.
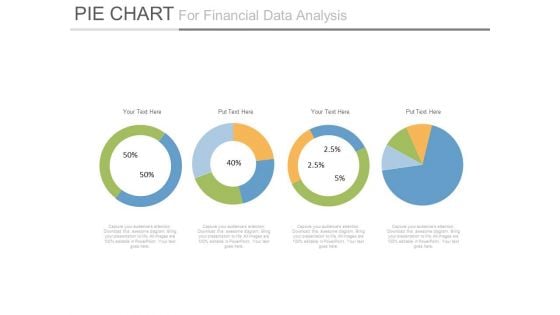
Pie Charts For Financial Ratio Analysis Powerpoint Slides
This PowerPoint template has been designed with diagram of pie charts. This PPT slide can be used to prepare presentations for profit growth report and also for financial data analysis. You can download finance PowerPoint template to prepare awesome presentations.
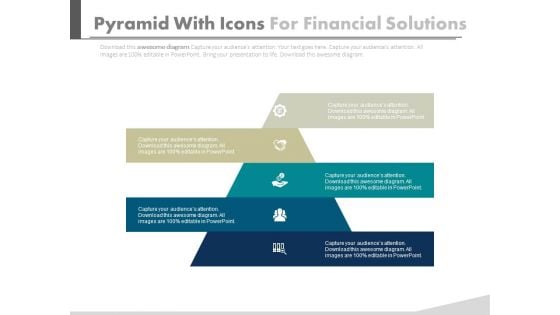
Pyramid For Financial Accounting Information Powerpoint Slides
This PowerPoint template has been designed with graphics of pyramid chart. This PPT slide can be used to prepare presentations for profit growth report and also for financial data analysis. You can download finance PowerPoint template to prepare awesome presentations.
Map Of Czech With Percentage Data And Icons Powerpoint Slides
This PowerPoint template displays map of Czech with percentage data and icons. This Map template can be used for annual growth report. This slide can also be used by school students for educational projects.
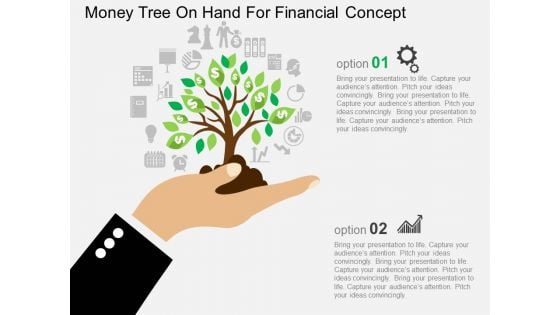
Money Tree On Hand For Financial Concept Powerpoint Template
This business diagram contains graphics of money tree. Our professionally designed business diagram is as an effective tool for communicating concepts of financial growth and strategies. Enlighten your audience with your breathtaking ideas.
Vertical Timeline With Years And Icons Powerpoint Slides
This PowerPoint timeline slide design can be used to display yearly business growth. It contain vertical timeline diagram with years and icons. This timeline template can be used in presentations where you need to display business strategy and planning.
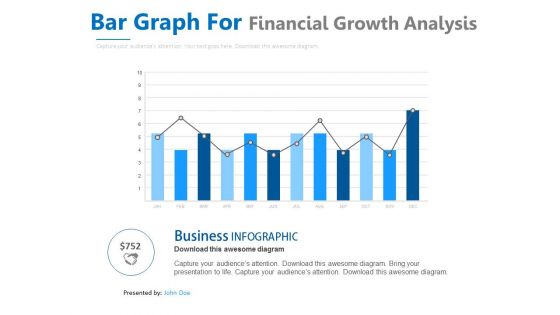
Bar Graph With Line Chart For Analysis Powerpoint Slides
This PowerPoint template contains design of bar graph with line chart. You may download this slide to display strategy steps for business growth. You can easily customize this template to make it more unique as per your need.
Four Overlapping Steps With Icons Powerpoint Template
This PPT slide contains four overlapping steps with business icons. This PPT diagram is suitable to present concept of profit growth value analysis. Enlighten others on the process with this innovative PowerPoint template.
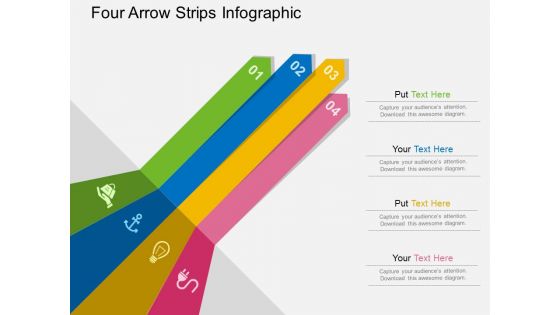
Four Arrow Strips Infographic Powerpoint Templates
Our above slide contains graphics of bulb with success graph. It helps to exhibit planning for growth. Use this diagram to impart more clarity to data and to create more sound impact on viewers.
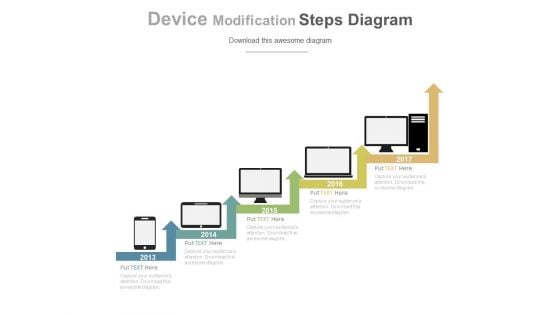
Comparison Between Varying Hardware Technologies Powerpoint Slides
This PPT slide displays graphics of computers diagram with growth steps. Use this PPT design to display varying hardware technologies. This PowerPoint template can be customized as per requirements of business education or any other theme.
Five Pointers Timeline Diagram With Icons Powerpoint Slides
This PowerPoint template has been designed with five pointers timeline diagram with icons. This PPT slide may be helpful to display business growth and analysis. Download this PowerPoint timeline template to make impressive presentations.
Four Circles With Percentage Values And Icons Powerpoint Slides
This PowerPoint template displays info graphic diagram of linear circles. This diagram may be used to exhibit financial growth and analysis. Grab center stage with this slide and capture the attention of your audience.
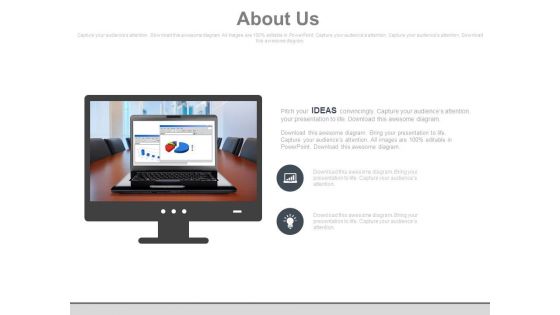
Business Charts About Us Slide Powerpoint Slides
This PowerPoint template has been designed with graphics of business charts. Download this PPT slide to display industry growth statistics. You can easily customize this template to make it more unique as per your need.
Five Linear Circles And Icons For Technology Powerpoint Slides
This PowerPoint template has been designed with five linear circles and icons. This professional PPT slide is suitable to present technology growth steps. Capture the attention of your audience using this professional slide.
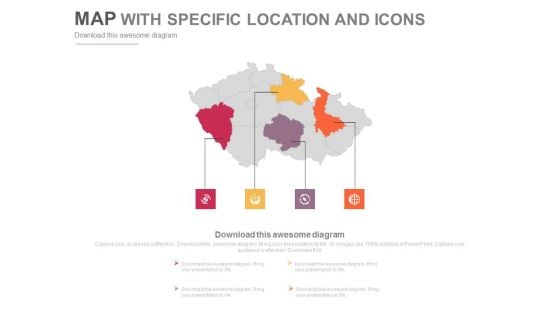
Infographic Map Diagram With Four Points Powerpoint Slides
This PowerPoint template displays infographic map design. This PPT template can be used in business presentations to depict economic growth of highlighted states. This slide can also be used by school students for educational projects.
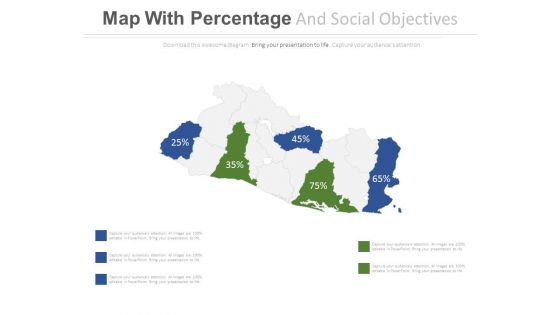
Map With Highlighted Areas And Percentage Values Powerpoint Slides
This PowerPoint template displays map diagram with highlighted areas and percentage values. You may use this PPT slide to exhibit area wise financial growth. Download this PowerPoint map diagram to build impressive presentations.
Four Years Tags With Timeline Icons Powerpoint Slides
This PowerPoint timeline slide design can be used to display yearly business growth. It contains four years tags with timeline. This timeline template can be used in presentations where you need to display business strategy and planning.
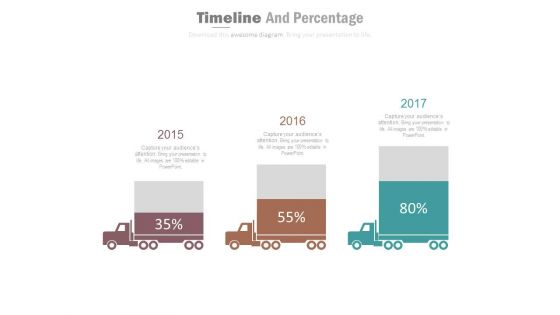
Three Trucks Timeline Diagram With Percentage Value Powerpoint Slides
This PowerPoint timeline template has been designed with three trucks with percentage values. This timeline template may be used to display three years growth planning. Download this PowerPoint timeline template to make impressive presentations.
Company Vision Corporate Graphics Powerpoint Slides
This PowerPoint template contains corporate vision design. You may download this diagram slide to depict business mission and vision for growth. Add this slide to your presentation and impress your superiors.
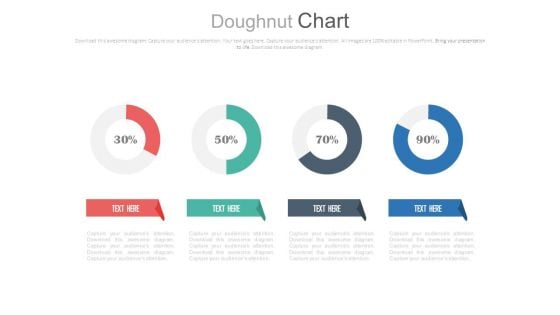
Four Circle Chart With Percentage Ratios Powerpoint Slides
This PowerPoint template has been designed with graphics of four circles and percentage ratios. You may use this dashboard slide design for topics like profit growth and financial planning. This PPT slide is powerful tool to describe your ideas.
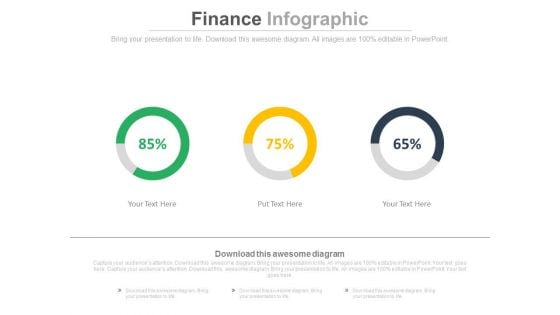
Linear Circles Percentage Analysis Charts Powerpoint Slides
This PowerPoint template has been designed with graphics of three circles and percentage ratios. You may use this dashboard slide design for topics like profit growth and financial planning. This PPT slide is powerful tool to describe your ideas.
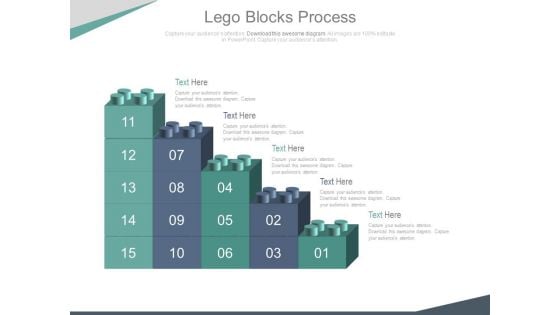
Bar Graph Of Lego Blocks For Data Analysis Powerpoint Slides
This PowerPoint template contains bar graph made of Lego blocks. You may use this slide to display growth process. This diagram provides an effective way of displaying information you can edit text, color, shade and style as per you need.
Four Options With Gears Mike And Graph Icons Powerpoint Templates
Visually support your presentation with our above template illustrating four options infographic. You may use this diagram to exhibit growth measurement. Convey your views with this business diagram slide.
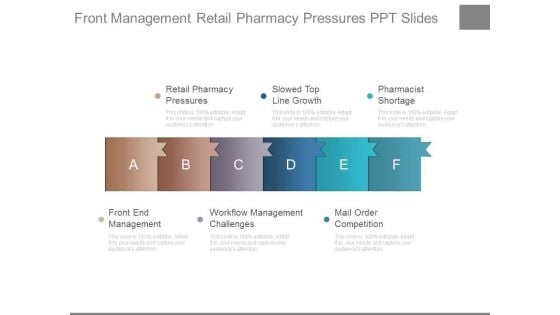
Front Management Retail Pharmacy Pressures Ppt Slide
This is a front management retail pharmacy pressures ppt slide. This is a six stage process. The stages in this process are retail pharmacy pressures, slowed top line growth, pharmacist shortage, mail order competition, front end management, workflow management challenges.
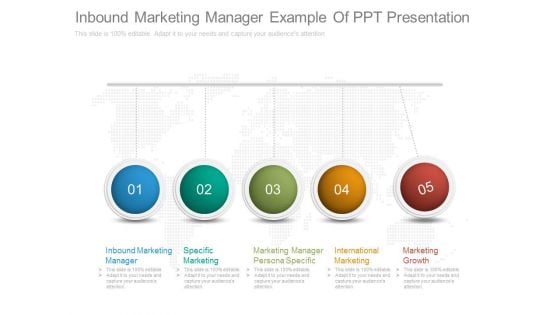
Inbound Marketing Manager Example Of Ppt Presentation
This is an inbound marketing manager example of ppt presentation. This is a five stage process. The stages in this process are inbound marketing manager, specific marketing, marketing manager persona specific, international marketing, marketing growth. \n \n

Numerous Competitors Presentation Backgrounds
This is a numerous competitors presentation backgrounds. This is a six stage process. The stages in this process are threat of substitute product or service, bargaining leverage, numerous competitors, rivalry among existing competitors, price sensitivity, slow industry growth.

Financial Measures Powerpoint Slides Background Designs
This is a financial measures powerpoint slides background designs. This is a five stage process. The stages in this process are traditional strategic management, internal processes, customer relationship, learning and growth, financial measures.
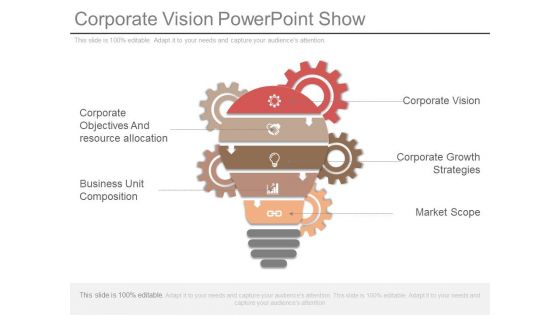
Corporate Vision Powerpoint Show
This is a corporate vision powerpoint show. This is a five stage process. The stages in this process are corporate objectives and resource allocation, business unit composition, corporate vision, corporate growth strategies, market scope.
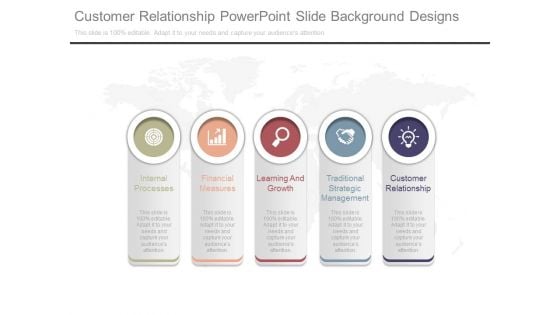
Customer Relationship Powerpoint Slide Background Designs
This is a customer relationship powerpoint slide background designs. This is a five stage process. The stages in this process are internal processes, financial measures, learning and growth, traditional strategic management, customer relationship.
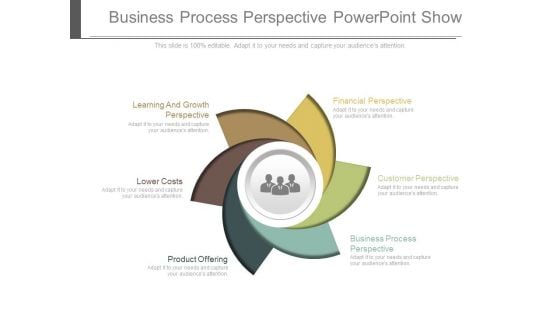
Business Process Perspective Powerpoint Show
This is a business process perspective powerpoint show. This is a six stage process. The stages in this process are learning and growth perspective, lower costs, product offering, financial perspective, customer perspective, business process perspective.
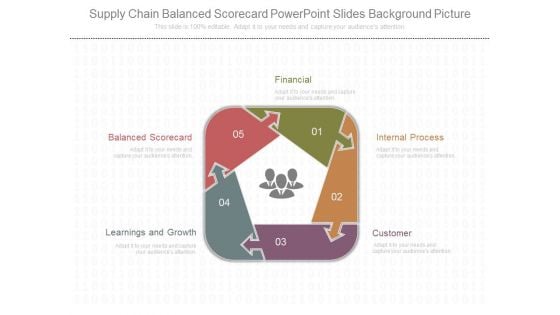
Supply Chain Balanced Scorecard Powerpoint Slides Background Picture
This is a supply chain balanced scorecard powerpoint slides background picture. This is a five stage process. The stages in this process are financial, internal process, customer, balanced scorecard, learnings and growth.
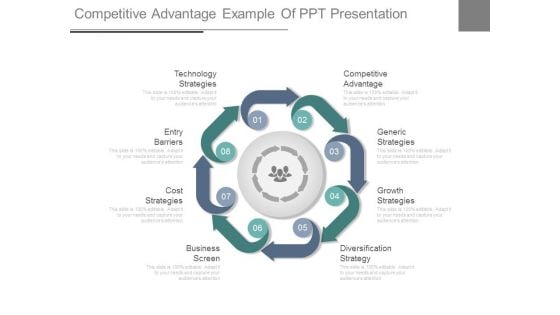
Competitive Advantage Example Of Ppt Presentation
This is a competitive advantage example of ppt presentation. This is a eight stage process. The stages in this process are technology strategies, competitive advantage, generic strategies, growth strategies, diversification strategy, business screen, cost strategies, entry barriers.
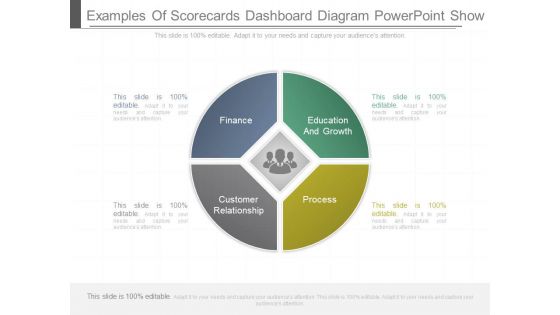
Examples Of Scorecards Dashboard Diagram Powerpoint Show
This is a examples of scorecards dashboard diagram powerpoint show. This is a four stage process. The stages in this process are finance, education and growth, customer relationship, process.

Online Business Model Selection Diagram Ppt Example
This is a online business model selection diagram ppt example. This is a six stage process. The stages in this process are value proposition, market segmentation, value chain structure, remove model, competitive strategy, growth strategy.

Investments Delivering Result Powerpoint Templates
This is a investments delivering result powerpoint templates. This is a four stage process. The stages in this process are shareholder value creation, gaining market share, investments delivering result, strong earnings growth.
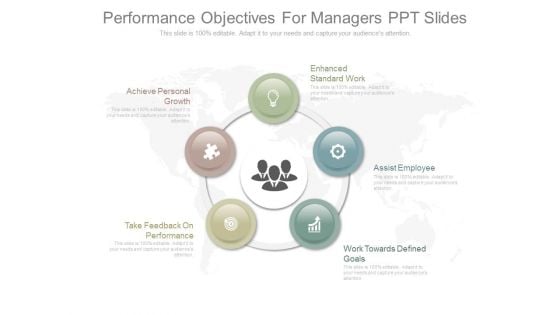
Performance Objectives For Managers Ppt Slides
This is a performance objectives for managers ppt slides. This is a five stage process. The stages in this process are achieve personal growth, enhanced standard work, assist employee, work towards defined goals, take feedback on performance.

Maximize Marketing Productivity And Sales Design Ppt Slides
This is a maximize marketing productivity and sales design ppt slides. This is a four stage process. The stages in this process are empower your sales force, drive sales growth, identify your best prospects, personalize your sales experience.
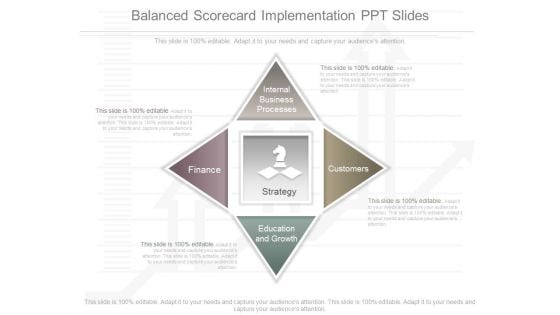
Balanced Scorecard Implementation Ppt Slides
This is a balanced scorecard implementation ppt slides. This is a four stage process. The stages in this process are internal business processes, finance, strategy, customers, education and growth.
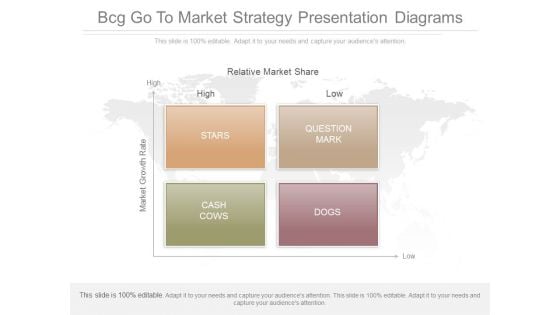
Bcg Go To Market Strategy Presentation Diagrams
This is a bcg go to market strategy presentation diagrams. This is a four stage process. The stages in this process are high, low, cash cows, dogs, relative market share, market growth rate.
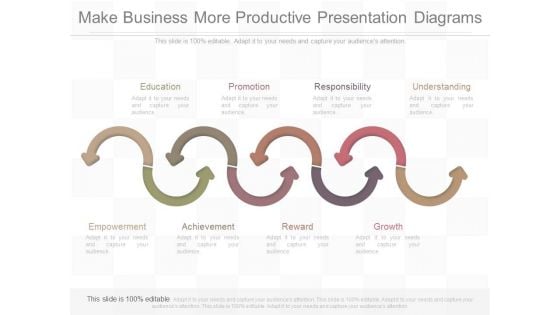
Make Business More Productive Presentation Diagrams
This is a make business more productive presentation diagrams. This is a eight stage process. The stages in this process are education, promotion, responsibility, understanding, empowerment, achievement, reward, growth.
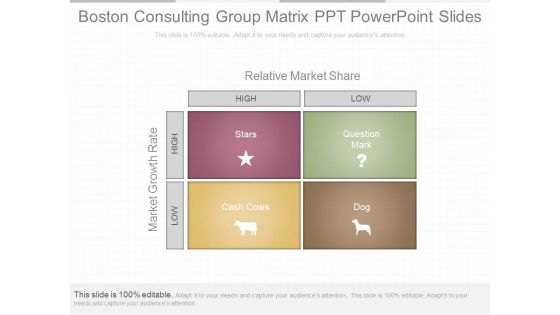
Boston Consulting Group Matrix Ppt Powerpoint Slides
This is a boston consulting group matrix ppt powerpoint slides. This is a four stage process. The stages in this process are relative market share, high, market growth rate, question mark, cash cows, dog.
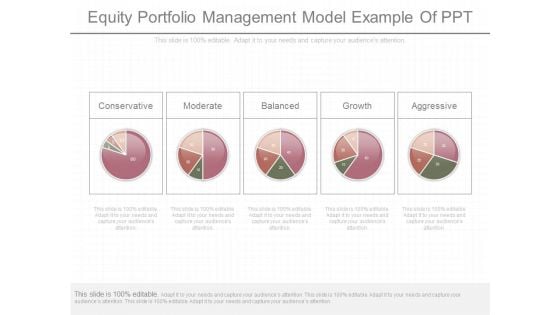
Equity Portfolio Management Model Example Of Ppt
This is a equity portfolio management model example of ppt. This is a five stage process. The stages in this process are conservative, moderate, balanced, growth, aggressive. \n \n \n \n
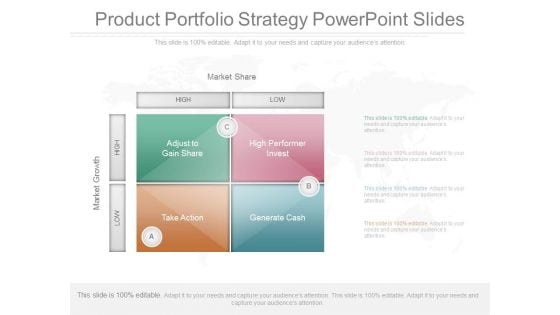
Product Portfolio Strategy Powerpoint Slides
This is a product portfolio strategy powerpoint slides. This is a four stage process. The stages in this process are market share, market growth, low, high, adjust to gain share, high performer invest, generate cash, take action.\n\n\n\n\n\n\n\n\n\n\n\n \n


 Continue with Email

 Home
Home


