evolution
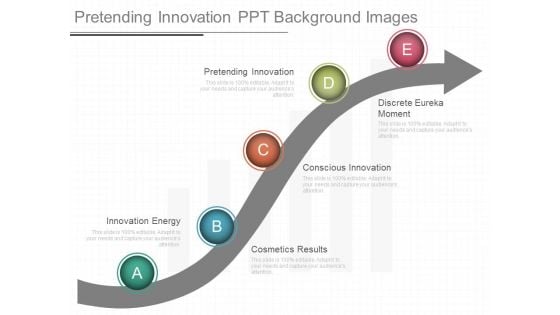
Pretending Innovation Ppt Background Images
This is a pretending innovation ppt background images. This is a five stage process. The stages in this process are innovation energy, pretending innovation, cosmetics results, conscious innovation, discrete eureka moment.
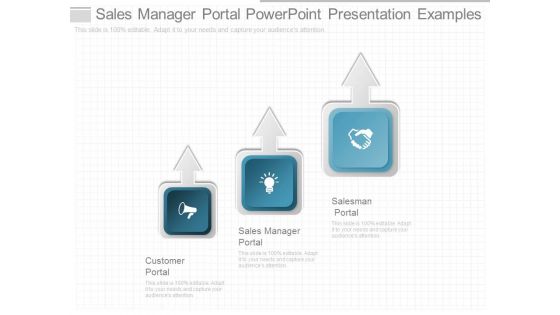
Sales Manager Portal Powerpoint Presentation Examples
This is a sales manager portal powerpoint presentation examples. This is a three stage process. The stages in this process are customer portal, sales manager portal, salesman portal.
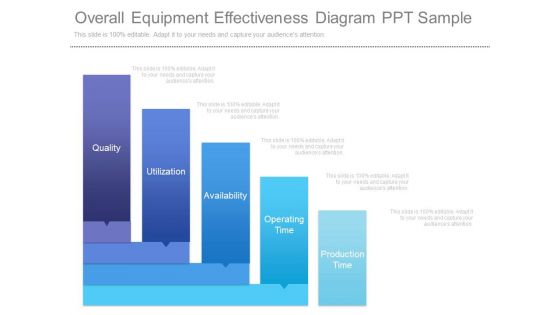
Overall Equipment Effectiveness Diagram Ppt Sample
This is a overall equipment effectiveness diagram ppt sample. This is a five stage process. The stages in this process are quality, utilization, availability, operating time, production time.

Entrepreneurial Coaching Techniques Ppt Examples Slides
This is a entrepreneurial coaching techniques ppt examples slides. This is a five stage process. The stages in this process are deliver, plan, goals, strategy, vision.
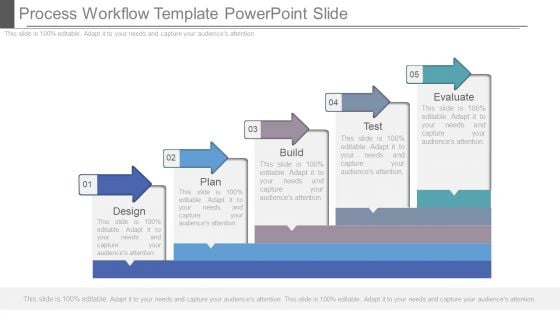
Process Workflow Template Powerpoint Slide
This is a process workflow template powerpoint slide. This is a five stage process. The stages in this process are design, plan, build, test, evaluate.
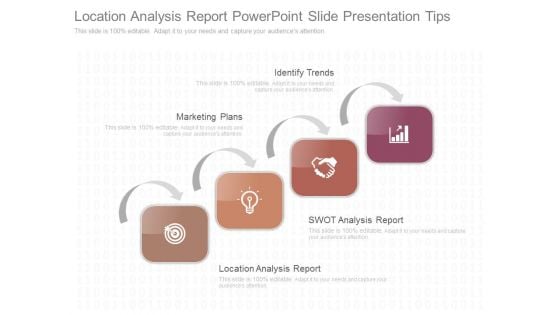
Location Analysis Report Powerpoint Slide Presentation Tips
This is a location analysis report powerpoint slide presentation tips. This is a four stage process. The stages in this process are identify trends, marketing plans, swot analysis report, location analysis report.
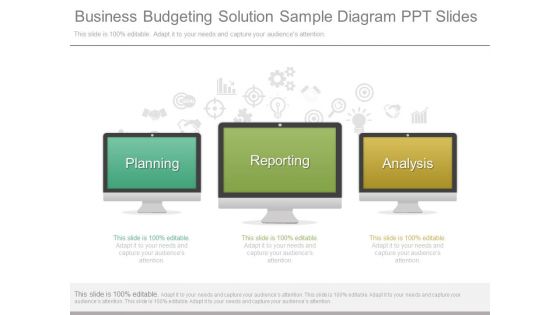
Business Budgeting Solution Sample Diagram Ppt Slides
This is a business budgeting solution sample diagram ppt slides. This is a three stage process. The stages in this process are planning, reporting, analysis.
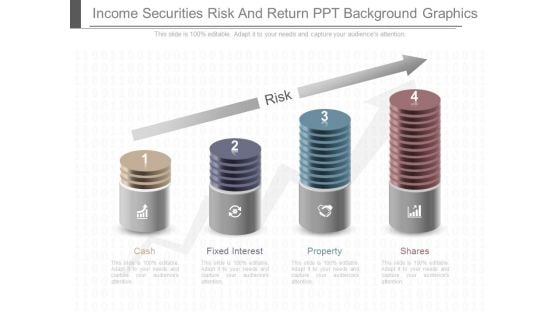
Income Securities Risk And Return Ppt Background Graphics
This is a income securities risk and return ppt background graphics. This is a four stage process. The stages in this process are cash, fixed interest, property, shares, risk.
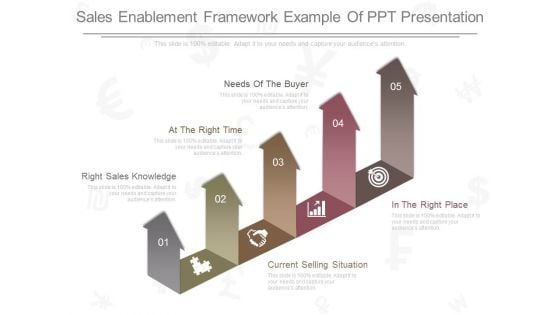
Sales Enablement Framework Example Of Ppt Presentation
This is a sales enablement framework example of ppt presentation. This is a five stage process. The stages in this process are right sales knowledge, current selling situation, at the right time, in the right place, needs of the buyer.
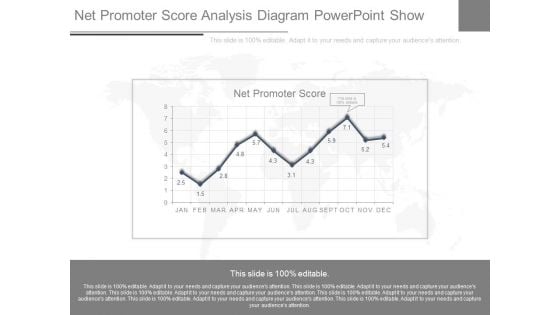
Net Promoter Score Analysis Diagram Powerpoint Show
This is a net promoter score analysis diagram powerpoint show. This is a twelve stage process. The stages in this process are net promoter score, jan, feb, mar, apr, may, jun, jul, aug, sep, oct, nov, dec.
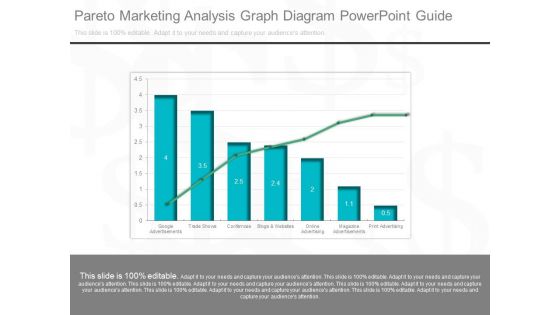
Pareto Marketing Analysis Graph Diagram Powerpoint Guide
This is a pareto marketing analysis graph diagram powerpoint guide. This is a seven stage process. The stages in this process are google advertisements, trade shows, conferences, blog and websites, online advertising, magazine advertisements, print advertising.

School Marketing Example Of Ppt Presentation
This is a school marketing example of ppt presentation. This is a seven stage process. The stages in this process are market director manager, headteacher, deputy head, business manager, admissions manager, other, no specific indific individual, independent, state.
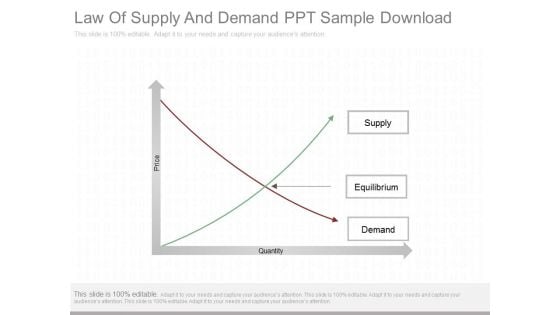
Law Of Supply And Demand Ppt Sample Download
This is a law of supply and demand ppt sample download. This is a three stage process. The stages in this process are supply, equilibrium, demand.
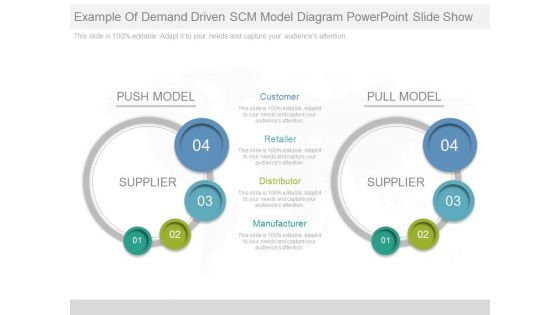
Example Of Demand Driven Scm Model Diagram Powerpoint Slide Show
This is a example of demand driven scm model diagram powerpoint slide show. This is a four stage process. The stages in this process are push model, supplier, pull model, customer, retailer, distributor, manufacturer.
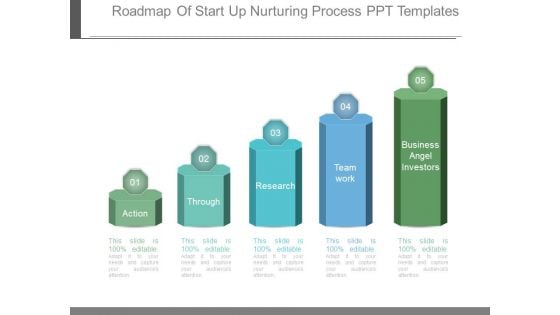
Roadmap Of Start Up Nurturing Process Ppt Templates
This is a roadmap of start up nurturing process ppt templates. This is a five stage process. The stages in this process are action, through, research, team work, business angel investors.

Objectives Of Financial Management Ppt Ideas
This is a objectives of financial management ppt ideas. This is a six stage process. The stages in this process are salaries, hst filing, account payable, financial management, accounts receivable, cash flow analysis.
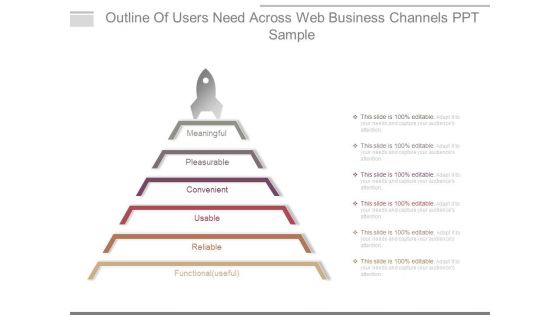
Outline Of Users Need Across Web Business Channels Ppt Sample
This is a outline of users need across web business channels ppt sample. This is a six stage process. The stages in this process are meaningful, pleasurable, convenient, usable, reliable, functional useful.
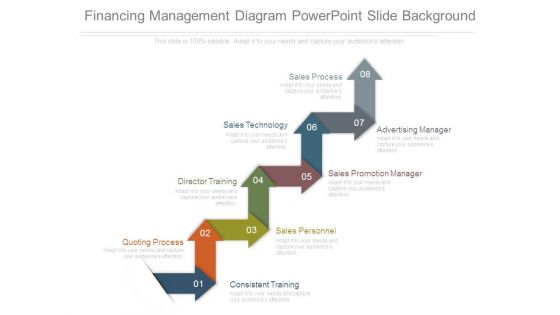
Financing Management Diagram Powerpoint Slide Background
This is a financing management diagram powerpoint slide background. This is a eight stage process. The stages in this process are sales process, sales technology, advertising manager, sales promotion manager, director training, sales personnel, consistent training, quoting process.
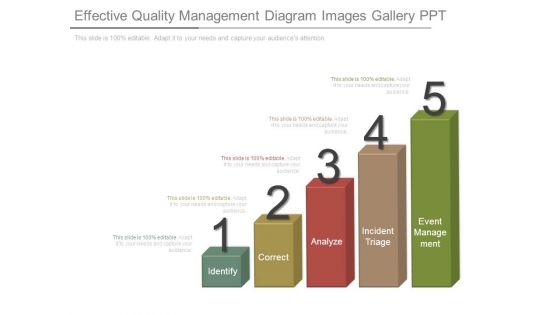
Effective Quality Management Diagram Images Gallery Ppt
This is a effective quality management diagram images gallery ppt. This is a five stage process. The stages in this process are identify, correct, analyze, incident triage, event management.
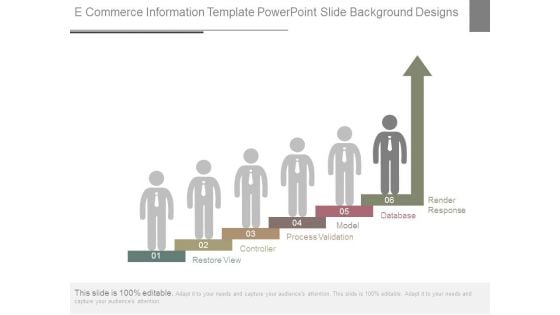
E Commerce Information Template Powerpoint Slide Background Designs
This is a e commerce information template powerpoint slide background designs. This is a six stage process. The stages in this process are restore view, controller, process validation, model, database, render response.
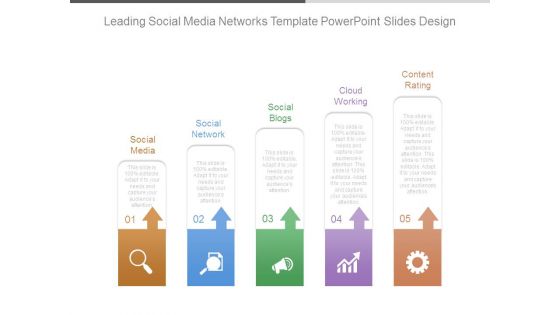
Leading Social Media Networks Template Powerpoint Slides Design
This is a leading social media networks template powerpoint slides design. This is a five stage process. The stages in this process are social media, social network, social blogs, cloud working, content rating.
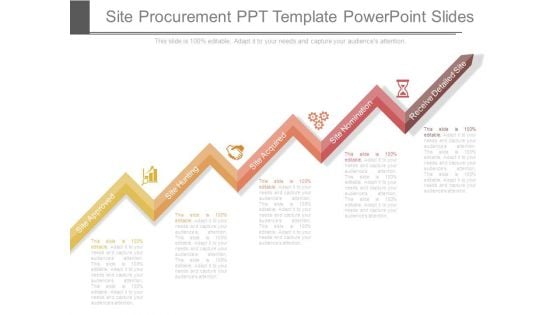
Site Procurement Ppt Template Powerpoint Slides
This is a site procurement ppt template powerpoint slides. This is a five stage process. The stages in this process are site approved, site hunting, site acquired, site nomination, receive detailed site.
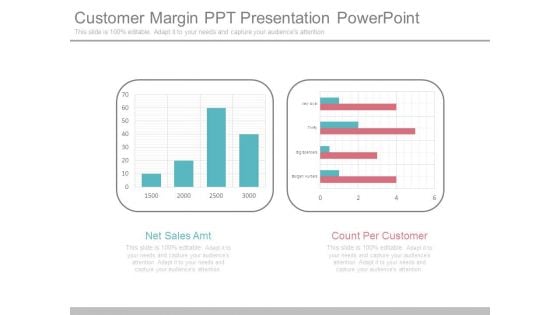
Customer Margin Ppt Presentation Powerpoint
This is a customer margin ppt presentation powerpoint. This is a two stage process. The stages in this process are net sales amt, count per customer.
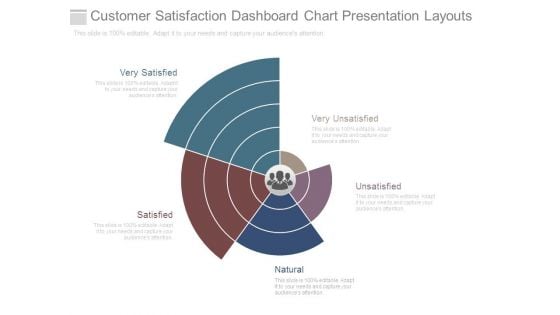
Customer Satisfaction Dashboard Chart Presentation Layouts
This is a customer satisfaction dashboard chart presentation layouts. This is a five stage process. The stages in this process are very satisfied, satisfied, unsatisfied, natural, very unsatisfied.
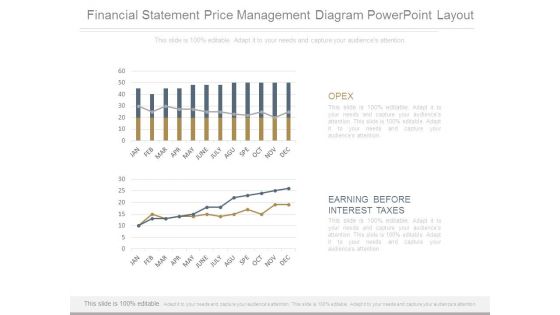
Financial Statement Price Management Diagram Powerpoint Layout
This is a financial statement price management diagram powerpoint layout. This is a two stage process. The stages in this process are opex, earning before interest taxes.
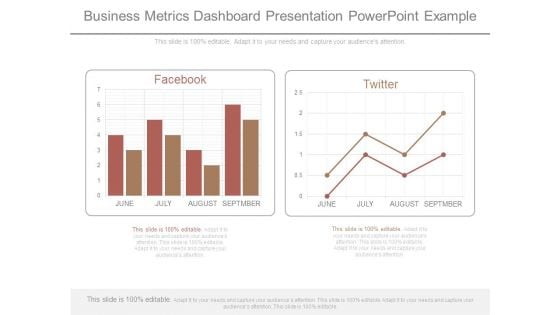
Business Metrics Dashboard Presentation Powerpoint Example
This is a business metrics dashboard presentation powerpoint example. This is a two stage process. The stages in this process are facebook, twitter.
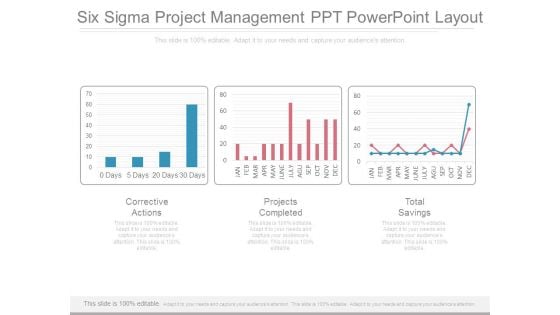
Six Sigma Project Management Ppt Powerpoint Layout
This is a six sigma project management ppt powerpoint layout. This is a three stage process. The stages in this process are corrective actions, projects completed, total savings.
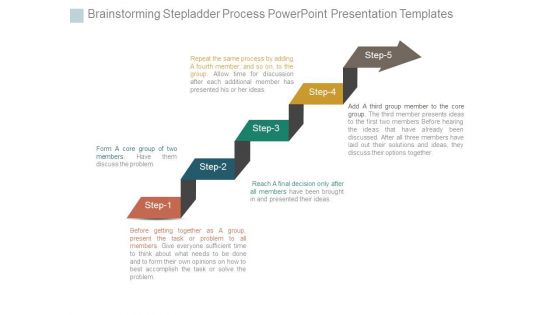
Brainstorming Stepladder Process Powerpoint Presentation Templates
This is a brainstorming stepladder process powerpoint presentation templates. This is a five stage process. The stages in this process are steps, process, business, planning, strategy.
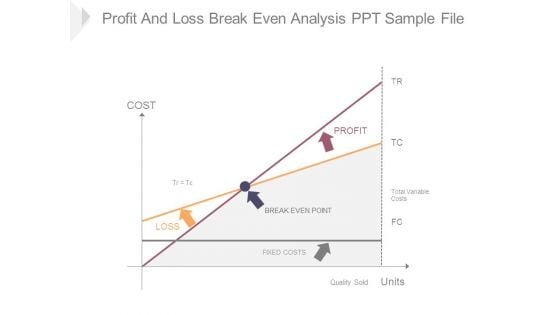
Profit And Loss Break Even Analysis Ppt Sample File
This is a profit and loss break even analysis ppt sample file. This is a two stage process. The stages in this process are cost, loss, profit, fixed costs, break even point, quantity sold, units, total variable costs.
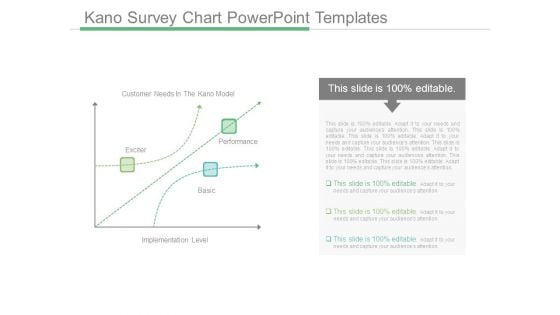
Kano Survey Chart Powerpoint Templates
This is a kano survey chart powerpoint templates. This is a three stage process. The stages in this process are customer needs in the kano model, exciter, performance, basic, implementation level.
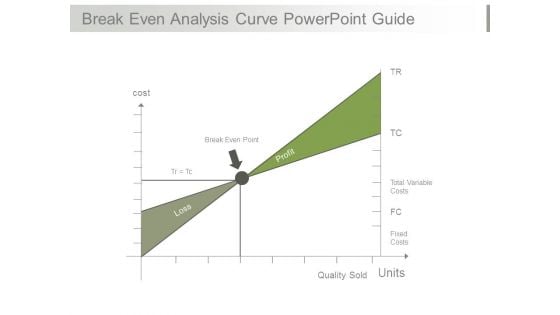
Break Even Analysis Curve Powerpoint Guide
This is a break even analysis curve powerpoint guide. This is a one stage process. The stages in this process are cost, break even point, loss, profit, total variable costs, fixed costs, quality sold, units.
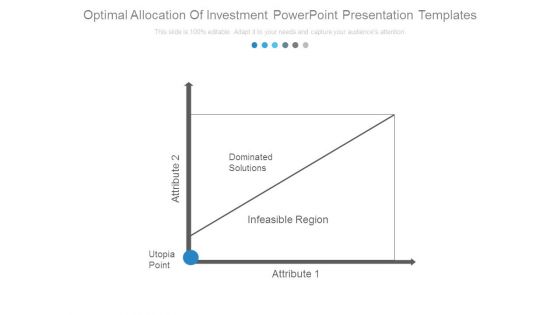
Optimal Allocation Of Investment Powerpoint Presentation Templates
This is a optimal allocation of investment powerpoint presentation templates. This is a two stage process. The stages in this process are attribute, utopia point, dominated solutions, infeasible region.
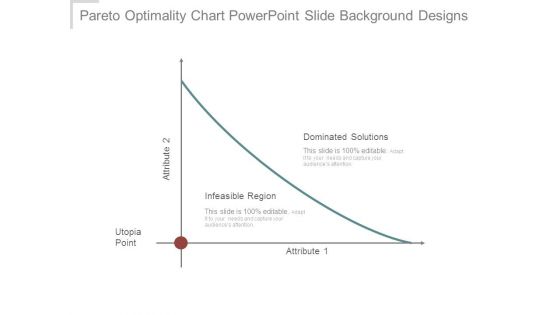
Pareto Optimality Chart Powerpoint Slide Background Designs
This is a pareto optimality chart powerpoint slide background designs. This is a one stage process. The stages in this process are dominated solutions, infeasible region, utopia point, attribute.
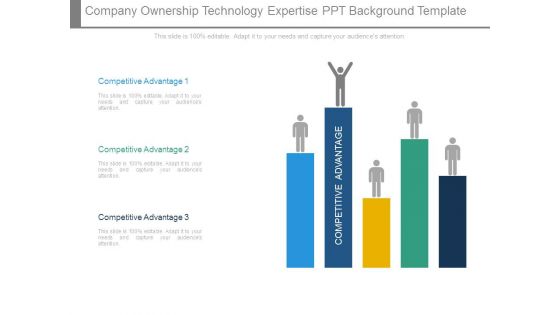
Company Ownership Technology Expertise Ppt Background Template
This is a company ownership technology expertise ppt background template. This is a five stage process. The stages in this process are competitive advantage.
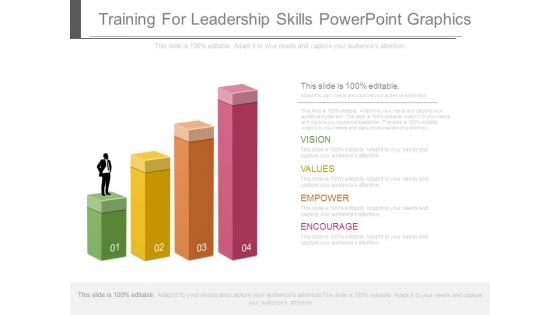
Training For Leadership Skills Powerpoint Graphics
This is a training for leadership skills powerpoint graphics. This is a four stage process. The stages in this process are vision, values, empower, encourage.
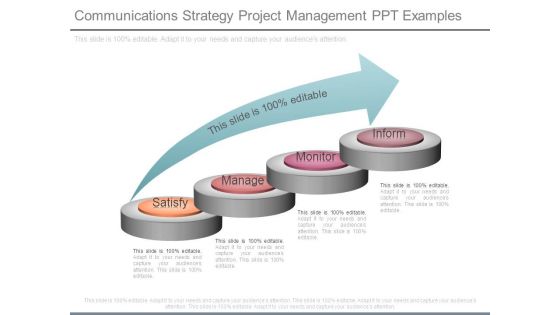
Communications Strategy Project Management Ppt Examples
This is a communications strategy project management ppt examples. This is a four stage process. The stages in this process are satisfy, manage, monitor, inform.
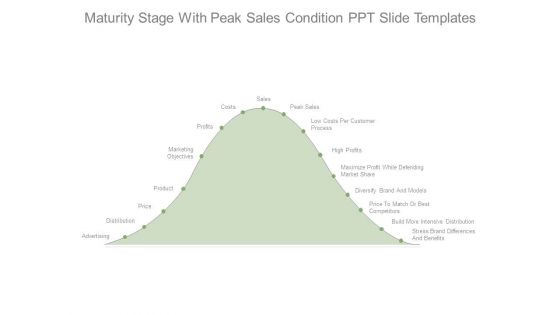
Maturity Stage With Peak Sales Condition Ppt Slide Templates
This is a maturity stage with peak sales condition ppt slide templates. This is a one stage process. The stages in this process are advertising, distribution, price, product, marketing objectives, profits, costs, sales, peak sales, low costs per customer process, high profits, maximize profit while defending market share, diversify brand and models, price to match or best competitors, build more intensive distribution, stress brand differences and benefits.
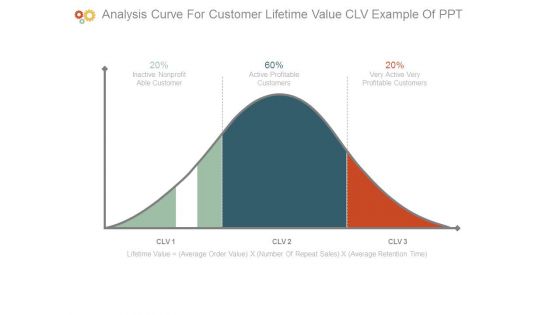
Analysis Curve For Customer Lifetime Value Clv Example Of Ppt
This is a analysis curve for customer lifetime value clv example of ppt. This is a three stage process. The stages in this process are inactive nonprofit able customer, active profitable customers, clv, lifetime value average order value x number of repeat sales x average retention time.
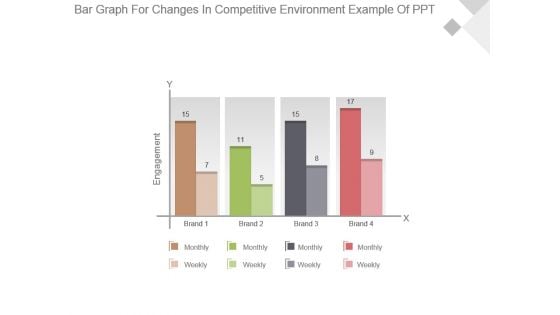
Bar Graph For Changes In Competitive Environment Example Of Ppt
This is a bar graph for changes in competitive environment example of ppt. This is a four stage process. The stages in this process are engagement, brand, monthly, weekly.
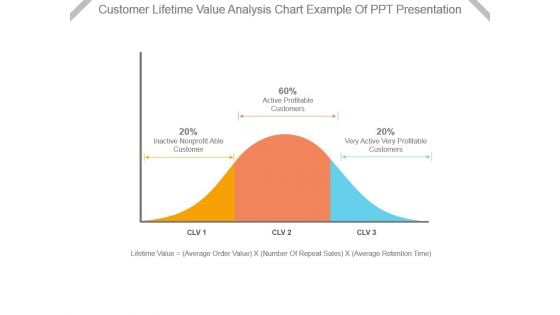
Customer Lifetime Value Analysis Chart Example Of Ppt Presentation
This is a customer lifetime value analysis chart example of ppt presentation. This is a three stage process. The stages in this process are inactive nonprofit able customer, active profitable customers, very active very profitable customers, lifetime value, average order value, number of repeat sales, average retention time.
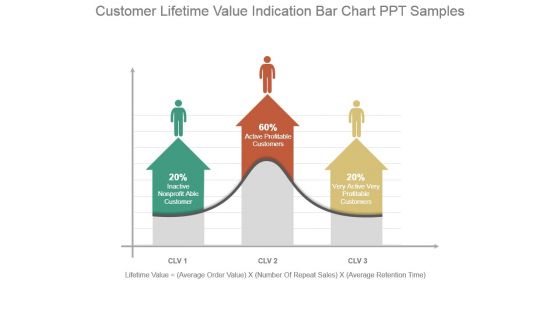
Customer Lifetime Value Indication Bar Chart Ppt Samples
This is a customer lifetime value indication bar chart ppt samples. This is a three stage process. The stages in this process are inactive nonprofit able customer, active profitable customers, very active very profitable customers, lifetime value, average order value, number of repeat sales, average retention time.
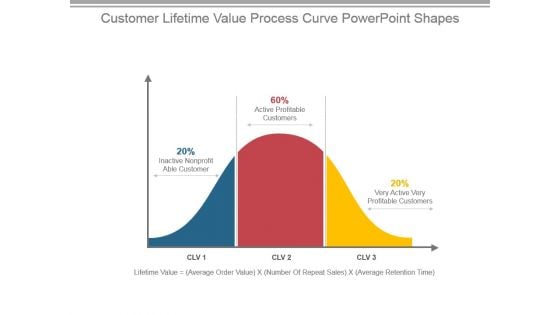
Customer Lifetime Value Process Curve Powerpoint Shapes
This is a customer lifetime value process curve powerpoint shapes. This is a three stage process. The stages in this process are inactive nonprofit able customer, active profitable customers, very active very profitable customers, lifetime value, average order value, number of repeat sales, average retention time.
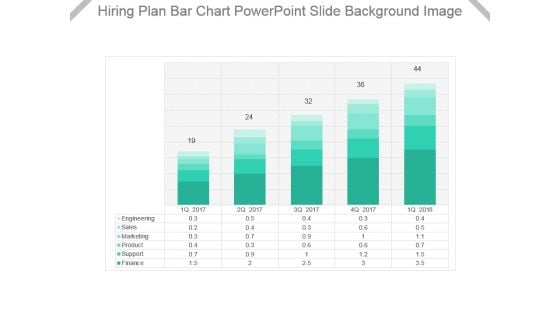
Hiring Plan Bar Chart Powerpoint Slide Background Image
This is a hiring plan bar chart powerpoint slide background image. This is a five stage process. The stages in this process are engineering, sales, marketing, product, support, finance.
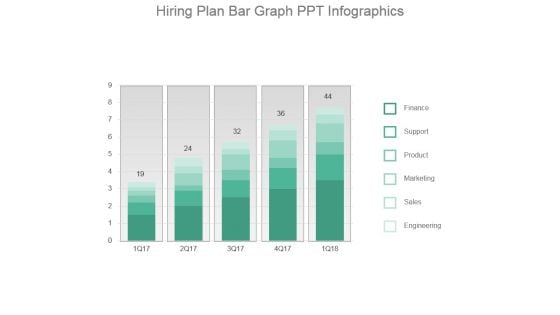
Hiring Plan Bar Graph Ppt Infographics
This is a hiring plan bar graph ppt infographics. This is a five stage process. The stages in this process are finance, support, product, marketing, sales, engineering.
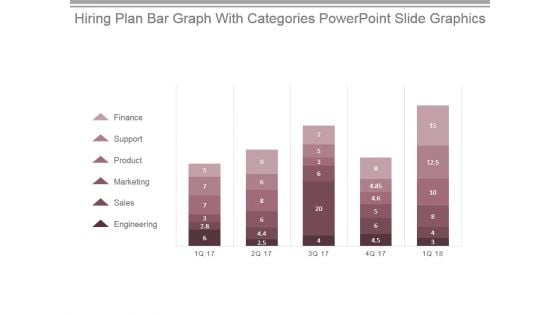
Hiring Plan Bar Graph With Categories Powerpoint Slide Graphics
This is a hiring plan bar graph with categories powerpoint slide graphics. This is a five stage process. The stages in this process are finance, support, product, marketing, sales, engineering.
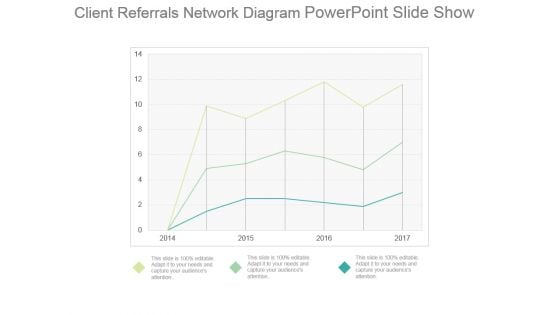
Client Referrals Network Diagram Powerpoint Slide Show
This is a client referrals network diagram powerpoint slide show. This is a three stage process. The stages in this process are business, marketing, strategy, management, analysis.
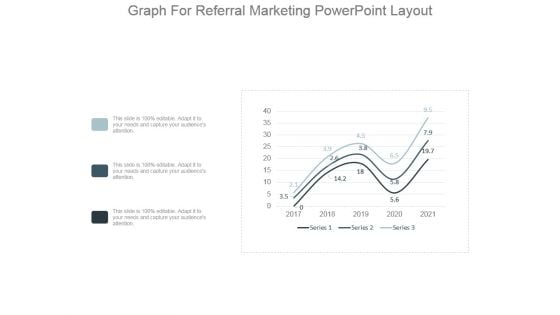
Graph For Referral Marketing Powerpoint Layout
This is a graph for referral marketing powerpoint layout. This is a three stage process. The stages in this process are series.
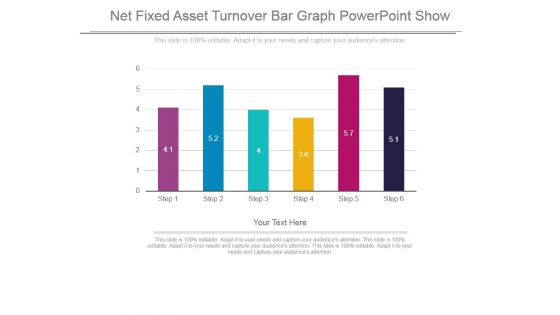
Net Fixed Asset Turnover Bar Graph Powerpoint Show
This is a net fixed asset turnover bar graph powerpoint show. This is a six stage process. The stages in this process are bar graph, presentation, strategy, business, management.
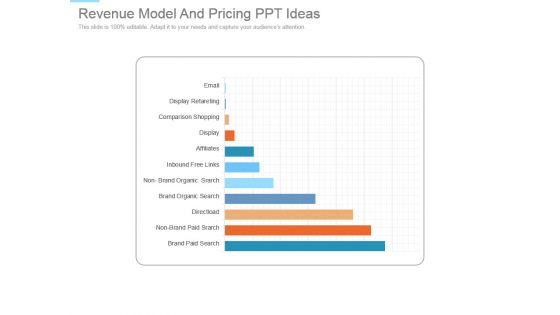
Revenue Model And Pricing Ppt Ideas
This is a revenue model and pricing ppt ideas. This is a eleven stage process. The stages in this process are brand paid search, non brand paid search, direct load, brand organic search, non brand organic search, inbound free links, affiliates, display, comparison shopping, display retargeting, email.
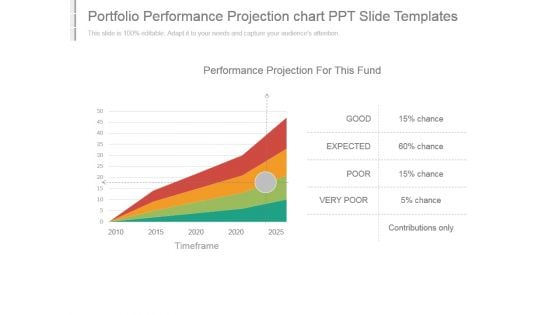
Portfolio Performance Projection Chart Ppt Slide Templates
This is a portfolio performance projection chart ppt slide templates. This is a four stage process. The stages in this process are performance projection for this fund, good, expected, poor, very poor, contributions only, timeframe.

Measure Stock Performance Example Of Ppt
This is a measure stock performance example of ppt. This is a four stage process. The stages in this process are good, poor, expected, very poor, chance, contributions only, performance projection for this fund, timeframe.
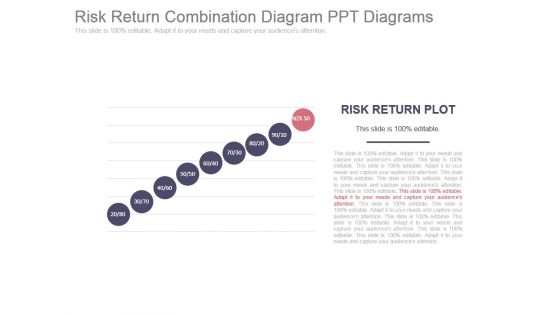
Risk Return Combination Diagram Ppt Diagrams
This is a risk return combination diagram ppt diagrams. This is a nine stage process. The stages in this process are risk return plot.
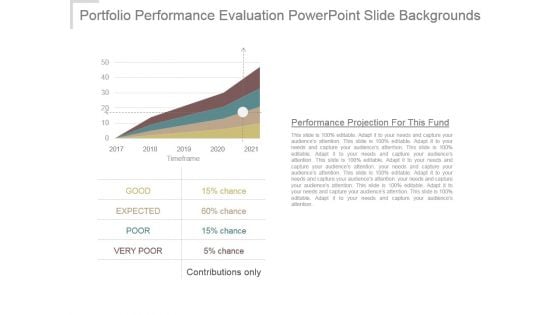
Portfolio Performance Evaluation Powerpoint Slide Backgrounds
This is a portfolio performance evaluation powerpoint slide backgrounds. This is a four stage process. The stages in this process are performance projection for this fund, timeframe, good, expected, poor, very poor, contributions only, chance.
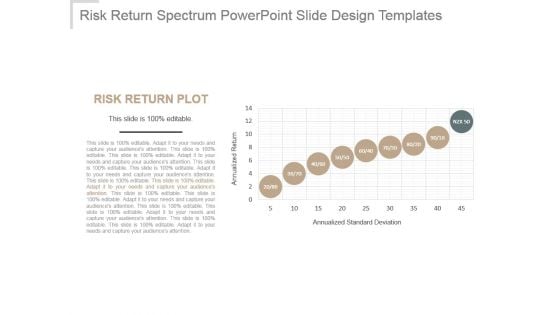
Risk Return Spectrum Powerpoint Slide Design Templates
This is a risk return spectrum powerpoint slide design templates. This is a nine stage process. The stages in this process are risk return plot, annualized return, annualized standard deviation.
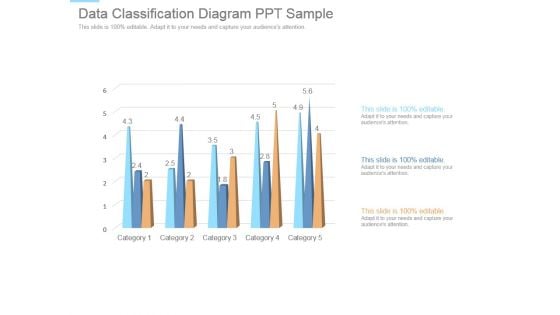
Data Classification Diagram Ppt Sample
This is a data classification diagram ppt sample. This is a five stage process. The stages in this process are category.
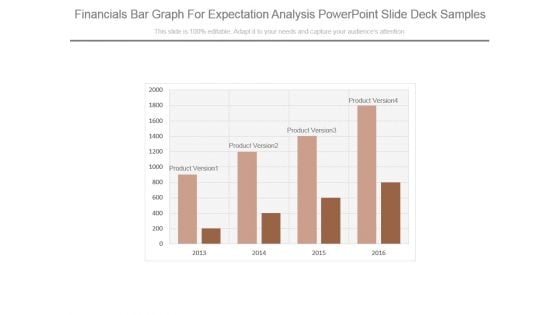
Financials Bar Graph For Expectation Analysis Powerpoint Slide Deck Samples
This is a financials bar graph for expectation analysis powerpoint slide deck samples. This is a four stage process. The stages in this process are product version.
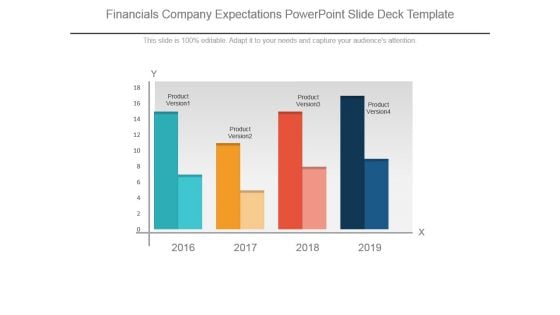
Financials Company Expectations Powerpoint Slide Deck Template
This is a financials company expectations powerpoint slide deck template. This is a four stage process. The stages in this process are product version.
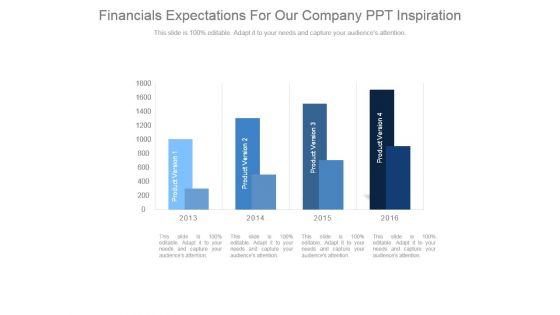
Financials Expectations For Our Company Ppt Inspiration
This is a financials expectations for our company ppt inspiration. This is a four stage process. The stages in this process are product version.
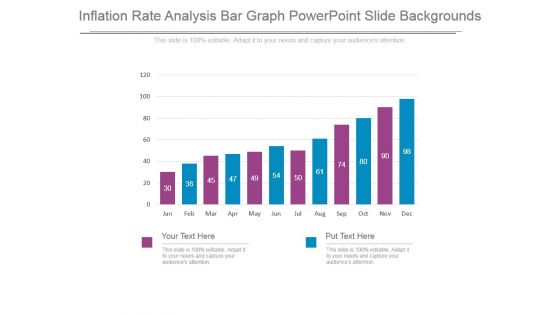
Inflation Rate Analysis Bar Graph Powerpoint Slide Backgrounds
This is a inflation rate analysis bar graph powerpoint slide backgrounds. This is a twelve stage process. The stages in this process are jan, feb, mar, apr, may, jun, jul, aug, sep, oct, nov, dec.
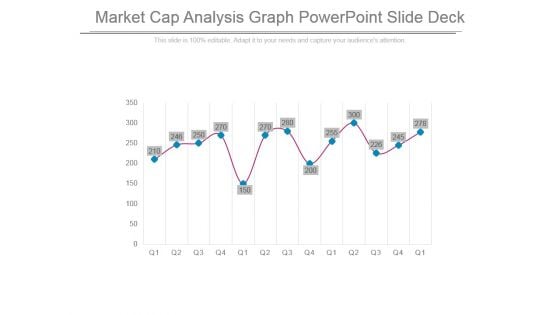
Market Cap Analysis Graph Powerpoint Slide Deck
This is a market cap analysis graph powerpoint slide deck. This is a three stage process. The stages in this process are business, finance, marketing, graph, management.


 Continue with Email

 Home
Home


