executive summary
Effective Online And Offline Promotional Meet Our Team Ppt Portfolio Slides PDF
Do you have an important presentation coming up Are you looking for something that will make your presentation stand out from the rest Look no further than Effective Online And Offline Promotional Meet Our Team Ppt Portfolio Slides PDF. With our professional designs, you can trust that your presentation will pop and make delivering it a smooth process. And with Slidegeeks, you can trust that your presentation will be unique and memorable. So why wait Grab Effective Online And Offline Promotional Meet Our Team Ppt Portfolio Slides PDF today and make your presentation stand out from the rest.
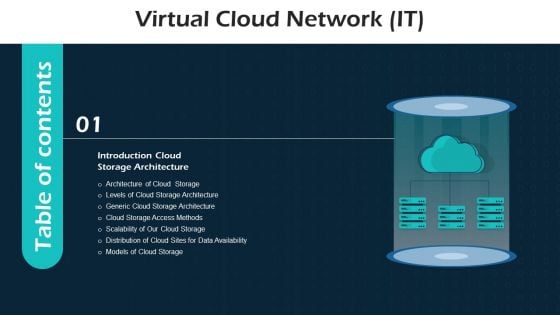
G05 Table Of Contents Virtual Cloud Network IT Ppt Show Inspiration PDF
Do you have an important presentation coming up Are you looking for something that will make your presentation stand out from the rest Look no further than G05 Table Of Contents Virtual Cloud Network IT Ppt Show Inspiration PDF. With our professional designs, you can trust that your presentation will pop and make delivering it a smooth process. And with Slidegeeks, you can trust that your presentation will be unique and memorable. So why wait Grab G05 Table Of Contents Virtual Cloud Network IT Ppt Show Inspiration PDF today and make your presentation stand out from the rest.
Stock Photo Video Marketing Text And Icon On Key PowerPoint Slide
This conceptual image has been designed with graphic of key with video marketing concept. Use this image in your technical presentations where you need to display the concept of video marketing. This image may also be used to display marketing strategies. This image is suitable for business, sales and technology related topics. Reach larger audience using this image.

Stock Photo Row Of Network Servers On White Background PowerPoint Slide
This image slide displays 3d black computer servers. This image has been designed with graphic of black computer servers. Use this image to express views on client server computing, network, data storage and backup. This image will enhance the quality of your presentations.
Stock Photo Question Mark Shape Made Up With Red Gears PowerPoint Slide
This image slide has been designed with graphic of question mark, made by red gears. Use this image in your business presentations to portray concepts of queries, doubts and confusions. Concept of problem solving may also be explained with this innovative graphic image.
Stock Photo Three Black Computer Servers On White Background PowerPoint Slide
This image slide displays 3d black computer servers. This image has been designed with graphic of black computer servers with blue lights on white background. Use this image to express views on client server, data storage and backup. This image will enhance the quality of your presentations.

Stock Photo Three Lifesaver With Server For Data Protection PowerPoint Slide
This image slide displays 3d black computer server with life savers. This image has been designed with graphic of black computer server with red and white life savers on white background. Use this image slide to express views on client server computing and data safety. This image will enhance the quality of your presentations.
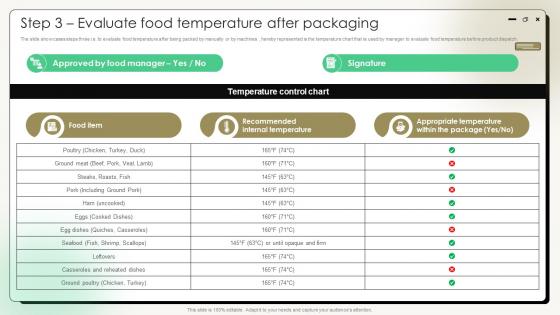
Comprehensive Guide On Current Strategies Step 3 Evaluate Food Temperature After Packaging
The slide showcases steps three i.e. to evaluate food temperature after being packed by manually or by machines, hereby represented is the temperature chart that is used by manager to evaluate food temperature before product dispatch. Do you know about Slidesgeeks Comprehensive Guide On Current Strategies Step 3 Evaluate Food Temperature After Packaging These are perfect for delivering any kind od presentation. Using it, create PowerPoint presentations that communicate your ideas and engage audiences. Save time and effort by using our pre-designed presentation templates that are perfect for a wide range of topic. Our vast selection of designs covers a range of styles, from creative to business, and are all highly customizable and easy to edit. Download as a PowerPoint template or use them as Google Slides themes. The slide showcases steps three i.e. to evaluate food temperature after being packed by manually or by machines, hereby represented is the temperature chart that is used by manager to evaluate food temperature before product dispatch.
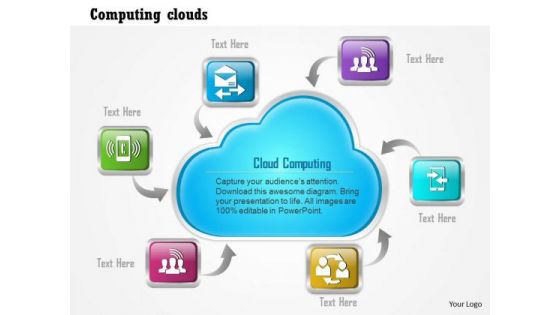
1 Cloud Computing Cloud With Mobile Devices Around It Showing Global Connectivity Ppt Slide
1 Ram Memory Chip Icon Flash Nand Pcie Device For Storage Ppt Slides
Captivate the attention of your audience with the help of professionally designed diagram of RAM memory chip icon flash NAND PCIE device. Use this professional diagram in presentations related to storage devices and terms. Special effects of this diagram will surely interest the audience.

Business Diagram Big Data Written In Brain Made Of Pcb Board Ppt Slide
To define the concept of human intelligence and data technology we have designed an exclusive diagram. This slide contains the graphic of human brain and text of big data with PCB board graphics. Use this slide to build an innovative presentation for your viewers.
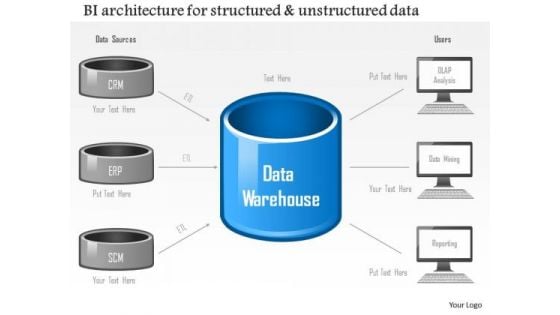
Business Diagram Business Intelligence Architecture For Structured And Unstructured Data Ppt Slide
Graphic of servers and data base has been used to design this technology diagram. It depicts data sources like CRM, ERP, and SCM on side and Users like OLAP analysis, data mining and reporting on other side. Use this diagram to build professional presentation.
Business Diagram Sources And Use Cases Of Big Data Shown By Cloud Icons Ppt Slide
This technology diagram has been designed with graphic of clouds. This slide depicts the concept of cloud technology and data storage. These clouds also display the big data sources and icons. This diagram slide is suitable for cloud computing related presentations.
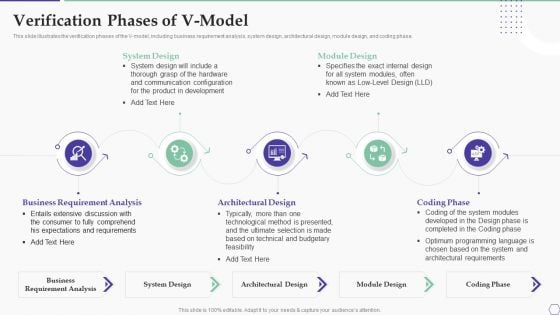
Solution Development Process Verification Phases Of V Model Topics PDF
This slide illustrates the verification phases of the V-model, including business requirement analysis, system design, architectural design, module design, and coding phase.Presenting Solution Development Process Verification Phases Of V Model Topics PDF to provide visual cues and insights. Share and navigate important information on five stages that need your due attention. This template can be used to pitch topics like Communication Configuration, Product Development, Expectations Requirements. In addtion, this PPT design contains high resolution images, graphics, etc, that are easily editable and available for immediate download.
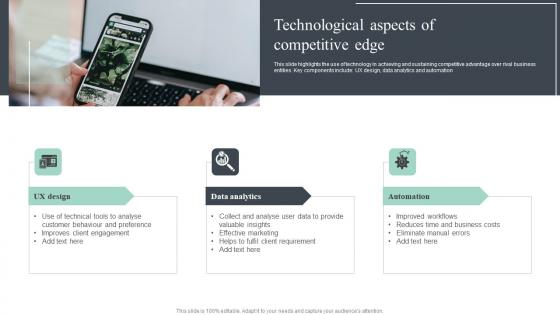
Technological Aspects Of Competitive Edge Guidelines Pdf
This slide highlights the use of technology in achieving and sustaining competitive advantage over rival business entities. Key components include UX design, data analytics and automation Showcasing this set of slides titled Technological Aspects Of Competitive Edge Guidelines Pdf. The topics addressed in these templates are UX Design, Data Analytics, Automation. All the content presented in this PPT design is completely editable. Download it and make adjustments in color, background, font etc. as per your unique business setting. This slide highlights the use of technology in achieving and sustaining competitive advantage over rival business entities. Key components include UX design, data analytics and automation
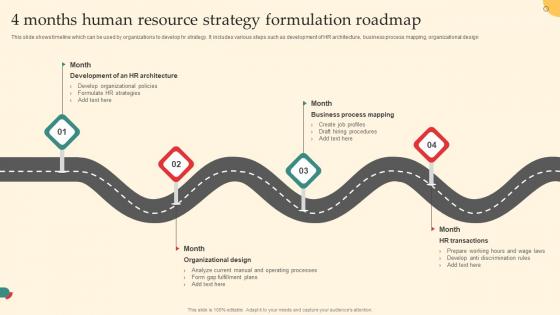
4 Months Human Resource Strategy Formulation Roadmap Microsoft Pdf
This slide shows timeline which can be used by organizations to develop hr strategy. It includes various steps such as development of HR architecture,business process mapping,organizational design Showcasing this set of slides titled 4 Months Human Resource Strategy Formulation Roadmap Microsoft Pdf. The topics addressed in these templates are Architecture,Organizational Design,Process Mapping. All the content presented in this PPT design is completely editable. Download it and make adjustments in color,background,font etc. as per your unique business setting. This slide shows timeline which can be used by organizations to develop hr strategy. It includes various steps such as development of HR architecture,business process mapping,organizational design

Developing Digital Supply Chain Networks Optimizing Retail Operations With Digital DT SS V
This slide presents a framework to optimize supply chain with technology optimization to develop a digital supply network. It includes features such as synchronized planning, connected customer and aftermarket, smart factory, intelligent supply, digital product development and dynamic fulfilment.Coming up with a presentation necessitates that the majority of the effort goes into the content and the message you intend to convey. The visuals of a PowerPoint presentation can only be effective if it supplements and supports the story that is being told. Keeping this in mind our experts created Developing Digital Supply Chain Networks Optimizing Retail Operations With Digital DT SS V to reduce the time that goes into designing the presentation. This way, you can concentrate on the message while our designers take care of providing you with the right template for the situation. This slide presents a framework to optimize supply chain with technology optimization to develop a digital supply network. It includes features such as synchronized planning, connected customer and aftermarket, smart factory, intelligent supply, digital product development and dynamic fulfilment.
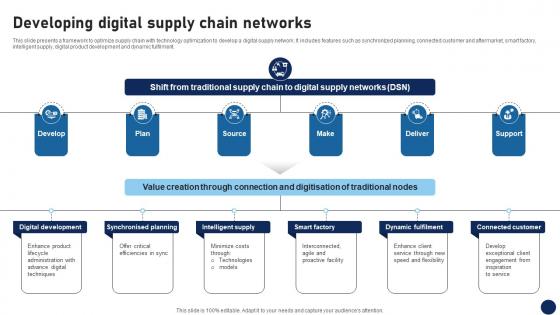
Developing Digital Supply Chain Networks DT SS V
This slide presents a framework to optimize supply chain with technology optimization to develop a digital supply network. It includes features such as synchronized planning, connected customer and aftermarket, smart factory, intelligent supply, digital product development and dynamic fulfilment.Coming up with a presentation necessitates that the majority of the effort goes into the content and the message you intend to convey. The visuals of a PowerPoint presentation can only be effective if it supplements and supports the story that is being told. Keeping this in mind our experts created Developing Digital Supply Chain Networks DT SS V to reduce the time that goes into designing the presentation. This way, you can concentrate on the message while our designers take care of providing you with the right template for the situation. This slide presents a framework to optimize supply chain with technology optimization to develop a digital supply network. It includes features such as synchronized planning, connected customer and aftermarket, smart factory, intelligent supply, digital product development and dynamic fulfilment.
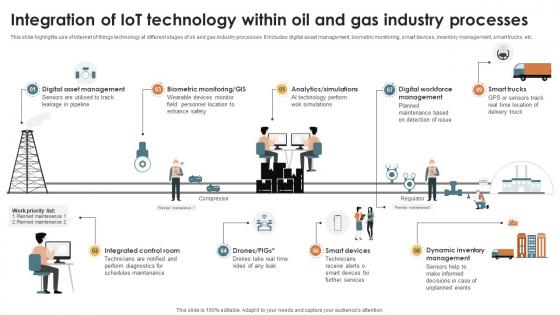
IoT Solutions For Oil Integration Of IoT Technology Within Oil And Gas Industry IoT SS V
This slide highlights use of internet of things technology at different stages of oil and gas industry processes. It includes digital asset management, biometric monitoring, smart devices, inventory management, smart trucks, etc. If you are looking for a format to display your unique thoughts, then the professionally designed IoT Solutions For Oil Integration Of IoT Technology Within Oil And Gas Industry IoT SS V is the one for you. You can use it as a Google Slides template or a PowerPoint template. Incorporate impressive visuals, symbols, images, and other charts. Modify or reorganize the text boxes as you desire. Experiment with shade schemes and font pairings. Alter, share or cooperate with other people on your work. Download IoT Solutions For Oil Integration Of IoT Technology Within Oil And Gas Industry IoT SS V and find out how to give a successful presentation. Present a perfect display to your team and make your presentation unforgettable. This slide highlights use of internet of things technology at different stages of oil and gas industry processes. It includes digital asset management, biometric monitoring, smart devices, inventory management, smart trucks, etc.
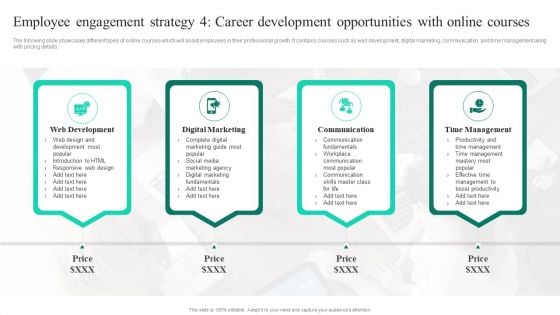
Adopting Flexible Work Policy Employee Engagement Strategy 4 Career Development Brochure PDF
The following slide showcases different types of online courses which will assist employees in their professional growth. It contains courses such as web development, digital marketing, communication, and time management along with pricing details. If you are looking for a format to display your unique thoughts, then the professionally designed Adopting Flexible Work Policy Employee Engagement Strategy 4 Career Development Brochure PDF is the one for you. You can use it as a Google Slides template or a PowerPoint template. Incorporate impressive visuals, symbols, images, and other charts. Modify or reorganize the text boxes as you desire. Experiment with shade schemes and font pairings. Alter, share or cooperate with other people on your work. Download Adopting Flexible Work Policy Employee Engagement Strategy 4 Career Development Brochure PDF and find out how to give a successful presentation. Present a perfect display to your team and make your presentation unforgettable.
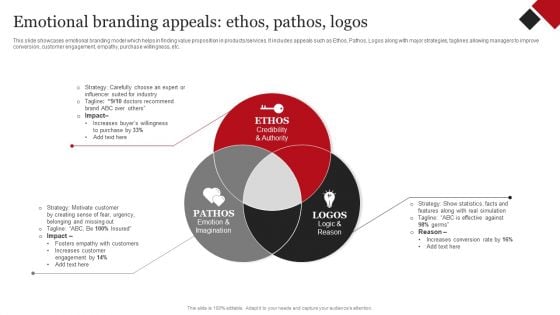
Coca Cola Emotional Marketing Strategy Emotional Branding Appeals Ethos Pathos Logos Elements PDF
This slide showcases emotional branding model which helps in finding value proposition in products OR services. It includes appeals such as Ethos, Pathos, Logos along with major strategies, taglines allowing managers to improve conversion, customer engagement, empathy, purchase willingness, etc. If you are looking for a format to display your unique thoughts, then the professionally designed Coca Cola Emotional Marketing Strategy Emotional Branding Appeals Ethos Pathos Logos Elements PDF is the one for you. You can use it as a Google Slides template or a PowerPoint template. Incorporate impressive visuals, symbols, images, and other charts. Modify or reorganize the text boxes as you desire. Experiment with shade schemes and font pairings. Alter, share or cooperate with other people on your work. Download Coca Cola Emotional Marketing Strategy Emotional Branding Appeals Ethos Pathos Logos Elements PDF and find out how to give a successful presentation. Present a perfect display to your team and make your presentation unforgettable.
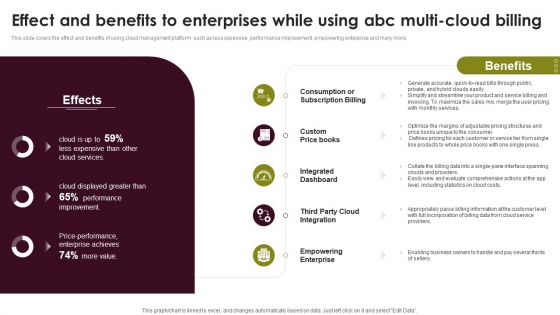
Cloud Computing Scalability Effect And Benefits To Enterprises While Using ABC Multi Portrait PDF
This slide covers the effect and benefits of using cloud management platform such as less expensive, performance improvement, empowering enterprise and many more. If you are looking for a format to display your unique thoughts, then the professionally designed Cloud Computing Scalability Effect And Benefits To Enterprises While Using ABC Multi Portrait PDF is the one for you. You can use it as a Google Slides template or a PowerPoint template. Incorporate impressive visuals, symbols, images, and other charts. Modify or reorganize the text boxes as you desire. Experiment with shade schemes and font pairings. Alter, share or cooperate with other people on your work. Download Cloud Computing Scalability Effect And Benefits To Enterprises While Using ABC Multi Portrait PDF and find out how to give a successful presentation. Present a perfect display to your team and make your presentation unforgettable.
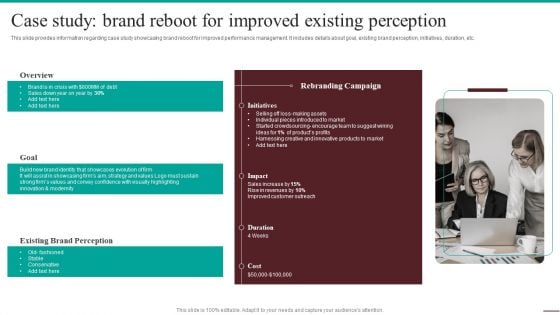
Guide For Systematic Case Study Brand Reboot For Improved Existing Perception Themes PDF
This slide provides information regarding case study showcasing brand reboot for improved performance management. It includes details about goal, existing brand perception, initiatives, duration, etc. If you are looking for a format to display your unique thoughts, then the professionally designed Guide For Systematic Case Study Brand Reboot For Improved Existing Perception Themes PDF is the one for you. You can use it as a Google Slides template or a PowerPoint template. Incorporate impressive visuals, symbols, images, and other charts. Modify or reorganize the text boxes as you desire. Experiment with shade schemes and font pairings. Alter, share or cooperate with other people on your work. Download Guide For Systematic Case Study Brand Reboot For Improved Existing Perception Themes PDF and find out how to give a successful presentation. Present a perfect display to your team and make your presentation unforgettable.
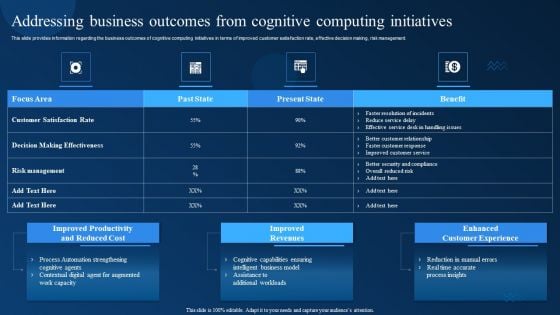
Addressing Business Outcomes From Cognitive Computing Initiatives Topics PDF
This slide provides information regarding the business outcomes of cognitive computing initiatives in terms of improved customer satisfaction rate, effective decision making, risk management. If you are looking for a format to display your unique thoughts, then the professionally designed Addressing Business Outcomes From Cognitive Computing Initiatives Topics PDF is the one for you. You can use it as a Google Slides template or a PowerPoint template. Incorporate impressive visuals, symbols, images, and other charts. Modify or reorganize the text boxes as you desire. Experiment with shade schemes and font pairings. Alter, share or cooperate with other people on your work. Download Addressing Business Outcomes From Cognitive Computing Initiatives Topics PDF and find out how to give a successful presentation. Present a perfect display to your team and make your presentation unforgettable.
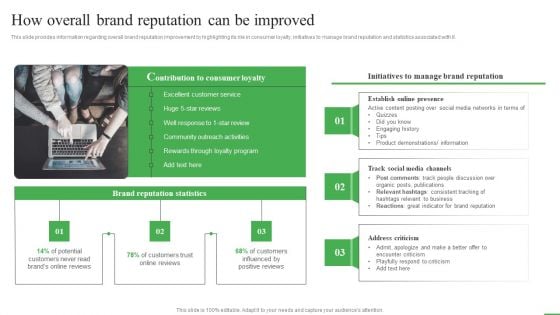
How To Boost Brand Recognition How Overall Brand Reputation Can Be Improved Guidelines PDF
This slide provides information regarding overall brand reputation improvement by highlighting its rile in consumer loyalty, initiatives to manage brand reputation and statistics associated with it. If you are looking for a format to display your unique thoughts, then the professionally designed How To Boost Brand Recognition How Overall Brand Reputation Can Be Improved Guidelines PDF is the one for you. You can use it as a Google Slides template or a PowerPoint template. Incorporate impressive visuals, symbols, images, and other charts. Modify or reorganize the text boxes as you desire. Experiment with shade schemes and font pairings. Alter, share or cooperate with other people on your work. Download How To Boost Brand Recognition How Overall Brand Reputation Can Be Improved Guidelines PDF and find out how to give a successful presentation. Present a perfect display to your team and make your presentation unforgettable.
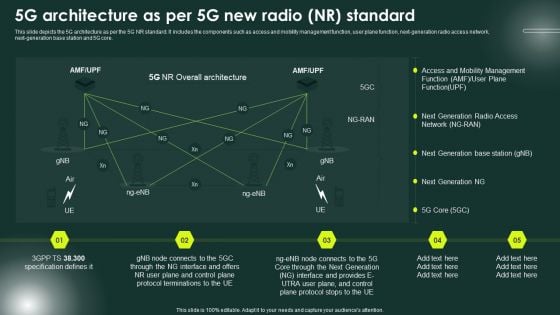
5G Network Applications And Features 5G Architecture As Per 5G New Radio NR Standard Professional PDF
This slide depicts the 5G architecture as per the 5G NR standard. It includes the components such as access and mobility management function, user plane function, next-generation radio access network, next-generation base station and 5G core. If you are looking for a format to display your unique thoughts, then the professionally designed 5G Network Applications And Features 5G Architecture As Per 5G New Radio NR Standard Professional PDF is the one for you. You can use it as a Google Slides template or a PowerPoint template. Incorporate impressive visuals, symbols, images, and other charts. Modify or reorganize the text boxes as you desire. Experiment with shade schemes and font pairings. Alter, share or cooperate with other people on your work. Download 5G Network Applications And Features 5G Architecture As Per 5G New Radio NR Standard Professional PDF and find out how to give a successful presentation. Present a perfect display to your team and make your presentation unforgettable.
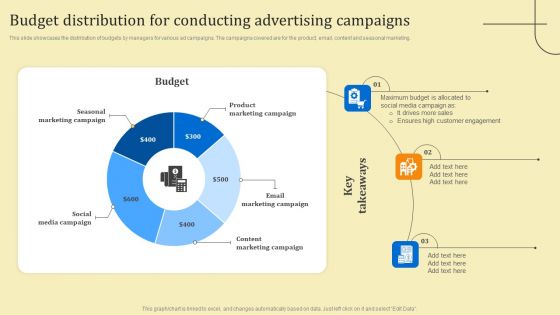
Business Sales Optimization Advertisement Campaign Budget Distribution For Conducting Advertising Campaigns Clipart PDF
This slide showcases the distribution of budgets by managers for various ad campaigns. The campaigns covered are for the product, email, content and seasonal marketing. If you are looking for a format to display your unique thoughts, then the professionally designed Business Sales Optimization Advertisement Campaign Budget Distribution For Conducting Advertising Campaigns Clipart PDF is the one for you. You can use it as a Google Slides template or a PowerPoint template. Incorporate impressive visuals, symbols, images, and other charts. Modify or reorganize the text boxes as you desire. Experiment with shade schemes and font pairings. Alter, share or cooperate with other people on your work. Download Business Sales Optimization Advertisement Campaign Budget Distribution For Conducting Advertising Campaigns Clipart PDF and find out how to give a successful presentation. Present a perfect display to your team and make your presentation unforgettable.

Operational Risk Incidents Forecast Post BPM Implementation Mockup PDF
This slide covers decrease in operational threats after deploying business process management system in an organisation. It includes risks involving clients and business practices, external and internal frauds, etc. If you are looking for a format to display your unique thoughts, then the professionally designed Operational Risk Incidents Forecast Post BPM Implementation Mockup PDF is the one for you. You can use it as a Google Slides template or a PowerPoint template. Incorporate impressive visuals, symbols, images, and other charts. Modify or reorganize the text boxes as you desire. Experiment with shade schemes and font pairings. Alter, share or cooperate with other people on your work. Download Operational Risk Incidents Forecast Post BPM Implementation Mockup PDF and find out how to give a successful presentation. Present a perfect display to your team and make your presentation unforgettable.
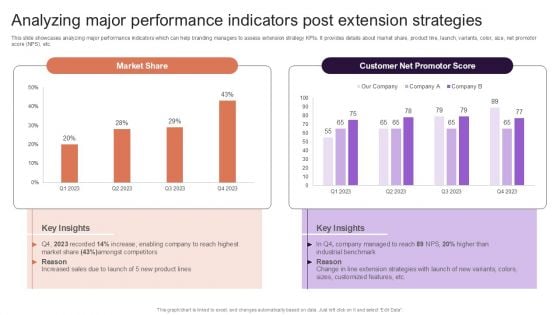
Implementing Brand Extension Initiatives For Apple Company Analyzing Major Performance Indicators Post Extension Topics PDF
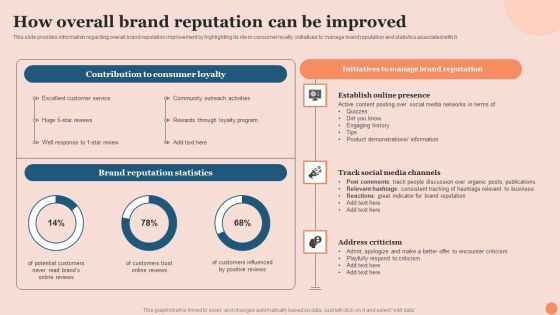
Techniques To Elevate Brand Visibility How Overall Brand Reputation Can Be Improved Rules PDF
This slide provides information regarding overall brand reputation improvement by highlighting its rile in consumer loyalty, initiatives to manage brand reputation and statistics associated with it. If you are looking for a format to display your unique thoughts, then the professionally designed Techniques To Elevate Brand Visibility How Overall Brand Reputation Can Be Improved Rules PDF is the one for you. You can use it as a Google Slides template or a PowerPoint template. Incorporate impressive visuals, symbols, images, and other charts. Modify or reorganize the text boxes as you desire. Experiment with shade schemes and font pairings. Alter, share or cooperate with other people on your work. Download Techniques To Elevate Brand Visibility How Overall Brand Reputation Can Be Improved Rules PDF and find out how to give a successful presentation. Present a perfect display to your team and make your presentation unforgettable.
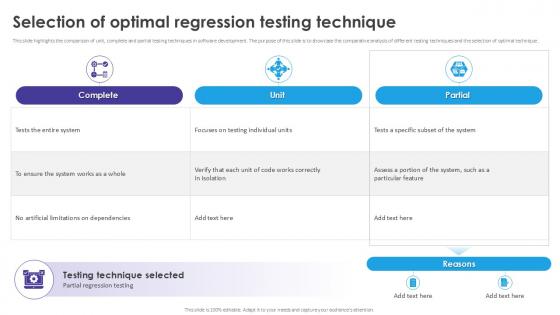
Selection Of Optimal Regression Automated Regression Testing And Achieving PPT Slide
This slide highlights the comparison of unit, complete and partial testing techniques in software development. The purpose of this slide is to showcase the comparative analysis of different testing techniques and the selection of optimal technique . Explore a selection of the finest Selection Of Optimal Regression Automated Regression Testing And Achieving PPT Slide here. With a plethora of professionally designed and pre-made slide templates, you can quickly and easily find the right one for your upcoming presentation. You can use our Selection Of Optimal Regression Automated Regression Testing And Achieving PPT Slide to effectively convey your message to a wider audience. Slidegeeks has done a lot of research before preparing these presentation templates. The content can be personalized and the slides are highly editable. Grab templates today from Slidegeeks. This slide highlights the comparison of unit, complete and partial testing techniques in software development. The purpose of this slide is to showcase the comparative analysis of different testing techniques and the selection of optimal technique .
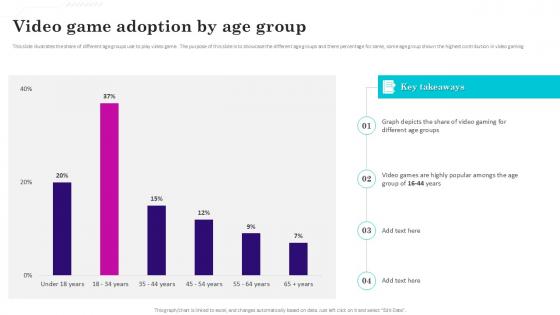
Video Game Adoption Gaming Venture Investment Elevator Pitch Deck Ppt Example
This slide illustrates the share of different age groups use to play video game. The purpose of this slide is to showcase the different age groups and there percentage for same, some age group shown the highest contribution in video gaming Explore a selection of the finest Video Game Adoption Gaming Venture Investment Elevator Pitch Deck Ppt Example here. With a plethora of professionally designed and pre-made slide templates, you can quickly and easily find the right one for your upcoming presentation. You can use our Video Game Adoption Gaming Venture Investment Elevator Pitch Deck Ppt Example to effectively convey your message to a wider audience. Slidegeeks has done a lot of research before preparing these presentation templates. The content can be personalized and the slides are highly editable. Grab templates today from Slidegeeks. This slide illustrates the share of different age groups use to play video game. The purpose of this slide is to showcase the different age groups and there percentage for same, some age group shown the highest contribution in video gaming
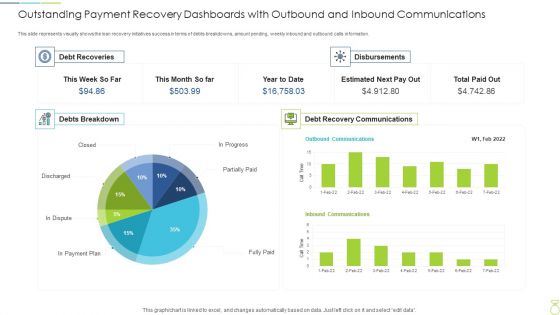
Outstanding Payment Recovery Dashboards With Outbound And Inbound Communications Graphics PDF
This slide represents visually shows the loan recovery initiatives success in terms of debts breakdowns, amount pending, weekly inbound and outbound calls information. Pitch your topic with ease and precision using this outstanding payment recovery dashboards with outbound and inbound communications graphics pdf. This layout presents information on outstanding payment recovery dashboards with outbound and inbound communications. It is also available for immediate download and adjustment. So, changes can be made in the color, design, graphics or any other component to create a unique layout.

KPI Dashboard To Measurement Brand Equity Microsoft PDF
Mentioned slide highlights multiple metrics which can be used by marketer to measure the brand value. The metrics mentioned in the dashboard are total sales, customer lifetime value, customer adoption rate, customer acquisition cost etc. Pitch your topic with ease and precision using this kpi dashboard to measurement brand equity microsoft pdf. This layout presents information on kpi dashboard to measurement brand equity. It is also available for immediate download and adjustment. So, changes can be made in the color, design, graphics or any other component to create a unique layout.
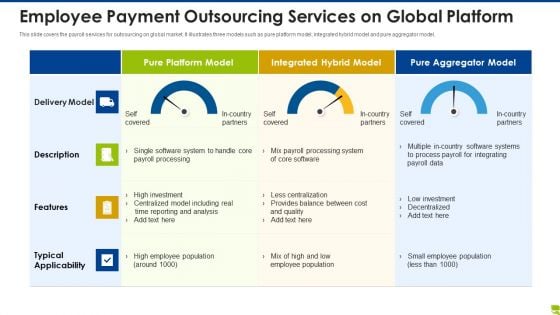
Employee Payment Outsourcing Services On Global Platform Inspiration PDF
This slide covers the payroll services for outsourcing on global market. It illustrates three models such as pure platform model, integrated hybrid model and pure aggregator model. Pitch your topic with ease and precision using this employee payment outsourcing services on global platform inspiration pdf. This layout presents information on employee payment outsourcing services on global platform. It is also available for immediate download and adjustment. So, changes can be made in the color, design, graphics or any other component to create a unique layout.
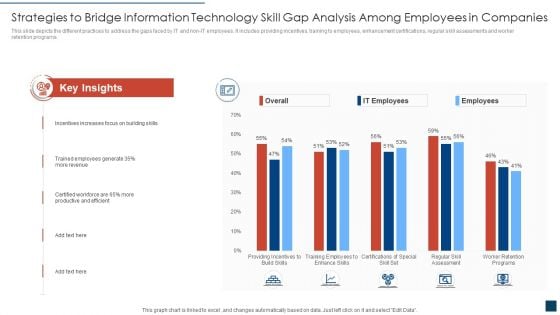
Strategies To Bridge Information Technology Skill Gap Analysis Among Employees In Companies Formats PDF
This slide depicts the different practices to address the gaps faced by IT and non-IT employees. It includes providing incentives, training to employees, enhancement certifications, regular skill assessments and worker retention programs. Pitch your topic with ease and precision using this strategies to bridge information technology skill gap analysis among employees in companies formats pdf. This layout presents information on strategies to bridge information technology skill gap analysis among employees in companies. It is also available for immediate download and adjustment. So, changes can be made in the color, design, graphics or any other component to create a unique layout.
Company Turnover Financial Ratios Chart Comparison Icons PDF
This slide illustrates graph for turnover ratios that are accounts receivable, inventory turnover, accounts payable turnover, fixed asset turnover and total assets turnover ratio. It showcases comparison of three companies. Pitch your topic with ease and precision using this company turnover financial ratios chart comparison icons pdf. This layout presents information on company turnover financial ratios chart comparison. It is also available for immediate download and adjustment. So, changes can be made in the color, design, graphics or any other component to create a unique layout.
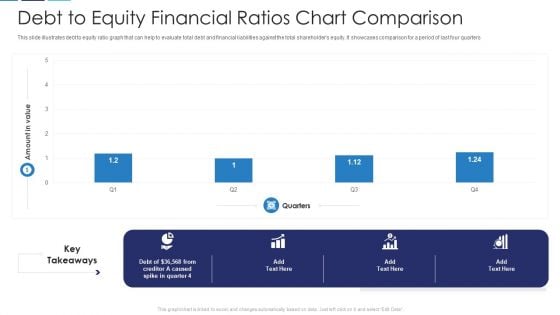
Debt To Equity Financial Ratios Chart Comparison Download PDF
This slide illustrates debt to equity ratio graph that can help to evaluate total debt and financial liabilities against the total shareholders equity. It showcases comparison for a period of last four quarters Pitch your topic with ease and precision using this debt to equity financial ratios chart comparison download pdf. This layout presents information on debt to equity financial ratios chart comparison. It is also available for immediate download and adjustment. So, changes can be made in the color, design, graphics or any other component to create a unique layout.
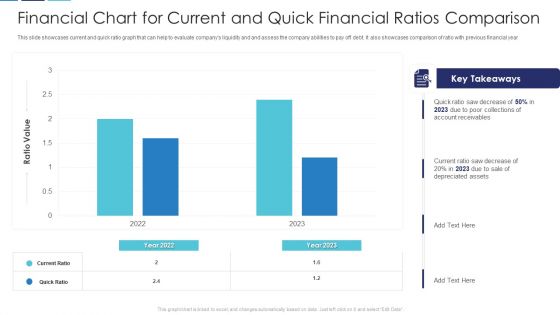
Financial Chart For Current And Quick Financial Ratios Comparison Brochure PDF
This slide showcases current and quick ratio graph that can help to evaluate companys liquidity and and assess the company abilities to pay off debt. It also showcases comparison of ratio with previous financial year Pitch your topic with ease and precision using this financial chart for current and quick financial ratios comparison brochure pdf. This layout presents information on financial chart for current and quick financial ratios comparison. It is also available for immediate download and adjustment. So, changes can be made in the color, design, graphics or any other component to create a unique layout.
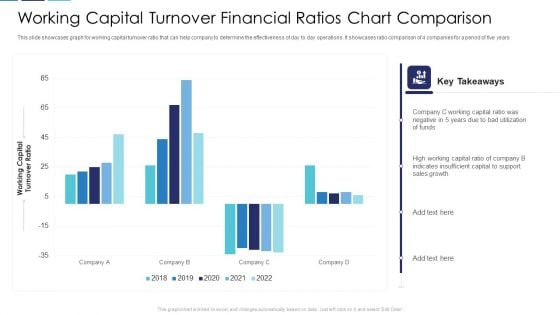
Working Capital Turnover Financial Ratios Chart Comparison Clipart PDF
This slide showcases graph for working capital turnover ratio that can help company to determine the effectiveness of day to day operations. It showcases ratio comparison of 4 companies for a period of five years Pitch your topic with ease and precision using this working capital turnover financial ratios chart comparison clipart pdf. This layout presents information on working capital turnover financial ratios chart comparison. It is also available for immediate download and adjustment. So, changes can be made in the color, design, graphics or any other component to create a unique layout.
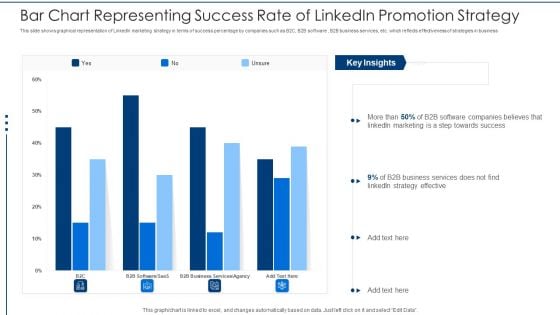
Bar Chart Representing Success Rate Of Linkedin Promotion Strategy Rules PDF
This slide shows graphical representation of LinkedIn marketing strategy in terms of success percentage by companies such as B2C, B2B software , B2B business services, etc. which reflects effectiveness of strategies in business Pitch your topic with ease and precision using this bar chart representing success rate of linkedin promotion strategy rules pdf. This layout presents information on bar chart representing success rate of linkedin promotion strategy. It is also available for immediate download and adjustment. So, changes can be made in the color, design, graphics or any other component to create a unique layout.
Application Sources For Recruitment On Social Media Tracking Dashboard Microsoft PDF
This slide covers the dashboard for tracking the count of applicants profiles from various sources. It includes the open positions, new roles, total roles, candidates placed , application sources, client decline rates and commission received. Pitch your topic with ease and precision using this application sources for recruitment on social media tracking dashboard microsoft pdf. This layout presents information on application sources for recruitment on social media tracking dashboard. It is also available for immediate download and adjustment. So, changes can be made in the color, design, graphics or any other component to create a unique layout.
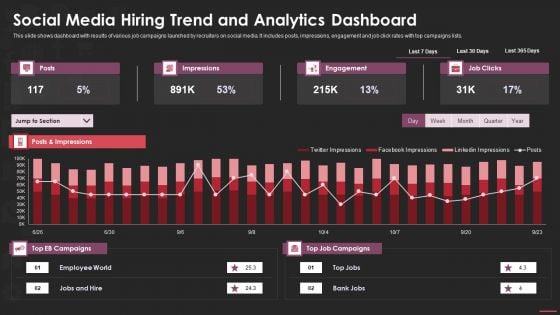
Social Media Hiring Trend And Analytics Dashboard Microsoft PDF
This slide shows dashboard with results of various job campaigns launched by recruiters on social media. It includes posts, impressions, engagement and job click rates with top campaigns lists. Pitch your topic with ease and precision using this social media hiring trend and analytics dashboard microsoft pdf. This layout presents information on social media hiring trend and analytics dashboard. It is also available for immediate download and adjustment. So, changes can be made in the color, design, graphics or any other component to create a unique layout.
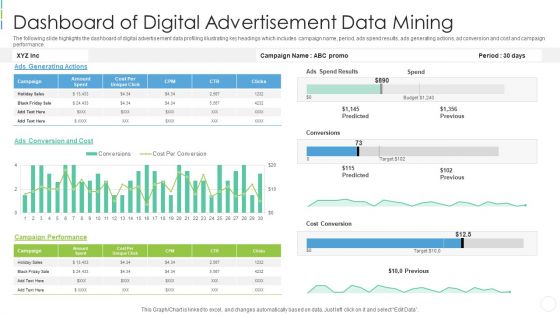
Dashboard Of Digital Advertisement Data Mining Professional PDF
The following slide highlights the dashboard of digital advertisement data profiling illustrating key headings which includes campaign name, period, ads spend results, ads generating actions, ad conversion and cost and campaign performance. Pitch your topic with ease and precision using this dashboard of digital advertisement data mining professional pdf . This layout presents information on dashboard of digital advertisement data mining . It is also available for immediate download and adjustment. So, changes can be made in the color, design, graphics or any other component to create a unique layout.
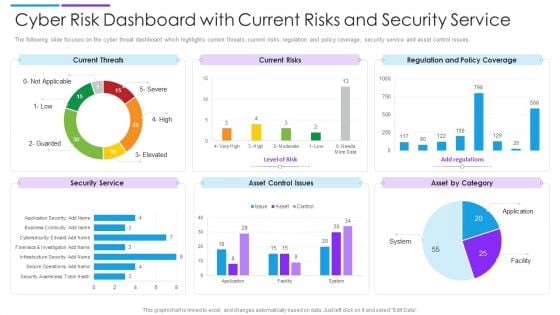
Cyber Risk Dashboard With Current Risks And Security Service Formats PDF
The following slide focuses on the cyber threat dashboard which highlights current threats, current risks, regulation and policy coverage, security service and asset control issues. Pitch your topic with ease and precision using this cyber risk dashboard with current risks and security service formats pdf. This layout presents information on current threats, current risks, regulation and policy coverage. It is also available for immediate download and adjustment. So, changes can be made in the color, design, graphics or any other component to create a unique layout.
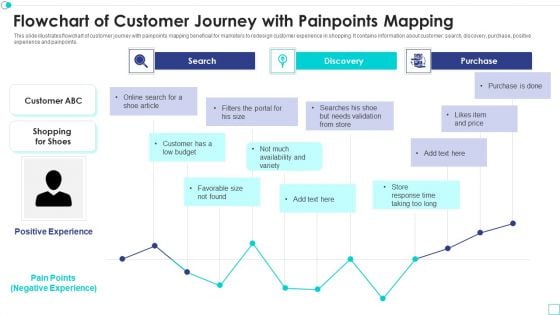
Flowchart Of Customer Journey With Painpoints Mapping Download PDF
This slide illustrates flowchart of customer journey with painpoints mapping beneficial for marketers to redesign customer experience in shopping. It contains information about customer, search, discovery, purchase, positive experience and painpoints. Pitch your topic with ease and precision using this flowchart of customer journey with painpoints mapping download pdf. This layout presents information on flowchart of customer journey with painpoints mapping. It is also available for immediate download and adjustment. So, changes can be made in the color, design, graphics or any other component to create a unique layout.
Working Table For 7 S Variance Analysis Techniques And Models Icons PDF
This slide covers the working table for McKinsey 7 S technique for gap analysis. It covers the sections for all 7 functions involved in the 7 S model to evaluate gaps in strategy, structure, systems, style, skills, staff, and shared values. Pitch your topic with ease and precision using this working table for 7 s variance analysis techniques and models icons pdf. This layout presents information on strategy, structure, shared values. It is also available for immediate download and adjustment. So, changes can be made in the color, design, graphics or any other component to create a unique layout.
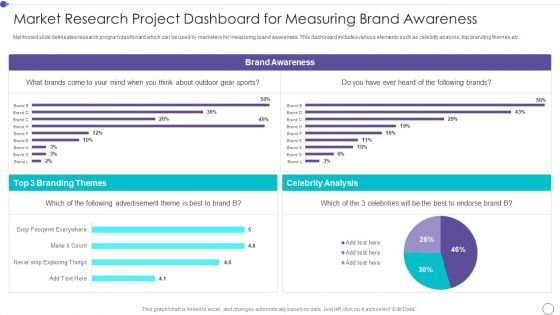
Market Research Project Dashboard For Measuring Brand Awareness Rules PDF
Mentioned slide delineates research program dashboard which can be used by marketers for measuring brand awareness. This dashboard includes various elements such as celebrity analysis, top branding themes etc. Pitch your topic with ease and precision using this market research project dashboard for measuring brand awareness rules pdf. This layout presents information on brand awareness, celebrity analysis, advertisement. It is also available for immediate download and adjustment. So, changes can be made in the color, design, graphics or any other component to create a unique layout.
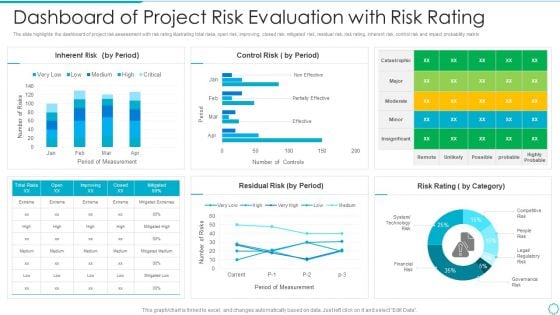
Dashboard Of Project Risk Evaluation With Risk Rating Pictures PDF
The slide highlights the dashboard of project risk assessment with risk rating illustrating total risks, open risk, improving, closed risk, mitigated risk, residual risk, risk rating, inherent risk, control risk and impact probability matrixPitch your topic with ease and precision using this dashboard of project risk evaluation with risk rating pictures pdf This layout presents information on dashboard of project risk evaluation with risk rating It is also available for immediate download and adjustment. So, changes can be made in the color, design, graphics or any other component to create a unique layout.
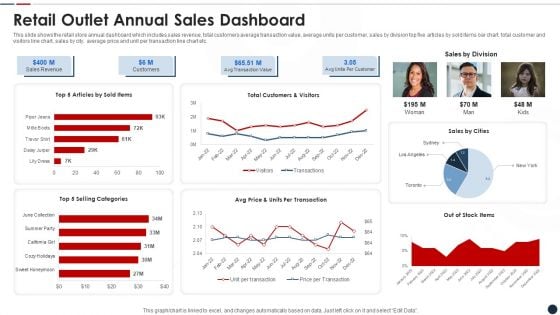
Retail Outlet Annual Sales Dashboard Elements PDF
This slide shows the retail store annual dashboard which includes sales revenue, total customers average transaction value, average units per customer, sales by division top five articles by sold items bar chart, total customer and visitors line chart, sales by city, average price and unit per transaction line chart etc.Pitch your topic with ease and precision using this retail outlet annual sales dashboard elements pdf This layout presents information on Retail outlet annual sales dashboard It is also available for immediate download and adjustment. So, changes can be made in the color, design, graphics or any other component to create a unique layout.
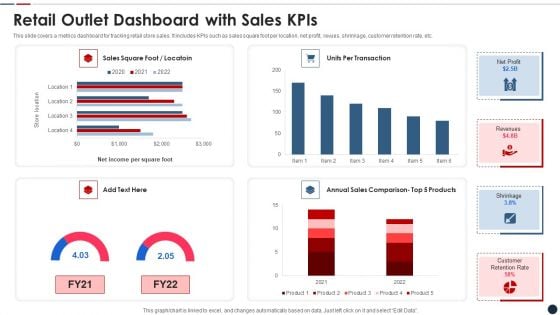
Retail Outlet Dashboard With Sales Kpis Clipart PDF
This slide covers a metrics dashboard for tracking retail store sales. It includes KPIs such as sales square foot per location, net profit, revues, shrinkage, customer retention rate, etc. Pitch your topic with ease and precision using this retail outlet dashboard with sales kpis clipart pdf This layout presents information on Retail outlet dashboard with sales kpis It is also available for immediate download and adjustment. So, changes can be made in the color, design, graphics or any other component to create a unique layout.
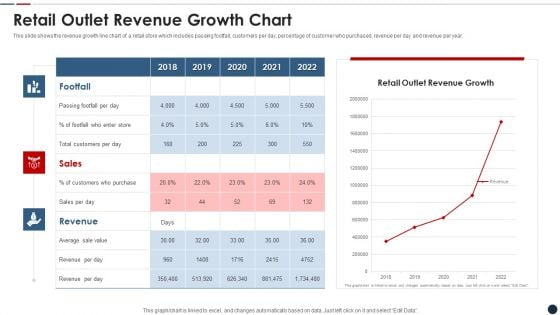
Retail Outlet Revenue Growth Chart Mockup PDF
This slide shows the revenue growth line chart of a retail store which includes passing footfall, customers per day, percentage of customer who purchased, revenue per day and revenue per year. Pitch your topic with ease and precision using this retail outlet revenue growth chart mockup pdf This layout presents information on Retail outlet revenue growth chart It is also available for immediate download and adjustment. So, changes can be made in the color, design, graphics or any other component to create a unique layout.
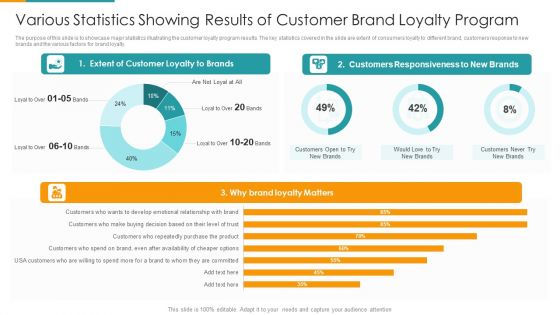
Various Statistics Showing Results Of Customer Brand Loyalty Program Background PDF
The purpose of this slide is to showcase major statistics illustrating the customer loyalty program results. The key statistics covered in the slide are extent of consumers loyalty to different brand, customers response to new brands and the various factors for brand loyalty. Pitch your topic with ease and precision using this various statistics showing results of customer brand loyalty program background pdf. This layout presents information on extent of customer loyalty to brands, customers responsiveness to new brands, brand loyalty matters. It is also available for immediate download and adjustment. So, changes can be made in the color, design, graphics or any other component to create a unique layout.
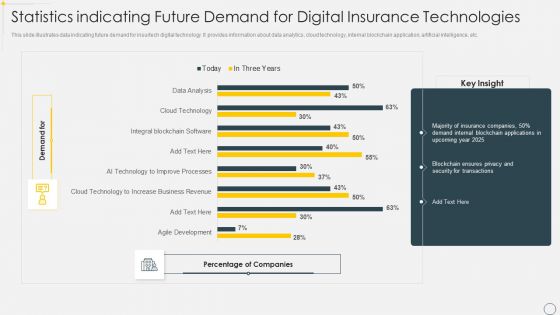
Statistics Indicating Future Demand For Digital Insurance Technologies Brochure PDF
This slide illustrates data indicating future demand for insurtech digital technology. It provides information about data analytics, cloud technology, internal blockchain application, artificial intelligence, etc. Pitch your topic with ease and precision using this Statistics Indicating Future Demand For Digital Insurance Technologies Brochure PDF. This layout presents information on Data Analytics, Cloud Technology, Internal Blockchain Application. It is also available for immediate download and adjustment. So, changes can be made in the color, design, graphics or any other component to create a unique layout.
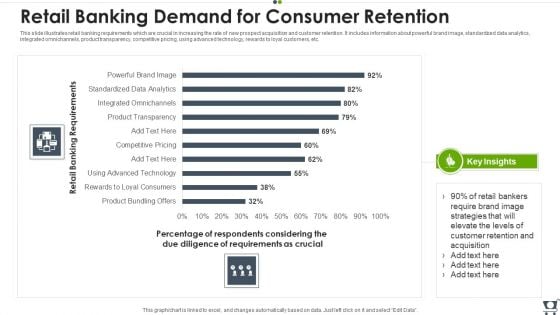
Retail Banking Demand For Consumer Retention Themes PDF
This slide illustrates retail banking requirements which are crucial in increasing the rate of new prospect acquisition and customer retention. It includes information about powerful brand image, standardized data analytics, integrated omnichannels, product transparency, competitive pricing, using advanced technology, rewards to loyal customers, etc. Pitch your topic with ease and precision using this Retail Banking Demand For Consumer Retention Themes PDF. This layout presents information on Require, Strategies, Retail. It is also available for immediate download and adjustment. So, changes can be made in the color, design, graphics or any other component to create a unique layout.
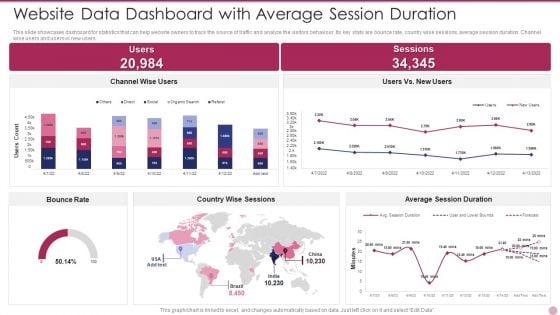
Website Data Dashboard With Average Session Duration Ideas PDF
This slide showcases dashboard for statistics that can help website owners to track the source of traffic and analyze the visitors behaviour. Its key stats are bounce rate, country wise sessions, average session duration. Channel wise users and users vs new users. Pitch your topic with ease and precision using this Website Data Dashboard With Average Session Duration Ideas PDF. This layout presents information on Website Data Dashboard With Average Session Duration. It is also available for immediate download and adjustment. So, changes can be made in the color, design, graphics or any other component to create a unique layout.
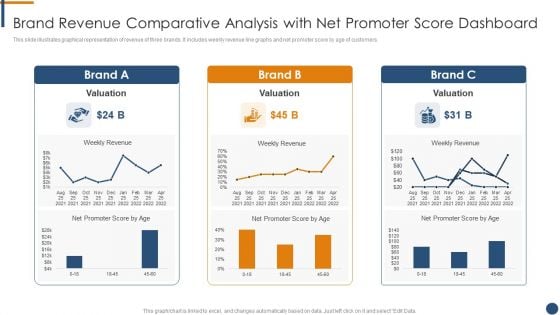
Brand Revenue Comparative Analysis With Net Promoter Score Dashboard Mockup PDF
This slide illustrates graphical representation of revenue of three brands. It includes weekly revenue line graphs and net promoter score by age of customers.Pitch your topic with ease and precision using this Brand Revenue Comparative Analysis With Net Promoter Score Dashboard Mockup PDF. This layout presents information on Brand Revenue Comparative Analysis With Net Promoter Score Dashboard. It is also available for immediate download and adjustment. So, changes can be made in the color, design, graphics or any other component to create a unique layout.
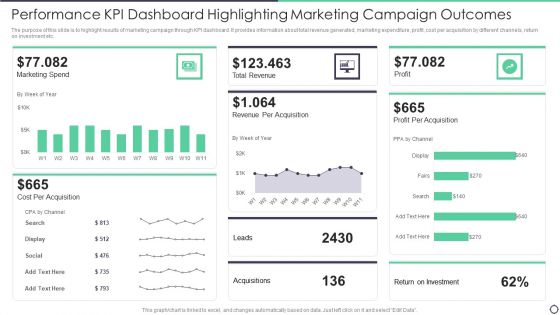
Performance Kpi Dashboard Highlighting Marketing Campaign Outcomes Topics PDF
The purpose of this slide is to highlight results of marketing campaign through KPI dashboard. It provides information about total revenue generated, marketing expenditure, profit, cost per acquisition by different channels, return on investment etc. Pitch your topic with ease and precision using this Performance Kpi Dashboard Highlighting Marketing Campaign Outcomes Topics PDF. This layout presents information on Cost, Marketing, Revenue. It is also available for immediate download and adjustment. So, changes can be made in the color, design, graphics or any other component to create a unique layout.
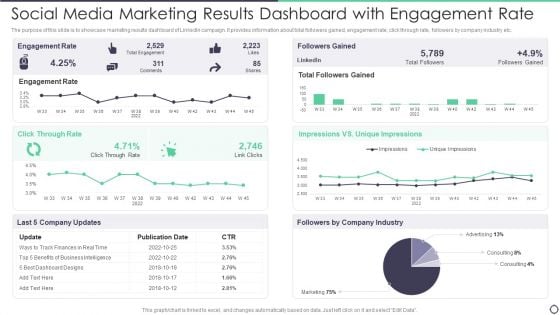
Social Media Marketing Results Dashboard With Engagement Rate Brochure PDF
The purpose of this slide is to showcase marketing results dashboard of LinkedIn campaign. It provides information about total followers gained, engagement rate, click through rate, followers by company industry etc. Pitch your topic with ease and precision using this Social Media Marketing Results Dashboard With Engagement Rate Brochure PDF. This layout presents information on Social Media Marketing Results Dashboard With Engagement Rate. It is also available for immediate download and adjustment. So, changes can be made in the color, design, graphics or any other component to create a unique layout.
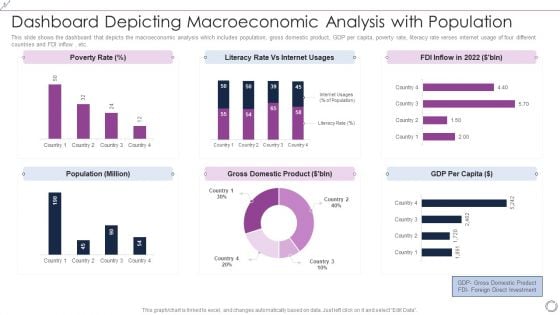
Dashboard Depicting Macroeconomic Analysis With Population Inspiration PDF
This slide shows the dashboard that depicts the macroeconomic analysis which includes population, gross domestic product, GDP per capita, poverty rate, literacy rate verses internet usage of four different countries and FDI inflow, etc. Pitch your topic with ease and precision using this Dashboard Depicting Macroeconomic Analysis With Population Inspiration PDF. This layout presents information on Poverty Rate, Literacy Rate Vs Internet Usages, FDI Inflow In 2022. It is also available for immediate download and adjustment. So, changes can be made in the color, design, graphics or any other component to create a unique layout.


 Continue with Email

 Home
Home


