financial analysis
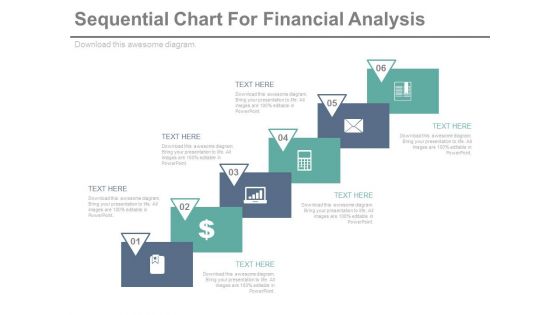
Sequential Steps Chart For Data Analysis Powerpoint Slides
This PowerPoint template has been designed sequential steps chart with icons. This PPT slide can be used to display corporate level financial strategy. You can download finance PowerPoint template to prepare awesome presentations.
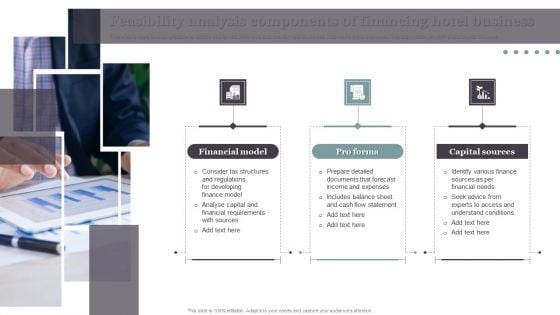
Feasibility Analysis Components Of Financing Hotel Business Inspiration PDF
This slide shows feasibility factors to decide capital requirements and cost for hotel business. It contains three elements financial model, pro forma and capital sources. Persuade your audience using this Feasibility Analysis Components Of Financing Hotel Business Inspiration PDF. This PPT design covers Three stages, thus making it a great tool to use. It also caters to a variety of topics including Financial Model, Pro Forma, Capital Sources. Download this PPT design now to present a convincing pitch that not only emphasizes the topic but also showcases your presentation skills.
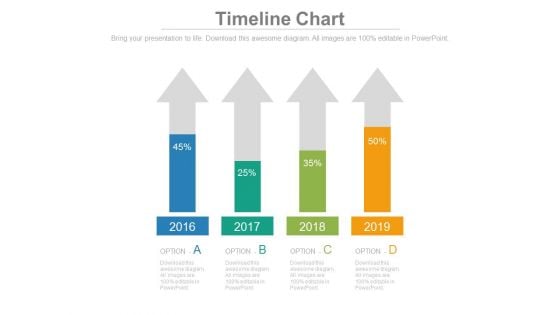
Four Arrows With Percentage Data Analysis Powerpoint Slides
This timeline template can be used for multiple purposes including financial planning, new milestones and tasks. It contains four upward arrows with percentage values. Download this PowerPoint timeline template to make impressive presentations.
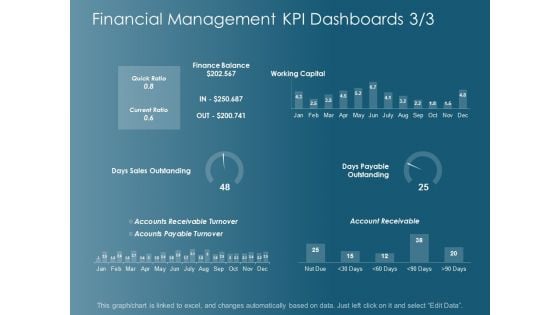
Financial Management Kpi Dashboards Strategy Ppt Powerpoint Presentation Gallery Graphics Template
This is a financial management kpi dashboards strategy ppt powerpoint presentation gallery graphics template. This is a six stage process. The stages in this process are finance, marketing, management, investment, analysis.

Financial Management Kpi Metrics Management Ppt Powerpoint Presentation Infographic Template Graphic Images
This is a financial management kpi metrics management ppt powerpoint presentation infographic template graphic images. This is a four stage process. The stages in this process are finance, marketing, management, investment, analysis.
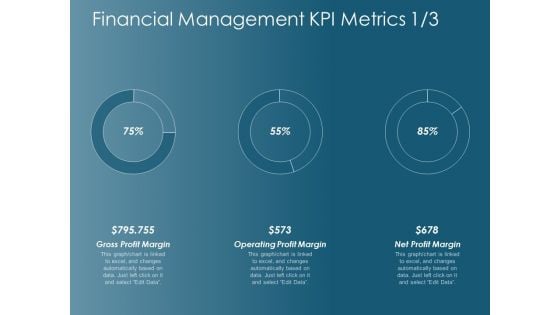
Financial Management Kpi Metrics Operating Profit Margin Ppt Powerpoint Presentation Infographic Template Images
This is a financial management kpi metrics operating profit margin ppt powerpoint presentation infographic template images. This is a three stage process. The stages in this process are finance, marketing, management, investment, analysis.

Major Components Of Five Step Dupont Analysis Model Information PDF
The following slide highlights the major components of five step DuPont model which illustrates tax burden, total asset turnover , financial leverage, interest burden and operating margin. Persuade your audience using this Major Components Of Five Step Dupont Analysis Model Information PDF. This PPT design covers four stages, thus making it a great tool to use. It also caters to a variety of topics including Interest Burden, Operating Margin, Financial Leverage. Download this PPT design now to present a convincing pitch that not only emphasizes the topic but also showcases your presentation skills.
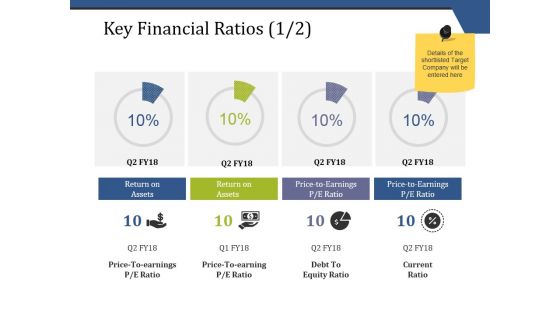
Key Financial Ratios Template 1 Ppt PowerPoint Presentation Outline Graphics Download
This is a key financial ratios template 1 ppt powerpoint presentation outline graphics download. This is a four stage process. The stages in this process are business, finance, analysis, marketing, strategy, investment.
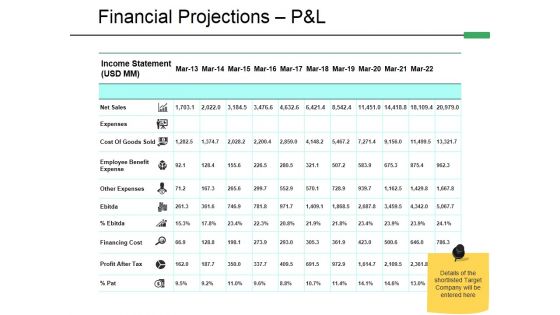
Financial Projections P And L Template 1 Ppt PowerPoint Presentation Show Ideas
This is a financial projections p and l template 1 ppt powerpoint presentation show ideas. This is a three stage process. The stages in this process are analysis, finance, strategy, business, marketing.

Financial Projections P And L Template 2 Ppt PowerPoint Presentation Portfolio Sample
This is a financial projections p and l template 2 ppt powerpoint presentation portfolio sample. This is a one stage process. The stages in this process are finance, strategy, business, marketing, analysis.
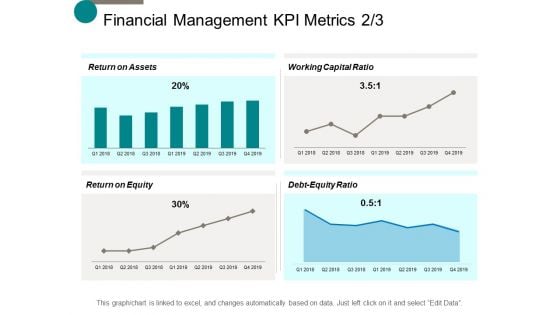
Financial Management Kpi Metrics Business Ppt Powerpoint Presentation Gallery File Formats
This is a financial management kpi metrics business ppt powerpoint presentation gallery file formats. This is a four stage process. The stages in this process are finance, marketing, management, investment, analysis.
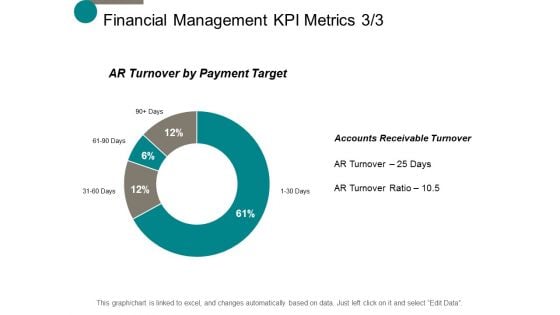
Financial Management Kpi Metrics Process Ppt Powerpoint Presentation Slides Graphics Download
This is a financial management kpi metrics process ppt powerpoint presentation slides graphics download. This is a four stage process. The stages in this process are finance, marketing, management, investment, analysis.
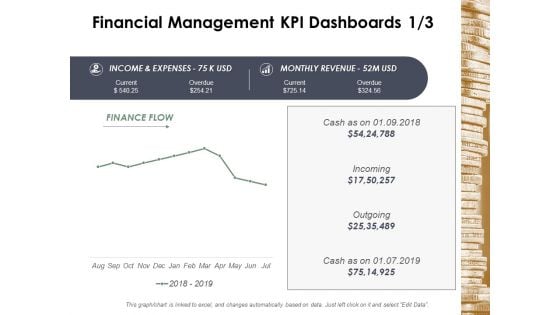
Financial Management Kpi Dashboards Business Ppt Powerpoint Presentation Infographic Template Deck
This is a financial management kpi dashboards business ppt powerpoint presentation infographic template deck. This is a four stage process. The stages in this process are finance, marketing, management, investment, analysis.
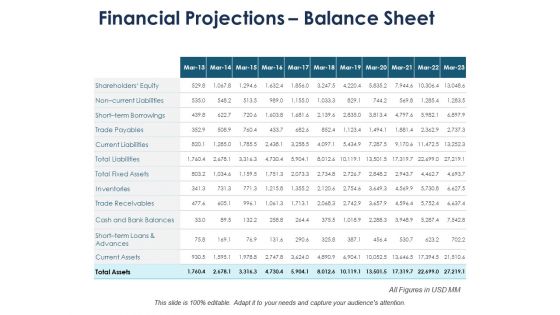
Financial Projections Balance Sheet Ppt PowerPoint Presentation Infographic Template Background Designs
This is a financial projections balance sheet ppt powerpoint presentation infographic template background designs. This is a three stage process. The stages in this process are finance, marketing, management, investment, analysis.
Quantitative Risk Analysis Risk Estimator Ppt PowerPoint Presentation Icon Designs
This is a quantitative risk analysis risk estimator ppt powerpoint presentation icon designs. This is a four stage process. The stages in this process are business, management, strategy, analysis, marketing.
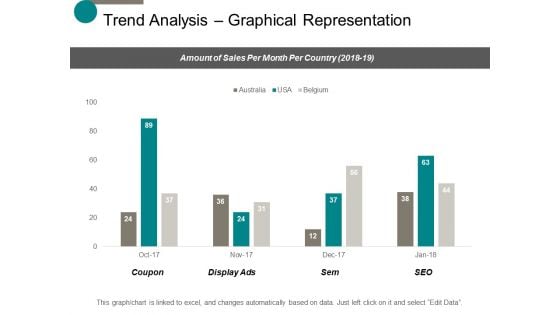
Trend Analysis Graphical Representation Ppt Powerpoint Presentation Slides Deck
This is a trend analysis graphical representation ppt powerpoint presentation slides deck. This is a four stage process. The stages in this process are finance, marketing, management, investment, analysis.

Trend Analysis Yearly Comparison Ppt Powerpoint Presentation Professional Example
This is a trend analysis yearly comparison ppt powerpoint presentation professional example. This is a two stage process. The stages in this process are finance, marketing, management, investment, analysis.
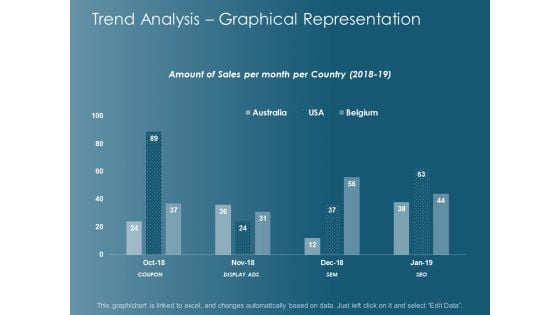
Trend Analysis Graphical Representation Ppt Powerpoint Presentation Gallery Graphic Images
This is a trend analysis graphical representation ppt powerpoint presentation gallery graphic images. This is a four stage process. The stages in this process are finance, marketing, management, investment, analysis.
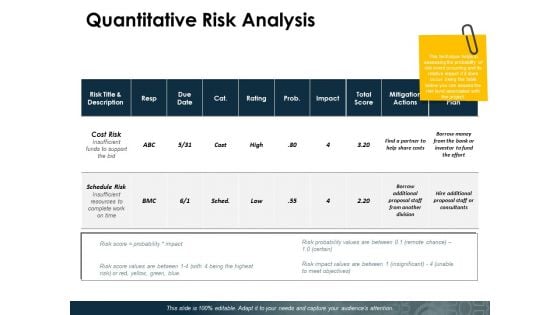
Quantitative Risk Analysis Slide Ppt PowerPoint Presentation Gallery Examples
This is a quantitative risk analysis slide ppt powerpoint presentation gallery examples. This is a three stage process. The stages in this process are percentage, management, marketing, business.
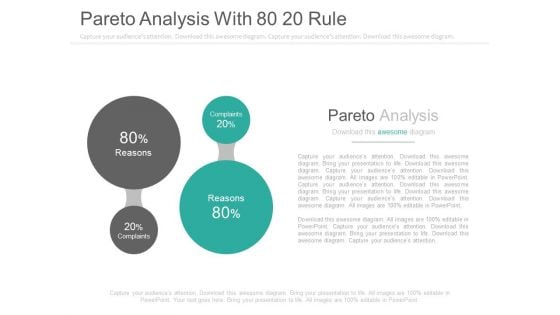
Pareto Analysis With 80 20 Rule Ppt Slides
This is a pareto analysis with 80 20 rule ppt slides. This is a two stage process. The stages in this process are finance, business.\n\n
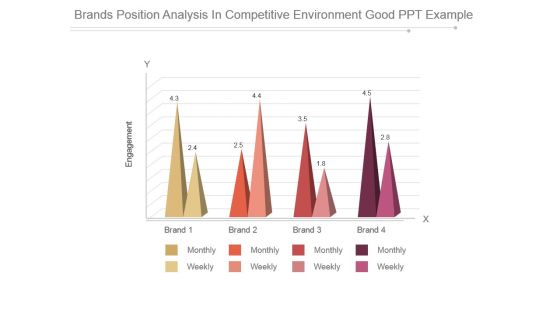
Brands Position Analysis In Competitive Environment Good Ppt Example
This is a brands position analysis in competitive environment good ppt example. This is a four stage process. The stages in this process are engagement, brand, monthly, weekly.
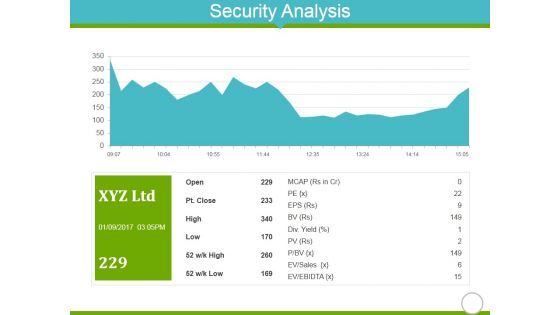
Security Analysis Ppt PowerPoint Presentation Infographic Template Shapes
This is a security analysis ppt powerpoint presentation infographic template shapes. This is a one stage process. The stages in this process are open, high, low, sales, ebidta.
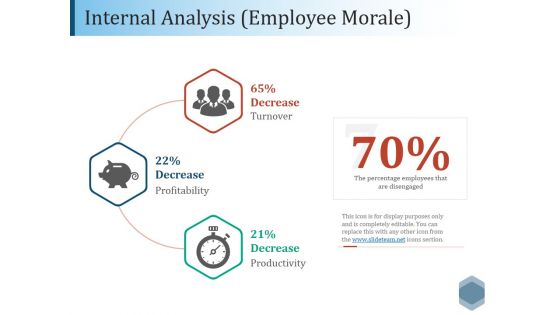
Internal Analysis Employee Morale Ppt PowerPoint Presentation Model Template
This is a internal analysis employee morale ppt powerpoint presentation model template. This is a three stage process. The stages in this process are decrease, profitability, turnover, productivity.
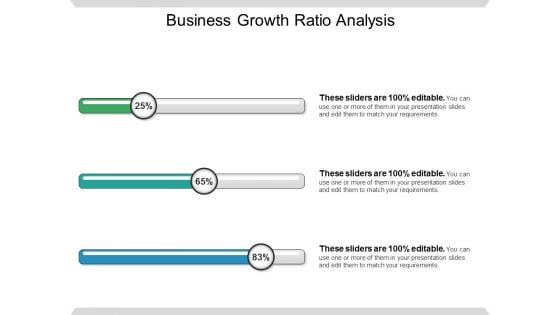
Business Growth Ratio Analysis Ppt PowerPoint Presentation Gallery Design Templates
This is a business growth ratio analysis ppt powerpoint presentation gallery design templates. This is a three stage process. The stages in this process are cost reduction strategies.

Thank You Time Analysis Ppt PowerPoint Presentation File Examples
This is a thank you time analysis ppt powerpoint presentation file examples. This is a one stage process. The stages in this process are thank you.
Charts Representing Business Data Analysis Icon Introduction PDF
Presenting charts representing business data analysis icon introduction pdf. to dispense important information. This template comprises three stages. It also presents valuable insights into the topics including charts representing business data analysis icon. This is a completely customizable PowerPoint theme that can be put to use immediately. So, download it and address the topic impactfully.
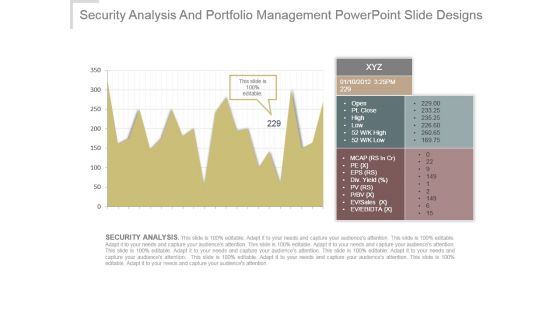
Security Analysis And Portfolio Management Powerpoint Slide Designs
This is a security analysis and portfolio management powerpoint slide designs. This is a one stage process. The stages in this process are xyz, open, pt close, high, low, mcap, pe, eps , div yield, pv, p bv, ev sales, ev ebitda, security analysis.
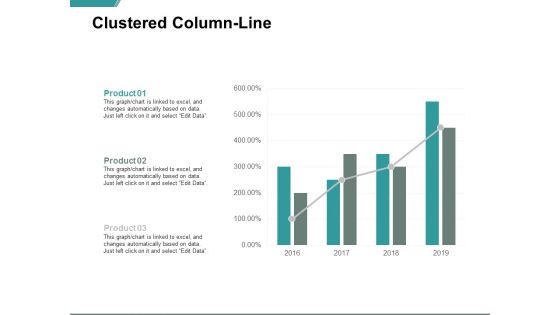
Clustered Column Line Analysis Ppt PowerPoint Presentation Inspiration Vector
Presenting this set of slides with name clustered column line analysis ppt powerpoint presentation inspiration vector. This is a one stage process. The stages in this process are finance, marketing, management, investment, analysis. This is a completely editable PowerPoint presentation and is available for immediate download. Download now and impress your audience.

SFA Application Usage Analysis Ppt PowerPoint Presentation Gallery Visuals PDF
This Slide shows various applications of sales force automation with usage analysis which can be referred by multiple departments for automating sales tasks. This provides information about IT, call centers, financial companies, human resources, corporate systems, primary application, operational impact, etc. Showcasing this set of slides titled sfa application usage analysis ppt powerpoint presentation gallery visuals pdf. The topics addressed in these templates are departments, primary application, most used software, financial corporations. All the content presented in this PPT design is completely editable. Download it and make adjustments in color, background, font etc. as per your unique business setting.
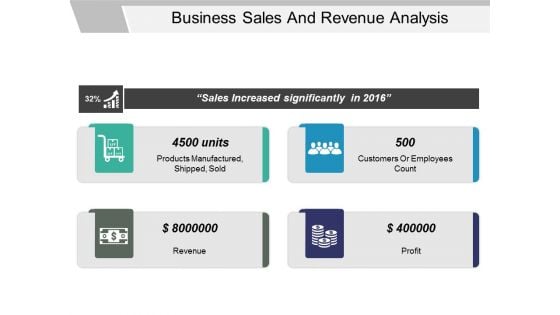
Business Sales And Revenue Analysis Ppt PowerPoint Presentation Layouts Display
This is a business sales and revenue analysis ppt powerpoint presentation layouts display. This is a four stage process. The stages in this process are goals, results, output, deliverables.
Data Interpretation Percentage Analysis Ppt Powerpoint Presentation Summary Icon
This is a data interpretation percentage analysis ppt powerpoint presentation summary icon. This is a six stage process. The stages in this process are data presentation, content presentation, information presentation.
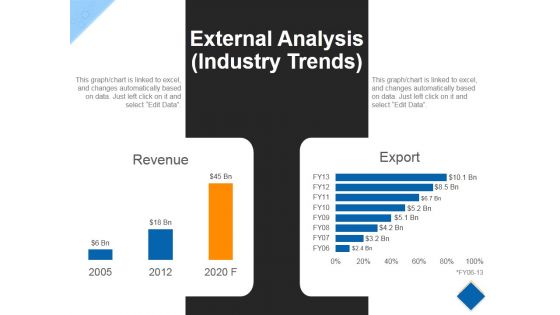
External Analysis Template 2 Ppt PowerPoint Presentation Styles Example File
This is a external analysis template 2 ppt powerpoint presentation styles example file. This is a two stage process. The stages in this process are revenue export, year, growth.
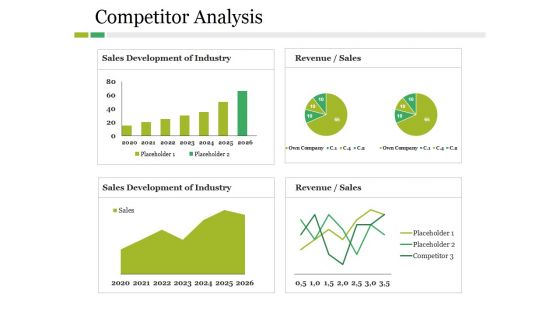
Competitor Analysis Ppt PowerPoint Presentation File Graphics Example
This is a competitor analysis ppt powerpoint presentation file graphics example. This is a four stage process. The stages in this process are revenue, sales development of industry, own company, placeholder, competitor.
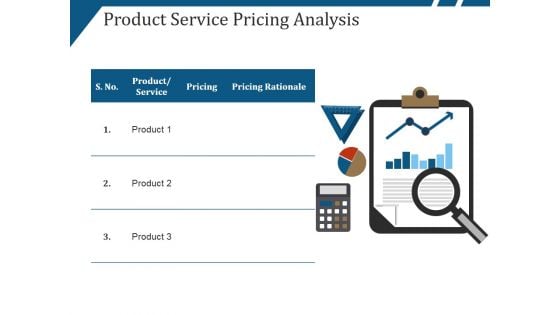
Product Service Pricing Analysis Ppt PowerPoint Presentation Ideas Design Templates
This is a product service pricing analysis ppt powerpoint presentation ideas design templates. This is a three stage process. The stages in this process are pricing rationale, pricing, product.
Data Analysis Vector Icons Ppt Powerpoint Presentation Layouts Gridlines
This is a data analysis vector icons ppt powerpoint presentation layouts gridlines. This is a two stage process. The stages in this process are data presentation, content presentation, information presentation.
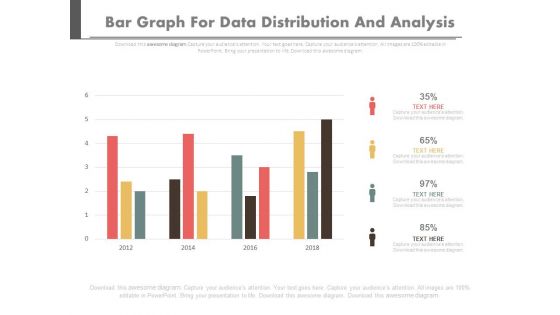
Bar Graph For Data Distribution And Analysis Powerpoint Slides
This PowerPoint template has been designed with bar graph. This PowerPoint diagram is useful for data distribution and analysis This diagram slide can be used to make impressive presentations.
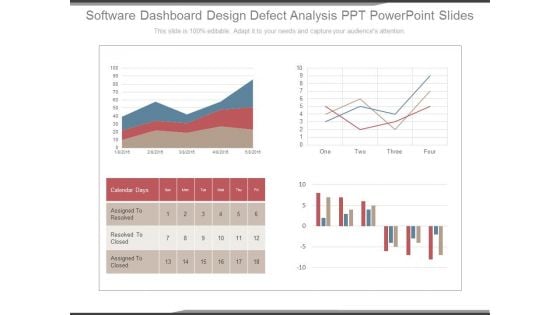
Software Dashboard Design Defect Analysis Ppt Powerpoint Slides
This is a software dashboard design defect analysis ppt powerpoint slides. This is a four stage process. The stages in this process are calendar days, assigned to resolved, resolved to closed, assigned to closed.

Break Point Chart For Quality Analysis Powerpoint Slide Show
This is a break point chart for quality analysis powerpoint slide show. This is a one stage process. The stages in this process are total variable costs, fixed costs, quality sold.
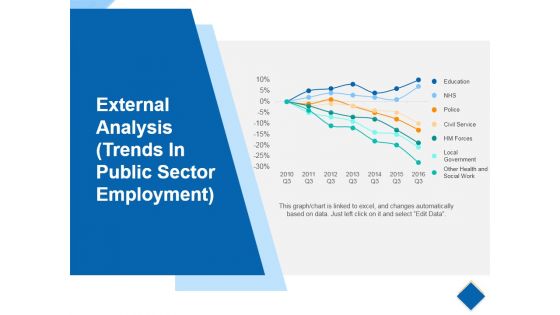
External Analysis Template 4 Ppt PowerPoint Presentation Portfolio Designs
This is a external analysis template 4 ppt powerpoint presentation portfolio designs. This is a seven stage process. The stages in this process are education, police, civil service, hm forces, local government.
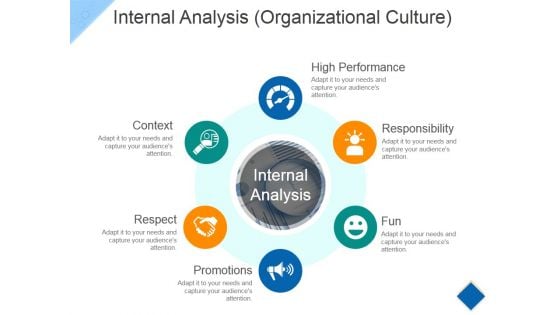
Internal Analysis Template 2 Ppt PowerPoint Presentation Portfolio Designs Download
This is a internal analysis template 2 ppt powerpoint presentation portfolio designs download. This is a three stage process. The stages in this process are employee performance, sales, employee.
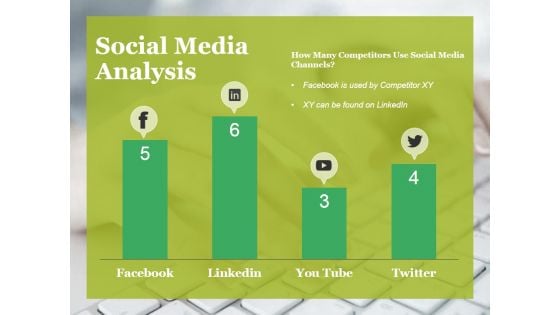
Social Media Analysis Ppt PowerPoint Presentation Infographics Samples
This is a social media analysis ppt powerpoint presentation infographics samples. This is a four stage process. The stages in this process are facebook, linkedin, twitter, you tube, social media.
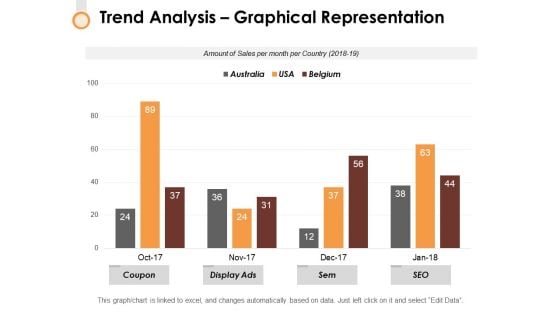
Trend Analysis Graphical Representation Ppt PowerPoint Presentation Portfolio Images
This is a trend analysis graphical representation ppt powerpoint presentation portfolio images. This is a three stage process. The stages in this process are finance, strategy, marketing, management, business.
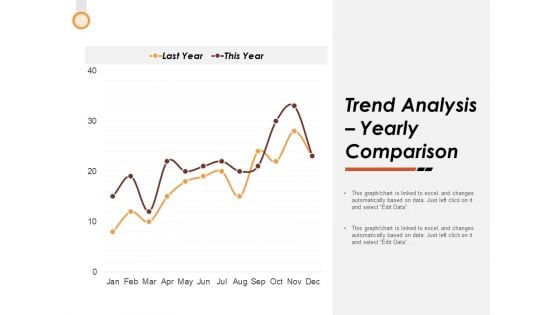
Trend Analysis Yearly Comparison Ppt PowerPoint Presentation Summary Visual Aids
This is a trend analysis yearly comparison ppt powerpoint presentation summary visual aids. This is a two stage process. The stages in this process are finance, strategy, marketing, management, business.
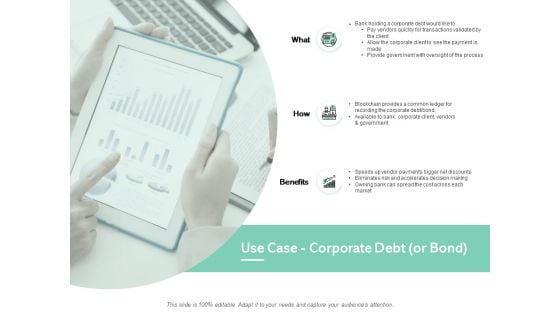
Use Case Corporate Debt Or Bond Financial Ppt PowerPoint Presentation File Graphics Download
Presenting this set of slides with name use case corporate debt or bond financial ppt powerpoint presentation file graphics download. This is a three stage process. The stages in this process are finance, marketing, management, investment, analysis. This is a completely editable PowerPoint presentation and is available for immediate download. Download now and impress your audience.
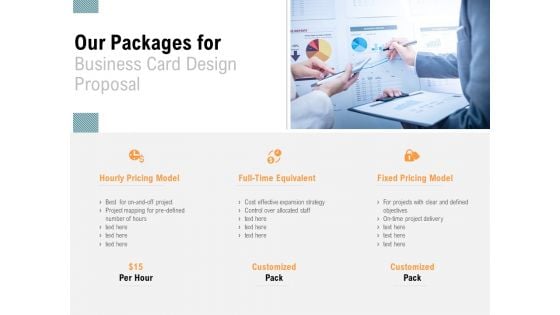
Our Packages For Business Card Design Proposal Financial Ppt PowerPoint Presentation Model Graphics Pictures
Presenting this set of slides with name our packages for business card design proposal financial ppt powerpoint presentation model graphics pictures. This is a three stage process. The stages in this process are finance, marketing, management, investment, analysis. This is a completely editable PowerPoint presentation and is available for immediate download. Download now and impress your audience.
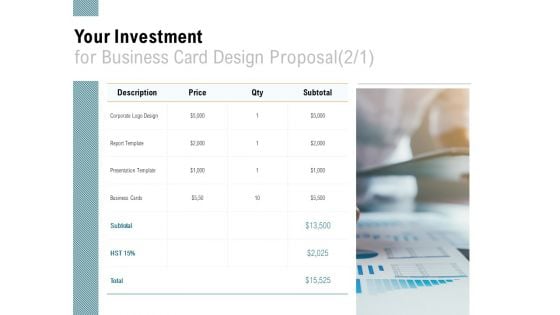
Your Investment For Business Card Design Proposal Financial Ppt PowerPoint Presentation Portfolio Grid
Presenting this set of slides with name your investment for business card design proposal financial ppt powerpoint presentation portfolio grid. This is a one stage process. The stages in this process are finance, marketing, management, investment, analysis. This is a completely editable PowerPoint presentation and is available for immediate download. Download now and impress your audience.
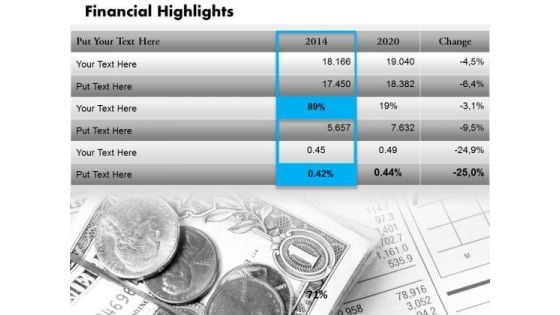
Mba Models And Frameworks 3d Financial Report Table Diagram Strategy Diagram
Be A Donor Of Great Ideas. Display Your Charity On Our MBA Models And Frameworks 3d Financial Report Table Diagram Strategy Diagram Powerpoint Templates. Make A Donation Of Your Ideas. Our MBA Models And Frameworks 3d Financial Report Table Diagram Strategy Diagram Powerpoint Templates Will Convey Your Charitable Attitude.
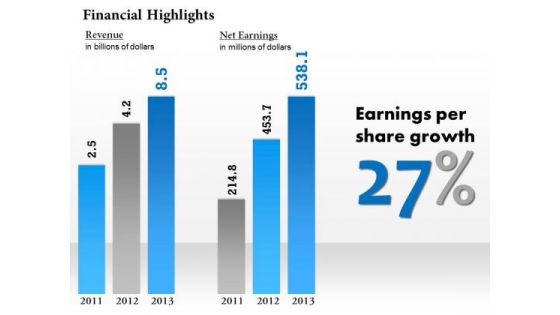
Sales Diagram Financial Result Display Bar Graph Diagram Business Framework Model
Our Sales Diagram Financial Result Display Bar Graph Diagram Business Framework Model Powerpoint Templates Deliver At Your Doorstep. Let Them In For A Wonderful Experience. Dig Out The Dope With Our Sales Diagram Financial Result Display Bar Graph Diagram Business Framework Model Powerpoint Templates. Your Thoughts Will Expose The Truth.
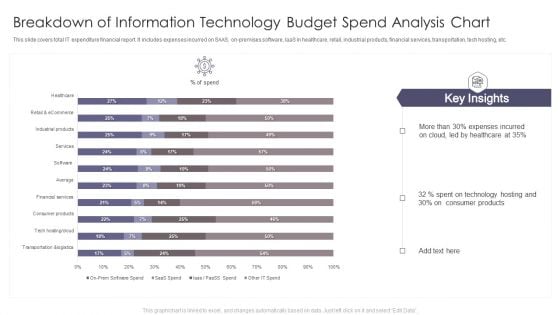
Breakdown Of Information Technology Budget Spend Analysis Chart Download PDF
This slide covers total IT expenditure financial report. It includes expenses incurred on SAAS, on-premises software, laaS in healthcare, retail, industrial products, financial services, transportation, tech hosting, etc. Pitch your topic with ease and precision using this Breakdown Of Information Technology Budget Spend Analysis Chart Download PDF. This layout presents information on Expenses Incurred, Technology Hosting, Consumer Products. It is also available for immediate download and adjustment. So, changes can be made in the color, design, graphics or any other component to create a unique layout.
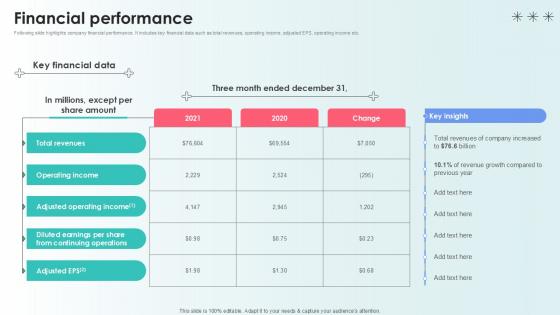
Financial Performance Capital Raising Pitch Deck For Health Care Services Ppt Slide
Following slide highlights company financial performance. It includes key financial data such as total revenues, operating income, adjusted EPS, operating income etc. From laying roadmaps to briefing everything in detail, our templates are perfect for you. You can set the stage with your presentation slides. All you have to do is download these easy-to-edit and customizable templates. Financial Performance Capital Raising Pitch Deck For Health Care Services Ppt Slide will help you deliver an outstanding performance that everyone would remember and praise you for. Do download this presentation today. Following slide highlights company financial performance. It includes key financial data such as total revenues, operating income, adjusted EPS, operating income etc.
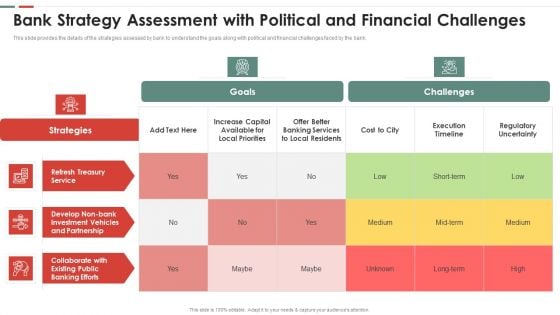
Feasibility Analysis Template Different Projects Bank Strategy Assessment Graphics PDF
This slide provides the details of the strategies assessed by bank to understand the goals along with political and financial challenges faced by the bank. Deliver an awe inspiring pitch with this creative feasibility analysis template different projects bank strategy assessment graphics pdf bundle. Topics like strategies, service, partnership, investment, collaborate can be discussed with this completely editable template. It is available for immediate download depending on the needs and requirements of the user.

Financial Risk Monitoring And Mitigation Plan For Company Risk Monitoring And Mitigation DTE SS V
This slide represents the mitigation plan to prepare for and lessen the effects of financial threats faced by the business. It includes details related to financial risks, risk level and their mitigation plan.Present like a pro with Financial Risk Monitoring And Mitigation Plan For Company Risk Monitoring And Mitigation DTE SS V. Create beautiful presentations together with your team, using our easy-to-use presentation slides. Share your ideas in real-time and make changes on the fly by downloading our templates. So whether you are in the office, on the go, or in a remote location, you can stay in sync with your team and present your ideas with confidence. With Slidegeeks presentation got a whole lot easier. Grab these presentations today. This slide represents the mitigation plan to prepare for and lessen the effects of financial threats faced by the business. It includes details related to financial risks, risk level and their mitigation plan.
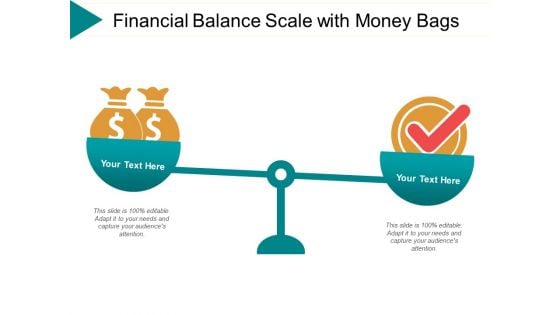
Financial Balance Scale With Money Bags Ppt PowerPoint Presentation Gallery Templates
This is a financial balance scale with money bags ppt powerpoint presentation gallery templates. This is a two stage process. The stages in this process are cost benefit analysis, cost benefit investigation, cost benefit examination.
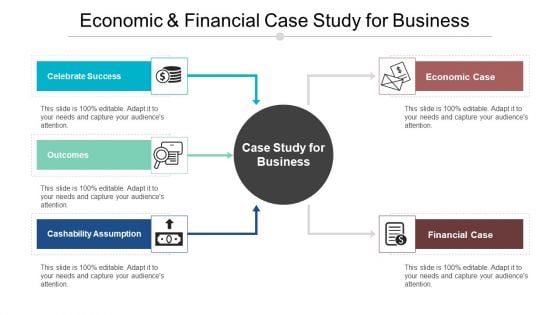
Economic And Financial Case Study For Business Ppt PowerPoint Presentation Deck
This is a economic and financial case study for business ppt powerpoint presentation deck. This is a five stage process. The stages in this process are cost benefit analysis, cost benefit investigation, cost benefit examination.
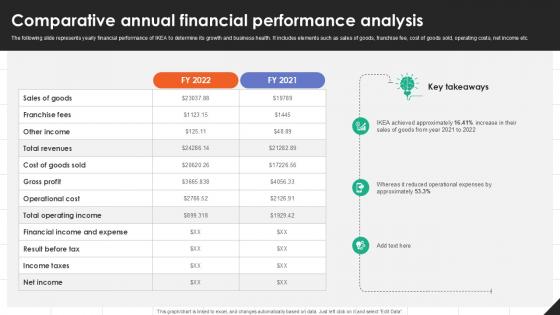
Comparative Annual Financial IKEAs Successful Market Expansion PPT Slide Strategy SS V
The following slide represents yearly financial performance of IKEA to determine its growth and business health. It includes elements such as sales of goods, franchise fee, cost of goods sold, operating costs, net income etc. From laying roadmaps to briefing everything in detail, our templates are perfect for you. You can set the stage with your presentation slides. All you have to do is download these easy-to-edit and customizable templates. Comparative Annual Financial IKEAs Successful Market Expansion PPT Slide Strategy SS V will help you deliver an outstanding performance that everyone would remember and praise you for. Do download this presentation today. The following slide represents yearly financial performance of IKEA to determine its growth and business health. It includes elements such as sales of goods, franchise fee, cost of goods sold, operating costs, net income etc.

Rapid Application Development Architecture Banking Financial Services And Insurance Bfsi And Rad Guidelines PDF
This slide represents the role of RAD in banking, financial services, and insurance and how RAD helps banks and financial institutions to launch new financial products quickly. Presenting Rapid Application Development Architecture Banking Financial Services And Insurance Bfsi And Rad Guidelines PDF to provide visual cues and insights. Share and navigate important information on five stages that need your due attention. This template can be used to pitch topics like Conduct Transactions, Traditional Banking, Millennials Frequent. In addtion, this PPT design contains high resolution images, graphics, etc, that are easily editable and available for immediate download.
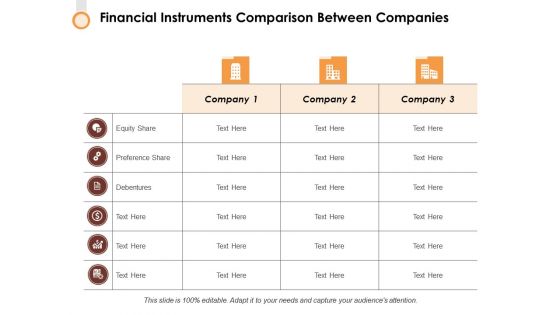
Financial Instruments Comparison Between Companies Ppt PowerPoint Presentation Styles Layout Ideas
This is a financial instruments comparison between companies ppt powerpoint presentation styles layout ideas. This is a three stage process. The stages in this process are compare, icons, analysis, strategy, marketing.
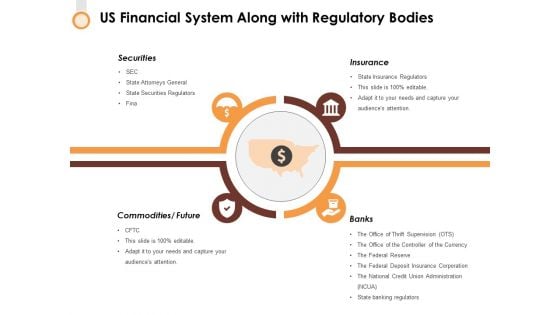
Us Financial System Along With Regulatory Bodies Ppt PowerPoint Presentation Show Display
This is a us financial system along with regulatory bodies ppt powerpoint presentation show display. This is a four stage process. The stages in this process are business, icons, analysis, strategy, marketing.
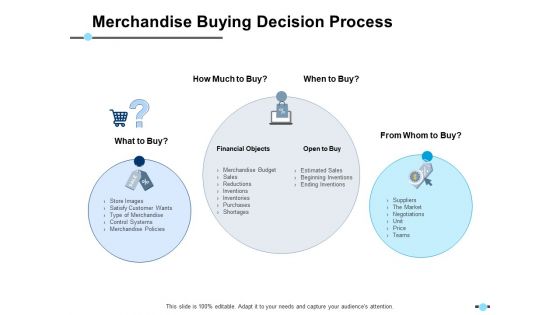
Merchandise Buying Decision Process Financial Objects Ppt PowerPoint Presentation Infographics Example
This is a merchandise buying decision process financial objects ppt powerpoint presentation infographics example. This is a three stage process. The stages in this process are icons, management, strategy, analysis, marketing.
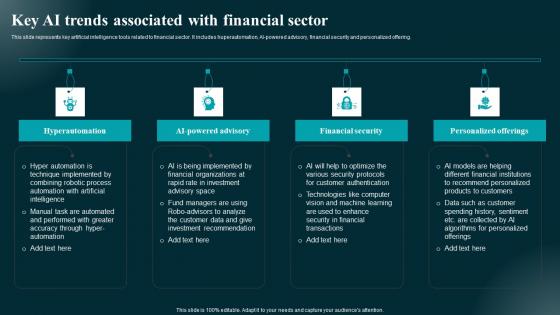
Key AI Trends Associated With Financial Sector Applications And Impact Themes Pdf
This slide represents key artificial intelligence tools related to financial sector. It includes huperautomation, AI-powered advisory, financial security and personalized offering. Find a pre-designed and impeccable Key AI Trends Associated With Financial Sector Applications And Impact Themes Pdf. The templates can ace your presentation without additional effort. You can download these easy-to-edit presentation templates to make your presentation stand out from others. So, what are you waiting for Download the template from Slidegeeks today and give a unique touch to your presentation. This slide represents key artificial intelligence tools related to financial sector. It includes huperautomation, AI-powered advisory, financial security and personalized offering.


 Continue with Email

 Home
Home


