financial analysis
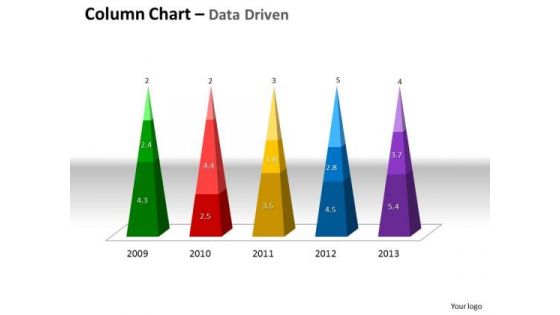
Data Analysis On Excel 3d Chart To Monitor Business Process PowerPoint Templates
Make Some Dough With Our data analysis on excel 3d chart to monitor business process Powerpoint Templates . Your Assets Will Rise Significantly.
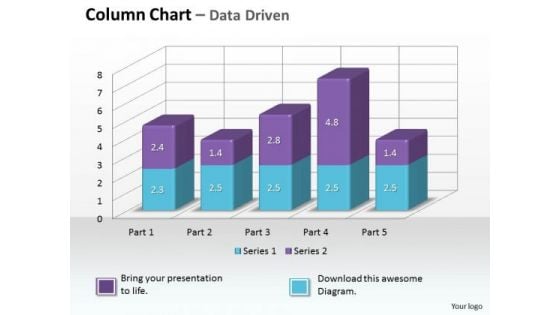
Data Analysis On Excel 3d Chart With Sets Of PowerPoint Templates
Reduce The Drag With Our data analysis on excel 3d chart with sets of Powerpoint Templates . Give More Lift To Your Thoughts.

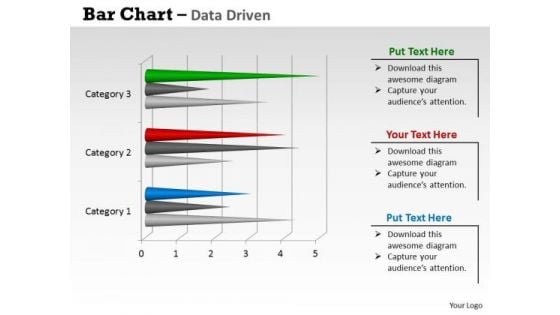
Data Analysis On Excel Driven Sets Of Business Information PowerPoint Slides Templates
Break The Deadlock With Our data analysis on excel driven sets of business information powerpoint slides Templates . Let The Words Start To Flow.
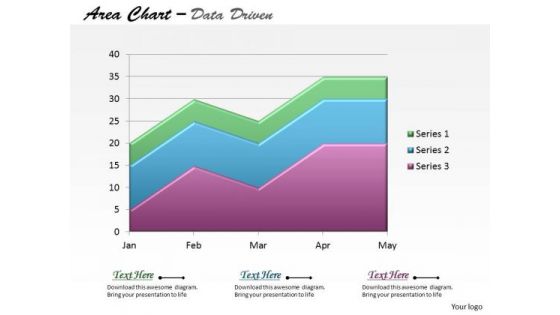
Data Analysis On Excel Driven Stacked Area Chart PowerPoint Slides Templates
Be The Dramatist With Our data analysis on excel driven stacked area chart powerpoint slides Templates . Script Out The Play Of Words.
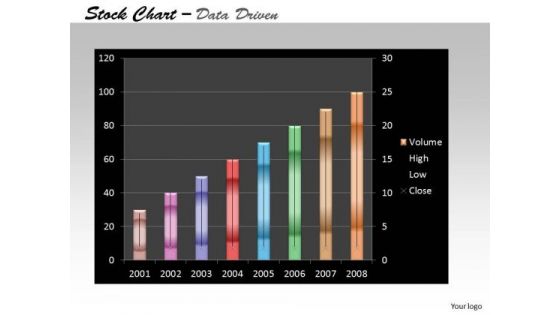
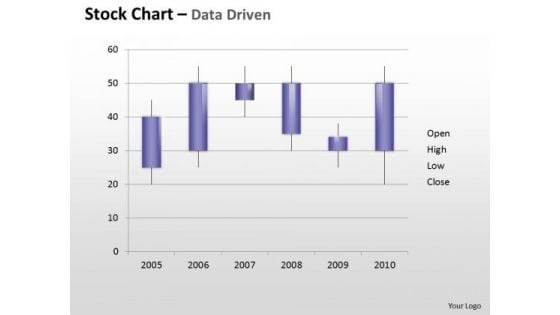
Data Analysis On Excel Driven Stock Chart For Business Growth PowerPoint Slides Templates
Add Some Dramatization To Your Thoughts. Our data analysis on excel driven stock chart for business growth powerpoint slides Templates Make Useful Props.
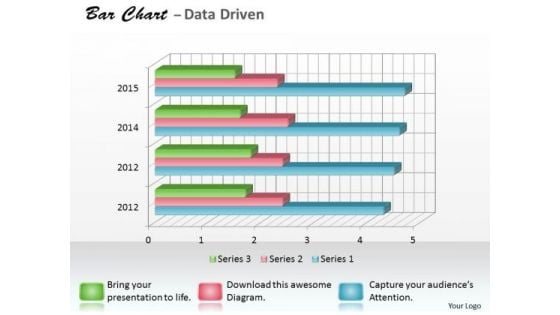
Data Analysis Programs 3d Bar Chart For Research In Statistics PowerPoint Templates
Draw It Out On Our data analysis programs 3d bar chart for research in statistics Powerpoint Templates . Provide Inspiration To Your Colleagues.
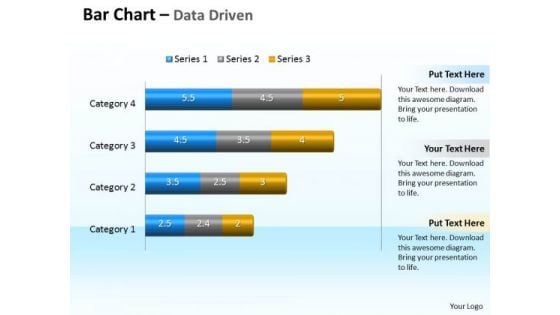
Data Analysis Programs 3d Bar Chart To Compare Categories PowerPoint Templates
Discover Decisive Moments With Our data analysis programs 3d bar chart to compare categories Powerpoint Templates . They Help Make That Crucial Difference.
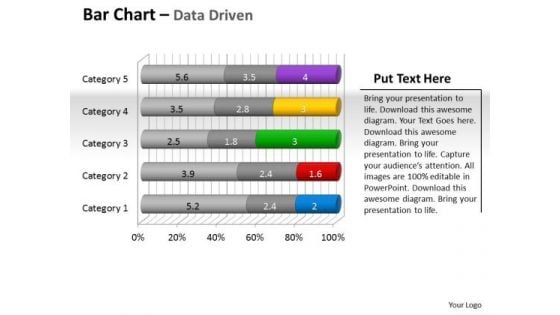
Data Analysis Programs 3d Bar Chart To Put Information PowerPoint Templates
Draw Up Your Agenda On Our data analysis programs 3d bar chart to put information Powerpoint Templates . Coax Your Audience Into Acceptance.

Data Analysis Template Driven Express Business Facts Pie Chart PowerPoint Slides Templates
Display Your Drive On Our data analysis template driven express business facts pie chart powerpoint slides Templates . Invigorate The Audience With Your Fervor.
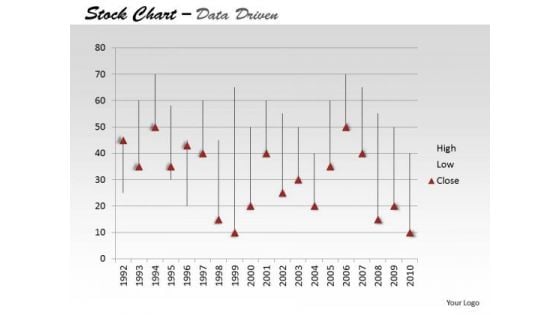
Data Analysis Template Driven Ineract With Stock Chart PowerPoint Slides Templates
Drive Your Passion With Our data analysis template driven ineract with stock chart powerpoint slides Templates . Steer Yourself To Achieve Your Aims.
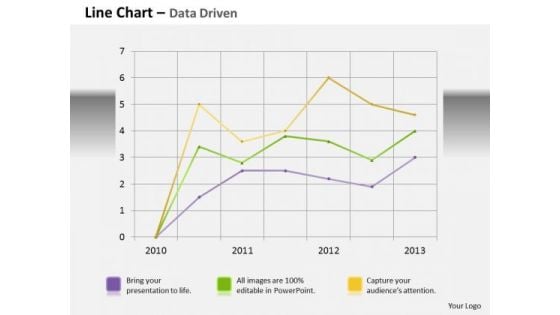
Data Analysis Template Driven Line Chart Business Graph PowerPoint Slides Templates
Bottle Your Thoughts In Our data analysis template driven line chart business graph powerpoint slides Templates . Pass It Around For Your Audience To Sip.
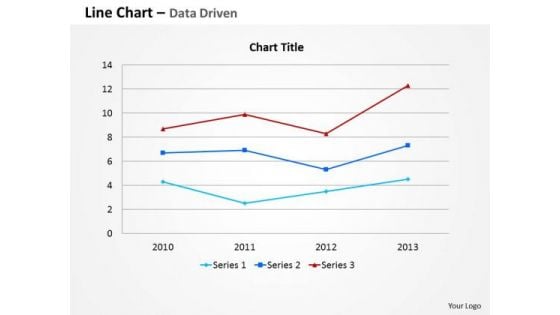
Data Analysis Template Driven Line Chart For Business Information PowerPoint Slides Templates
Your Thoughts Are Dripping With Wisdom. Lace It With Our data analysis template driven line chart for business information powerpoint slides Templates .
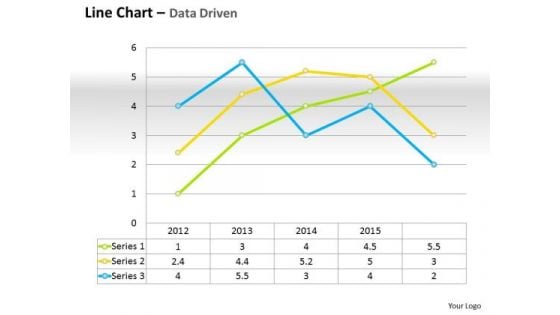
Data Analysis Template Driven Line Chart For Business Performance PowerPoint Slides Templates
Do Not Allow Things To Drift. Ring In Changes With Our data analysis template driven line chart for business performance powerpoint slides Templates .
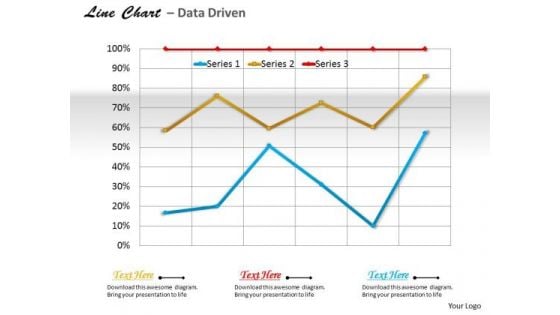
Data Analysis Template Driven Line Chart For Business Trends PowerPoint Slides Templates
Use Our data analysis template driven line chart for business trends powerpoint slides Templates As The Bit. Drill Your Thoughts Into Their Minds.
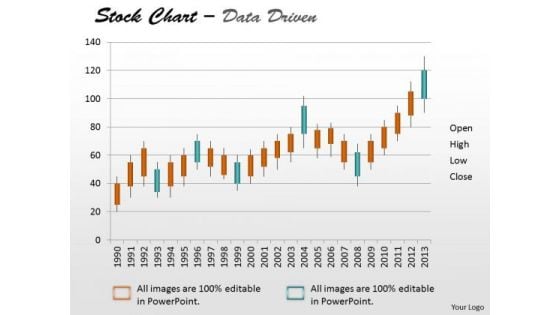
Data Analysis Template Driven Stock Chart For Market Trends PowerPoint Slides Templates
Drive Your Team Along The Road To Success. Take The Wheel With Our data analysis template driven stock chart for market trends powerpoint slides Templates .
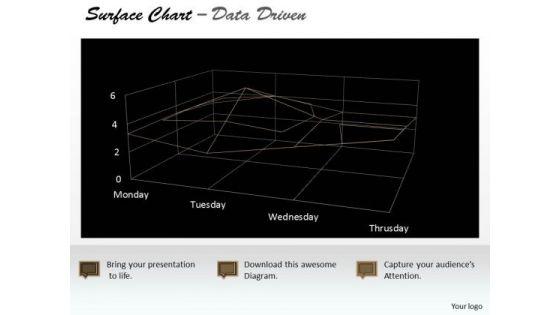
Data Analysis Template Driven Surface Chart Indicating Areas PowerPoint Slides Templates
Highlight Your Drive With Our data analysis template driven surface chart indicating areas powerpoint slides Templates . Prove The Fact That You Have Control.
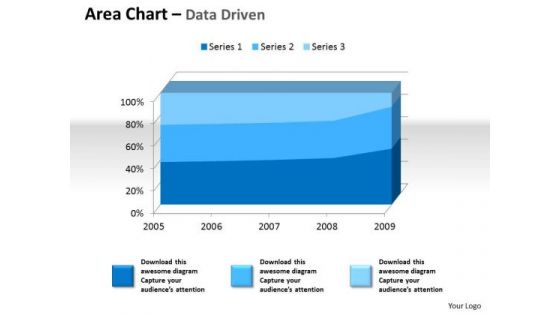
Examples Of Data Analysis Market 3d Area Chart For Quantiative PowerPoint Templates
Drum It Up With Our examples of data analysis market 3d area chart for quantiative Powerpoint Templates . Your Thoughts Will Raise The Tempo.
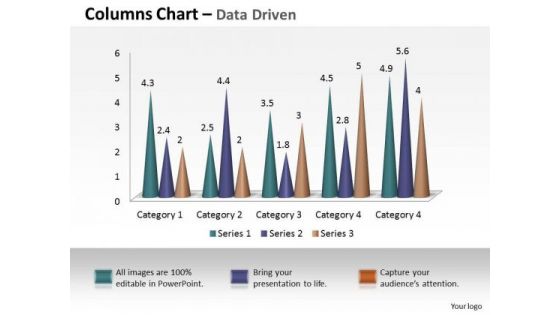
Examples Of Data Analysis Market 3d Business Intelligence And PowerPoint Templates
Our examples of data analysis market 3d business intelligence and Powerpoint Templates Are Dual Purpose. They Help Instruct And Inform At The Same Time.
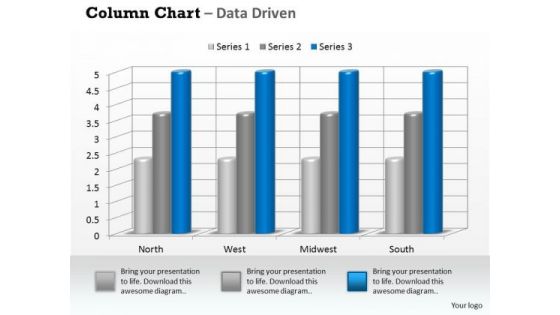
Examples Of Data Analysis Market 3d Business On Regular Intervals PowerPoint Templates
Drum It Out Loud And Clear On Our examples of data analysis market 3d business on regular intervals Powerpoint Templates . Your Words Will Ring In Their Ears.
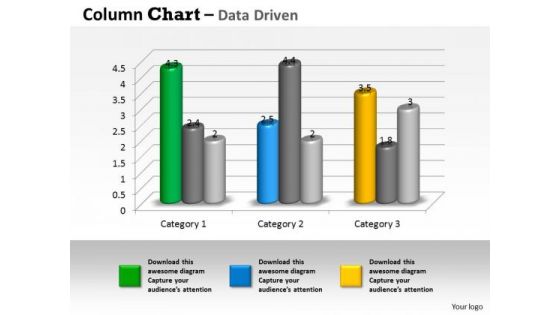
Examples Of Data Analysis Market 3d Business Trend Series Chart PowerPoint Templates
Duct It Through With Our examples of data analysis market 3d business trend series chart Powerpoint Templates . Your Ideas Will Reach Into Their Minds Intact.
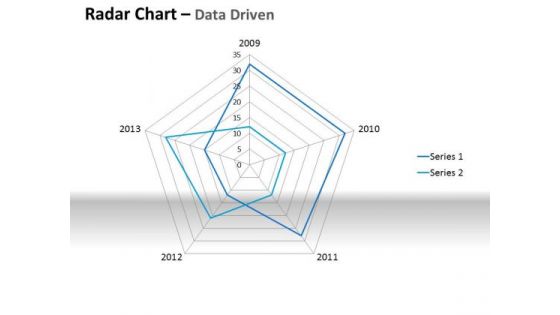
Examples Of Data Analysis Market Driven Plotting The Business Values PowerPoint Slides Templates
Ring The Duck With Our examples of data analysis market driven plotting the business values powerpoint slides Templates . Acquire The Points With Your Ideas.
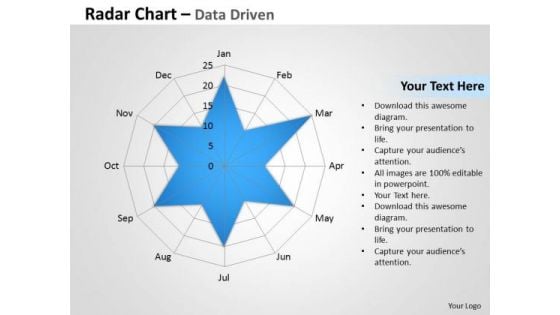
Examples Of Data Analysis Market Driven Radar Chart To Compare PowerPoint Slides Templates
Rely On Our examples of data analysis market driven radar chart to compare powerpoint slides Templates In Any Duel. They Will Drive Home Your Point.
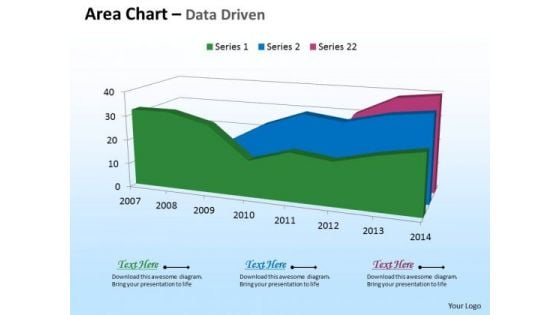
Microsoft Excel Data Analysis 3d Area Chart For Time Based PowerPoint Templates
Deliver The Right Dose With Our microsoft excel data analysis 3d area chart for time based Powerpoint Templates . Your Ideas Will Get The Correct Illumination.
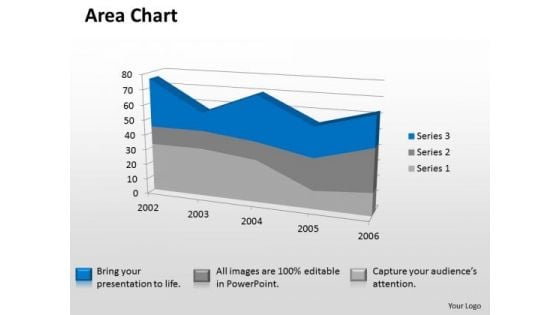
Microsoft Excel Data Analysis 3d Area Chart Showimg Change In Values PowerPoint Templates
Our microsoft excel data analysis 3d area chart showimg change in values Powerpoint Templates Deliver At Your Doorstep. Let Them In For A Wonderful Experience.
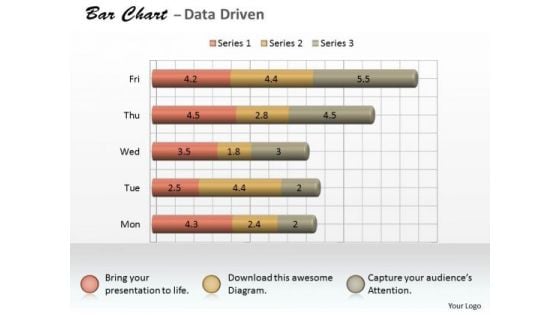
Microsoft Excel Data Analysis 3d Bar Chart As Research Tool PowerPoint Templates
Knock On The Door To Success With Our microsoft excel data analysis 3d bar chart as research tool Powerpoint Templates . Be Assured Of Gaining Entry.
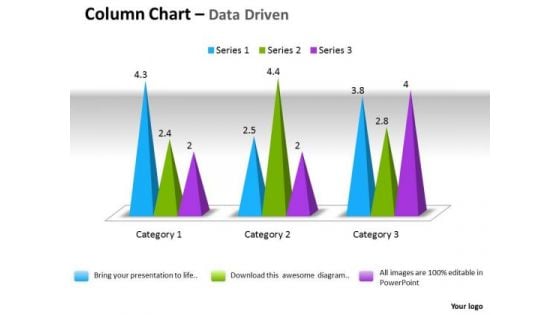
Microsoft Excel Data Analysis 3d Change In Business Process Chart PowerPoint Templates
Double Your Chances With Our microsoft excel data analysis 3d change in business process chart Powerpoint Templates . The Value Of Your Thoughts Will Increase Two-Fold.
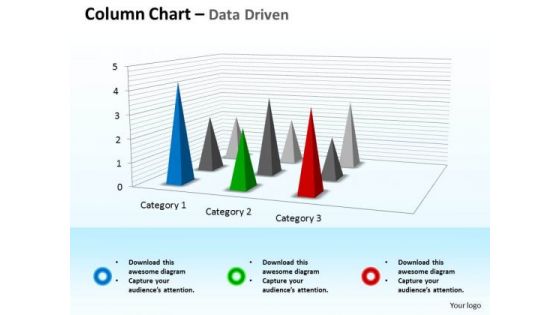
Microsoft Excel Data Analysis 3d Chart For Business Observation PowerPoint Templates
Double Up Our microsoft excel data analysis 3d chart for business observation Powerpoint Templates With Your Thoughts. They Will Make An Awesome Pair.
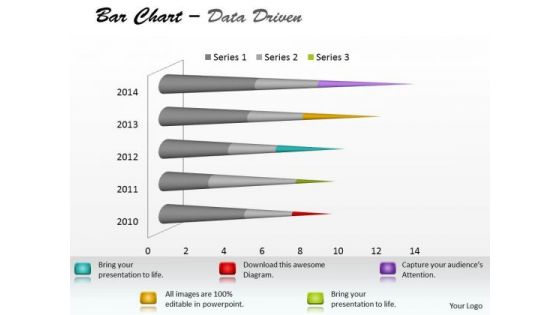
Microsoft Excel Data Analysis Bar Chart To Communicate Information PowerPoint Templates
With Our microsoft excel data analysis bar chart to communicate information Powerpoint Templates You Will Be Doubly Sure. They Possess That Stamp Of Authority.
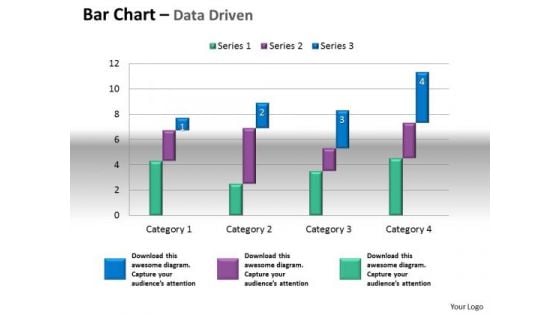
Microsoft Excel Data Analysis Bar Chart To Compare Quantities PowerPoint Templates
Our microsoft excel data analysis bar chart to compare quantities Powerpoint Templates Leave No One In Doubt. Provide A Certainty To Your Views.
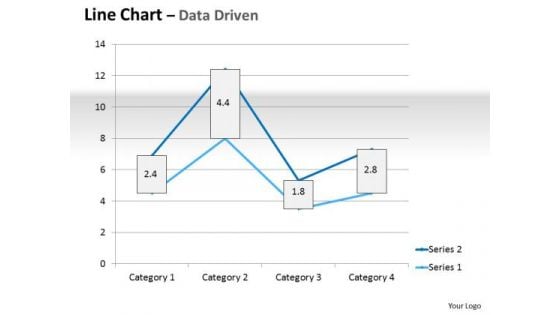
Multivariate Data Analysis Driven Line Chart Market Graph PowerPoint Slides Templates
Plan For All Contingencies With Our multivariate data analysis driven line chart market graph powerpoint slides Templates . Douse The Fire Before It Catches.
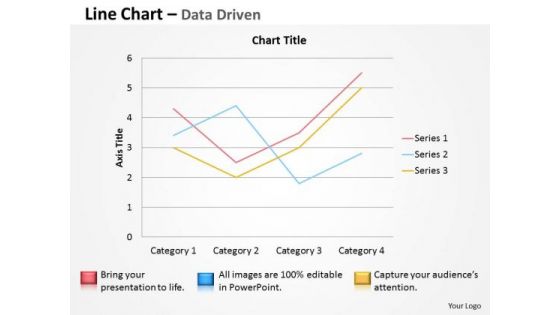
Multivariate Data Analysis Driven Line Chart To Demonstrate PowerPoint Slides Templates
Brace Yourself, Arm Your Thoughts. Prepare For The Hustle With Our multivariate data analysis driven line chart to demonstrate powerpoint slides Templates .
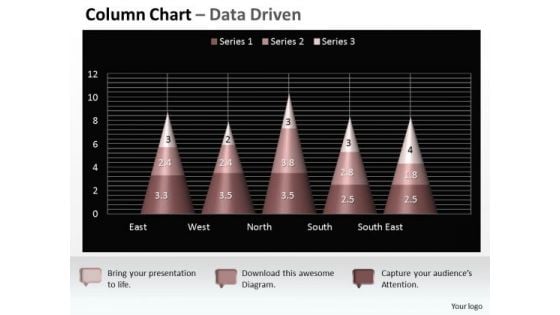
Data Analysis On Excel 3d Chart Shows Interrelated Sets Of PowerPoint Templates
Put Them On The Same Page With Our data analysis on excel 3d chart shows interrelated sets of Powerpoint Templates . Your Team Will Sing From The Same Sheet.
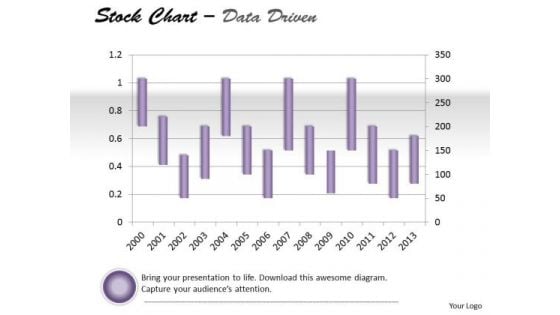
Data Analysis On Excel Driven Stock Chart For Market History PowerPoint Slides Templates
Draw Out The Best In You With Our data analysis on excel driven stock chart for market history powerpoint slides Templates . Let Your Inner Brilliance Come To The Surface.
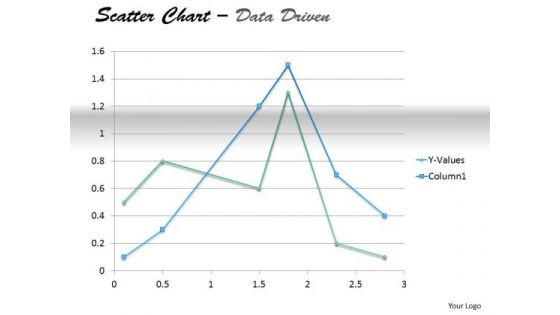
Examples Of Data Analysis Market Driven Present In Scatter Chart PowerPoint Slides Templates
Your Thoughts Will Take To Our examples of data analysis market driven present in scatter chart powerpoint slides Templates Like A Duck To Water. They Develop A Binding Affinity.
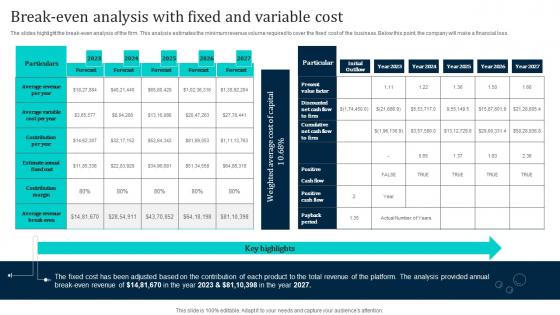
Break Even Analysis With Fixed And Variable Cost Laundromat Business Plan Go To Market Microsoft Pdf
The slides highlight the break-even analysis of the firm. This analysis estimates the minimum revenue volume required to cover the fixed cost of the business. Below this point, the company will make a financial loss.Create an editable Break Even Analysis With Fixed And Variable Cost Laundromat Business Plan Go To Market Microsoft Pdf that communicates your idea and engages your audience. Whether you are presenting a business or an educational presentation, pre-designed presentation templates help save time. Break Even Analysis With Fixed And Variable Cost Laundromat Business Plan Go To Market Microsoft Pdf is highly customizable and very easy to edit, covering many different styles from creative to business presentations. Slidegeeks has creative team members who have crafted amazing templates. So, go and get them without any delay. The slides highlight the break even analysis of the firm. This analysis estimates the minimum revenue volume required to cover the fixed cost of the business. Below this point, the company will make a financial loss.

Business Diagram Data Driven Bar Graph And Pie Chart For Analysis PowerPoint Slide
This PowerPoint template displays technology gadgets with various business charts. Use this diagram slide, in your presentations to make business reports for statistical analysis. You may use this diagram to impart professional appearance to your presentations.
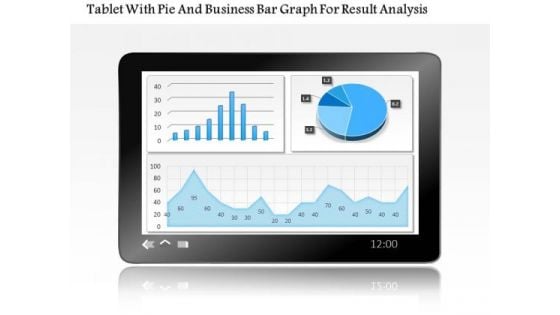
Business Diagram Tablet With Pie And Business Bar Graph For Result Analysis PowerPoint Slide
This PowerPoint template displays technology gadgets with various business charts. Use this diagram slide, in your presentations to make business reports for statistical analysis. You may use this diagram to impart professional appearance to your presentations.
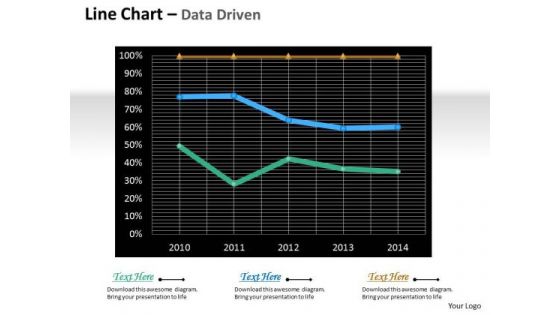
Multivariate Data Analysis Driven Line Chart For Market Survey PowerPoint Slides Templates
Rake In The Dough With
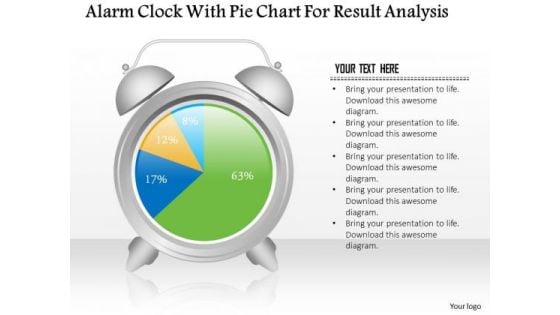
Business Diagram Alarm Clock With Pie Chart For Result Analysis PowerPoint Slide
This business slide displays alarm clock with pie chart. This diagram is a data visualization tool that gives you a simple way to present statistical information. This slide helps your audience examine and interpret the data you present.
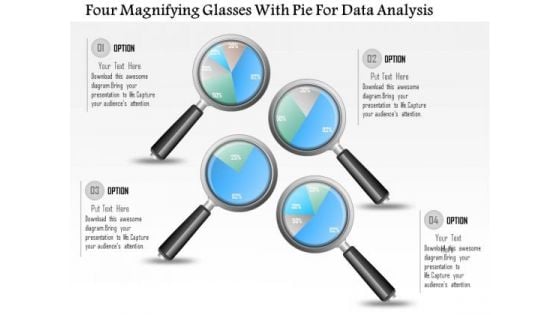
Business Diagram Four Magnifying Glasses With Pie For Data Analysis PowerPoint Slide
This business diagram displays graphic of pie charts in shape of magnifying glasses This business slide is suitable to present and compare business data. Use this diagram to build professional presentations for your viewers.

Business Diagram Four Pie Chart For Data Driven Result Analysis Of Business PowerPoint Slide
This business diagram displays graphic of pie charts in shape of flasks. This business slide is suitable to present and compare business data. Use this diagram to build professional presentations for your viewers.

Data Analysis In Excel 3d Column Chart To Represent Information PowerPoint Templates
Rake In The Dough With
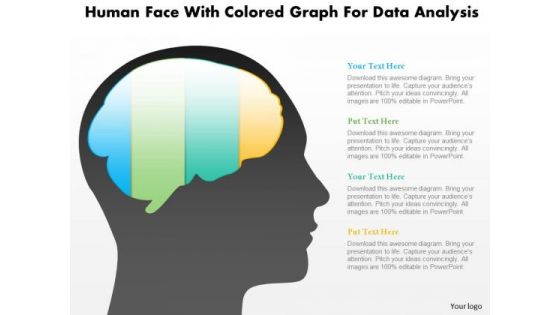
Business Diagram Human Face With Colored Graph For Data Analysis PowerPoint Slide
This diagram displays human face graphic with colored graph. This diagram can be used to represent strategy, planning, thinking of business plan. Display business options in your presentations by using this creative diagram.
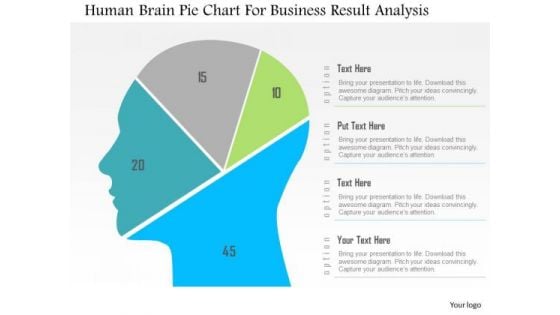
Business Diagram Human Brain Pie Chart For Business Result Analysis PowerPoint Slide
This diagram displays human face graphic divided into sections. This section can be used for data display. Use this diagram to build professional presentations for your viewers.
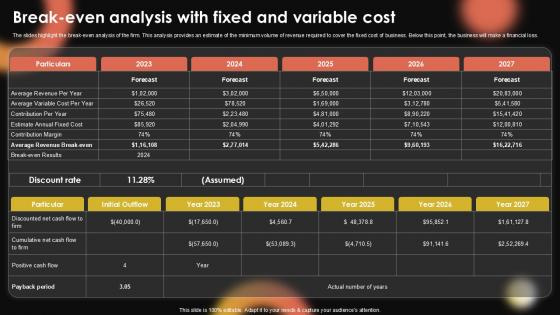
Break Even Analysis With Fixed Sample Pentagram Business Plan PPT Template BP SS V
The slides highlight the break-even analysis of the firm. This analysis provides an estimate of the minimum volume of revenue required to cover the fixed cost of business. Below this point, the business will make a financial loss. Create an editable Break Even Analysis With Fixed Sample Pentagram Business Plan PPT Template BP SS V that communicates your idea and engages your audience. Whether you are presenting a business or an educational presentation, pre-designed presentation templates help save time. Break Even Analysis With Fixed Sample Pentagram Business Plan PPT Template BP SS V is highly customizable and very easy to edit, covering many different styles from creative to business presentations. Slidegeeks has creative team members who have crafted amazing templates. So, go and get them without any delay. The slides highlight the break-even analysis of the firm. This analysis provides an estimate of the minimum volume of revenue required to cover the fixed cost of business. Below this point, the business will make a financial loss.
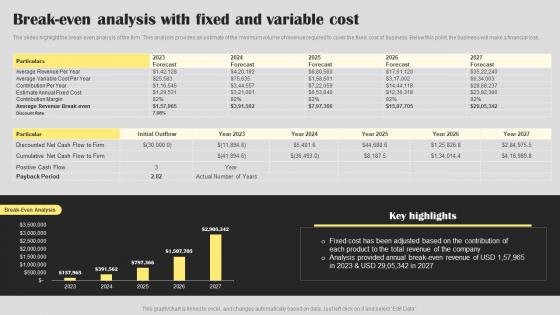
Break Even Analysis Real Estate Agent Business Plan Go To Market Strategy Inspiration Pdf
The slides highlight the break even analysis of the firm. This analysis provides an estimate of the minimum volume of revenue required to cover the fixed cost of business. Below this point, the business will make a financial loss. Create an editable Break Even Analysis Real Estate Agent Business Plan Go To Market Strategy Inspiration Pdf that communicates your idea and engages your audience. Whether you are presenting a business or an educational presentation, pre designed presentation templates help save time. Break Even Analysis Real Estate Agent Business Plan Go To Market Strategy Inspiration Pdf is highly customizable and very easy to edit, covering many different styles from creative to business presentations. Slidegeeks has creative team members who have crafted amazing templates. So, go and get them without any delay. The slides highlight the break even analysis of the firm. This analysis provides an estimate of the minimum volume of revenue required to cover the fixed cost of business. Below this point, the business will make a financial loss.
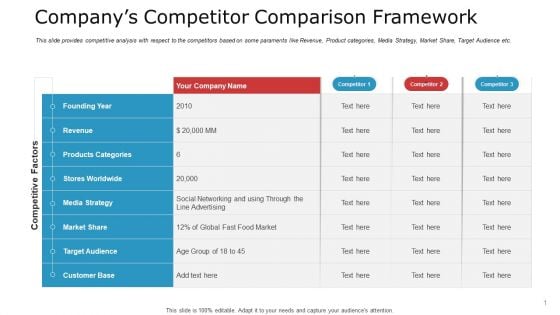
Pitch Deck To Raise Capital From Commercial Financial Institution Using Bonds Companys Competitor Comparison Framework Designs PDF
This slide provides competitive analysis with respect to the competitors based on some paraments like Revenue, Product categories, Media Strategy, Market Share, Target Audience etc.Deliver and pitch your topic in the best possible manner with this pitch deck to raise capital from commercial financial institution using bonds companys competitor comparison framework designs pdf. Use them to share invaluable insights on products categories, stores worldwide, media strategy and impress your audience. This template can be altered and modified as per your expectations. So, grab it now.
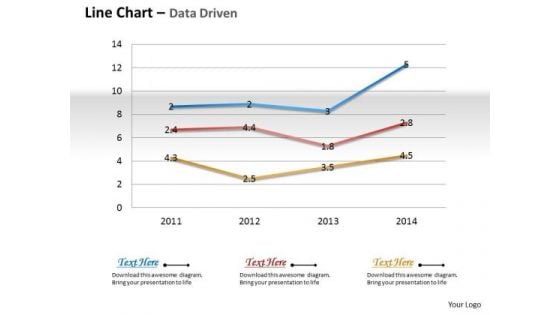
Business Data Analysis Chart Shows Changes Over The Time PowerPoint Templates
Document The Process On Our business data analysis chart shows changes over the time Powerpoint Templates. Make A Record Of Every Detail.
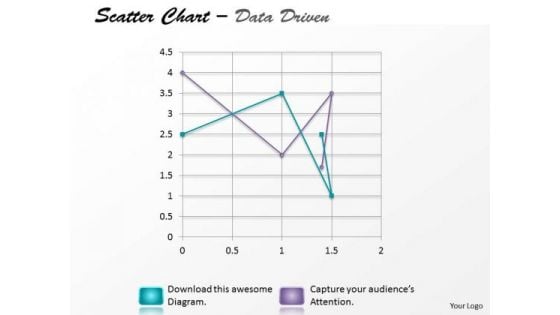
Data Analysis Excel Driven Multiple Series Scatter Chart PowerPoint Slides Templates
Your Listeners Will Never Doodle. Our data analysis excel driven multiple series scatter chart powerpoint slides Templates Will Hold Their Concentration.
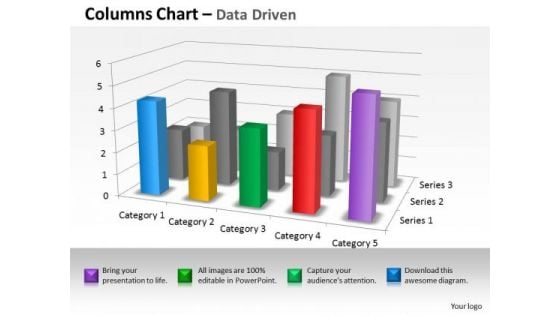
Quantitative Data Analysis 3d Interpretation Of Statistical Quality Control PowerPoint Templates
Land The Idea With Our quantitative data analysis 3d interpretation of statistical quality control Powerpoint Templates . Help It Grow With Your Thoughts.
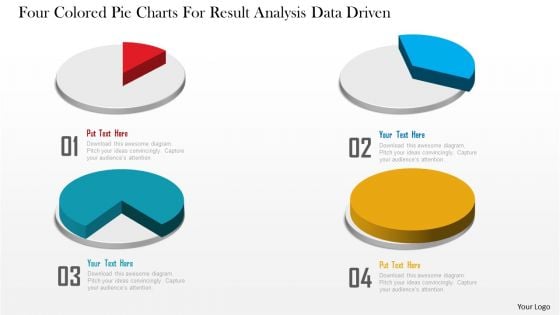
Business Diagram Four Colored Pie Charts For Result Analysis Data Driven PowerPoint Slide
This business diagram displays graphic of pie charts. This business slide is suitable to present and compare business data. Use this diagram to build professional presentations for your viewers.
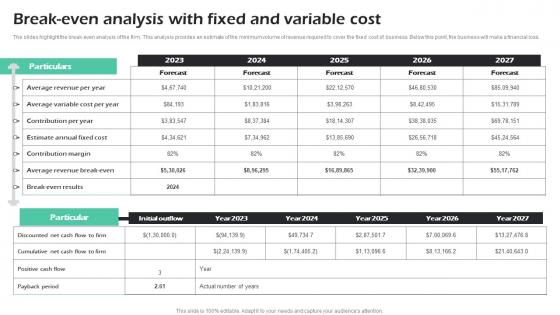
Break Even Analysis With Fixed And Variable Cost Fitness Center Business Plan Clipart Pdf
The slides highlight the break-even analysis of the firm. This analysis provides an estimate of the minimum volume of revenue required to cover the fixed cost of business. Below this point, the business will make a financial loss. Get a simple yet stunning designed Break Even Analysis With Fixed And Variable Cost Fitness Center Business Plan Clipart Pdf It is the best one to establish the tone in your meetings. It is an excellent way to make your presentations highly effective. So, download this PPT today from Slidegeeks and see the positive impacts. Our easy-to-edit Break Even Analysis With Fixed And Variable Cost Fitness Center Business Plan Clipart Pdf can be your go-to option for all upcoming conferences and meetings. So, what are you waiting for Grab this template today. The slides highlight the break-even analysis of the firm. This analysis provides an estimate of the minimum volume of revenue required to cover the fixed cost of business. Below this point, the business will make a financial loss.
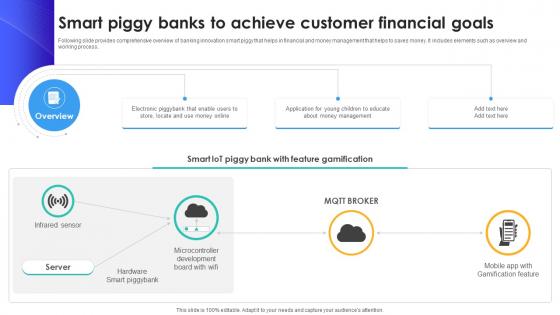
Smart Piggy Banks To Achieve Customer Financial Goals IoT In Banking For Digital Future IoT SS V
Following slide provides comprehensive overview of banking innovation smart piggy that helps in financial and money management that helps to saves money. It includes elements such as overview and working process. This Smart Piggy Banks To Achieve Customer Financial Goals IoT In Banking For Digital Future IoT SS V from Slidegeeks makes it easy to present information on your topic with precision. It provides customization options, so you can make changes to the colors, design, graphics, or any other component to create a unique layout. It is also available for immediate download, so you can begin using it right away. Slidegeeks has done good research to ensure that you have everything you need to make your presentation stand out. Make a name out there for a brilliant performance. Following slide provides comprehensive overview of banking innovation smart piggy that helps in financial and money management that helps to saves money. It includes elements such as overview and working process.
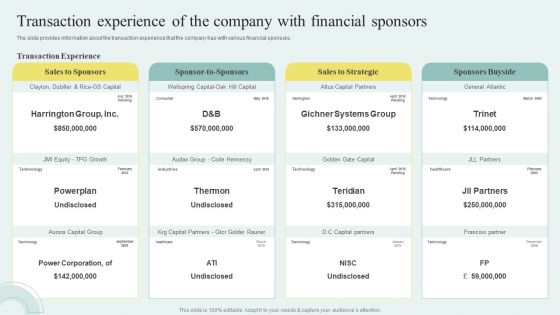
Sell Side M And A Pitchbook With Deal Overview Transaction Experience Of The Company With Financial Sponsors Information PDF
The slide provides information about the transaction experience that the company has with various financial sponsors. Slidegeeks is here to make your presentations a breeze with Sell Side M And A Pitchbook With Deal Overview Transaction Experience Of The Company With Financial Sponsors Information PDF With our easy to use and customizable templates, you can focus on delivering your ideas rather than worrying about formatting. With a variety of designs to choose from, you are sure to find one that suits your needs. And with animations and unique photos, illustrations, and fonts, you can make your presentation pop. So whether you are giving a sales pitch or presenting to the board, make sure to check out Slidegeeks first.
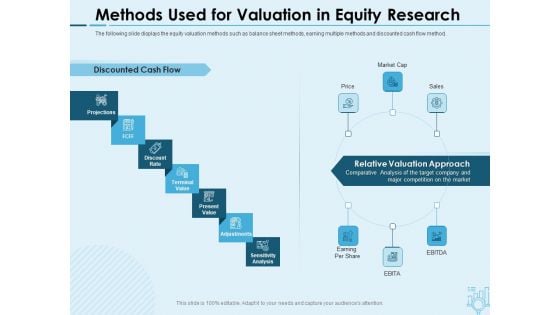
Assessing Stocks In Financial Market Methods Used For Valuation In Equity Research Ppt PowerPoint Presentation Gallery Summary PDF
Presenting this set of slides with name assessing stocks in financial market methods used for valuation in equity research ppt powerpoint presentation gallery summary pdf. This is a seven stage process. The stages in this process are projections, discount rate, present value, sensitivity analysis, sales, marketing, price. This is a completely editable PowerPoint presentation and is available for immediate download. Download now and impress your audience.
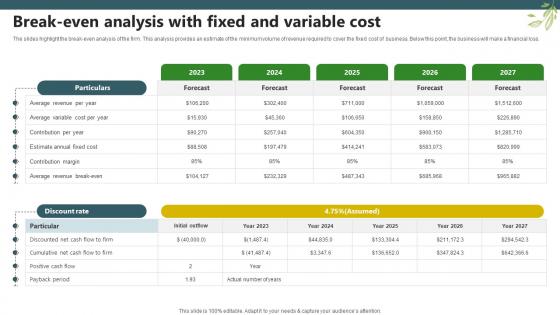
Sample Trugreen Business Plan Break Even Analysis With Fixed And Variable Cost BP SS V
The slides highlight the break-even analysis of the firm. This analysis provides an estimate of the minimum volume of revenue required to cover the fixed cost of business. Below this point, the business will make a financial loss. Create an editable Sample Trugreen Business Plan Break Even Analysis With Fixed And Variable Cost BP SS V that communicates your idea and engages your audience. Whether you are presenting a business or an educational presentation, pre-designed presentation templates help save time. Sample Trugreen Business Plan Break Even Analysis With Fixed And Variable Cost BP SS V is highly customizable and very easy to edit, covering many different styles from creative to business presentations. Slidegeeks has creative team members who have crafted amazing templates. So, go and get them without any delay. The slides highlight the break-even analysis of the firm. This analysis provides an estimate of the minimum volume of revenue required to cover the fixed cost of business. Below this point, the business will make a financial loss.

Creative Agency Business Plan Break Even Analysis With Fixed And Variable Cost BP SS V
The slides highlight the break-even analysis of the firm. This analysis provides an estimate of the minimum volume of revenue required to cover the fixed cost of business. Below this point, the business will make a financial loss. Create an editable Creative Agency Business Plan Break Even Analysis With Fixed And Variable Cost BP SS V that communicates your idea and engages your audience. Whether you are presenting a business or an educational presentation, pre-designed presentation templates help save time. Creative Agency Business Plan Break Even Analysis With Fixed And Variable Cost BP SS V is highly customizable and very easy to edit, covering many different styles from creative to business presentations. Slidegeeks has creative team members who have crafted amazing templates. So, go and get them without any delay. The slides highlight the break-even analysis of the firm. This analysis provides an estimate of the minimum volume of revenue required to cover the fixed cost of business. Below this point, the business will make a financial loss.

Effective Break Even Analysis For Understanding Fashion Startup Roadmap Plan Ppt Sample BP SS V
The slides highlight the break-even analysis of the firm. This analysis provides an estimate of the minimum volume of revenue required to cover the fixed cost of business, below this point the business will make a financial loss. Get a simple yet stunning designed Effective Break Even Analysis For Understanding Fashion Startup Roadmap Plan Ppt Sample BP SS V It is the best one to establish the tone in your meetings. It is an excellent way to make your presentations highly effective. So, download this PPT today from Slidegeeks and see the positive impacts. Our easy-to-edit Effective Break Even Analysis For Understanding Fashion Startup Roadmap Plan Ppt Sample BP SS V can be your go-to option for all upcoming conferences and meetings. So, what are you waiting for Grab this template today. The slides highlight the break-even analysis of the firm. This analysis provides an estimate of the minimum volume of revenue required to cover the fixed cost of business, below this point the business will make a financial loss.


 Continue with Email

 Home
Home


