financial dashboard
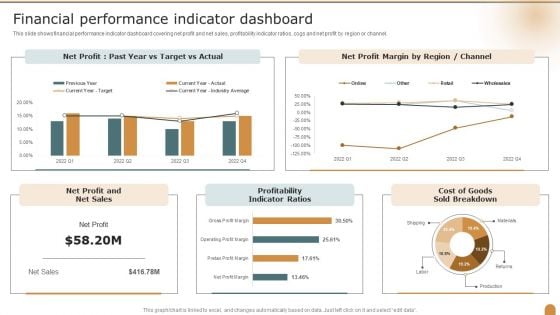
Financial Performance Indicator Dashboard Company Performance Evaluation Using KPI Structure PDF
This slide shows financial performance indicator dashboard covering net profit and net sales, profitability indicator ratios, cogs and net profit by region or channel. Deliver and pitch your topic in the best possible manner with this Financial Performance Indicator Dashboard Company Performance Evaluation Using KPI Structure PDF. Use them to share invaluable insights on Financial Performance, Indicator Dashboard, Profitability Indicator and impress your audience. This template can be altered and modified as per your expectations. So, grab it now.
Ways To Enhance Organizations Profitability Financial Performance Tracking Dashboard Slides PDF
This slide presents the dashboard which will help firm in tracking the financial performance. This dashboard displays number of customers, vendors and revenues generated, expenses and profit incurred. Deliver and pitch your topic in the best possible manner with this ways to enhance organizations profitability financial performance tracking dashboard slides pdf Use them to share invaluable insights on asset rationalization, adjusting liability, capital moderation and impress your audience. This template can be altered and modified as per your expectations. So, grab it now.
Strategic Plan For Corporate Recovery Financial Performance Tracking Dashboard Summary PDF
This slide presents the dashboard which will help firm in tracking the financial performance. This dashboard displays number of customers, vendors and revenues generated, expenses and profit incurred. Deliver an awe inspiring pitch with this creative strategic plan for corporate recovery financial performance tracking dashboard summary pdf bundle. Topics like performance, profit, revenue, expense, customers can be discussed with this completely editable template. It is available for immediate download depending on the needs and requirements of the user.
Strawman Proposal For Enterprise Critical Thinking Financial Performance Tracking Dashboard Demonstration PDF
This slide presents the dashboard which will help firm in tracking the financial performance. This dashboard displays number of customers, vendors and revenues generated, expenses and profit incurred. Deliver an awe inspiring pitch with this creative strawman proposal for enterprise critical thinking financial performance tracking dashboard demonstration pdf bundle. Topics like current year to date, revenue, expense, profit can be discussed with this completely editable template. It is available for immediate download depending on the needs and requirements of the user.
Manual To Develop Strawman Proposal Financial Performance Tracking Dashboard Pictures PDF
This slide presents the dashboard which will help firm in tracking the financial performance. This dashboard displays number of customers, vendors and revenues generated, expenses and profit incurred. Deliver and pitch your topic in the best possible manner with this Manual To Develop Strawman Proposal Financial Performance Tracking Dashboard Pictures PDF. Use them to share invaluable insights on Profit, Revenue, Expense and impress your audience. This template can be altered and modified as per your expectations. So, grab it now.
Cyber Security Administration In Organization Financial Performance Tracking Dashboard Microsoft PDF
This slide presents the dashboard which will help firm in tracking the fiscal performance. This dashboard displays revenues and expenses trends and payment received analysis. Deliver and pitch your topic in the best possible manner with this cyber security administration in organization financial performance tracking dashboard microsoft pdf. Use them to share invaluable insights on financial performance tracking dashboard and impress your audience. This template can be altered and modified as per your expectations. So, grab it now.
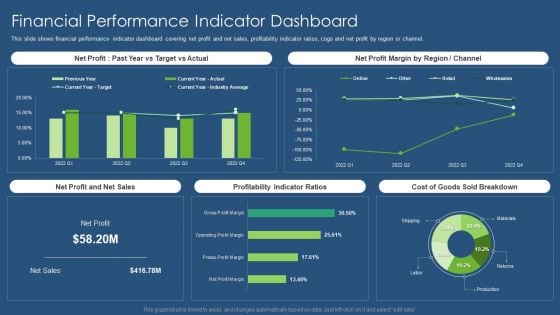
Sustainability Calculation With KPI Financial Performance Indicator Dashboard Infographics PDF Template PDF
This slide shows financial performance indicator dashboard covering net profit and net sales, profitability indicator ratios, cogs and net profit by region or channel. Deliver an awe inspiring pitch with this creative sustainability calculation with kpi financial performance indicator dashboard infographics pdf bundle. Topics like net profit margin, net profit and net sales, profitability indicator ratios, sold breakdown can be discussed with this completely editable template. It is available for immediate download depending on the needs and requirements of the user.
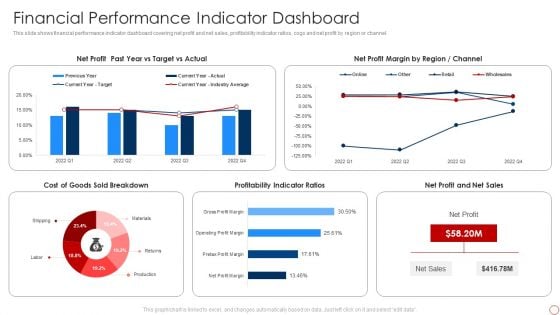
Kpis For Evaluating Business Sustainability Financial Performance Indicator Dashboard Demonstration PDF
This slide shows financial performance indicator dashboard covering net profit and net sales, profitability indicator ratios, cogs and net profit by region or channel. Deliver and pitch your topic in the best possible manner with this Kpis For Evaluating Business Sustainability Financial Performance Indicator Dashboard Demonstration PDF. Use them to share invaluable insights on Net Profit, Net Profit Margin, Profitability Indicator Ratios and impress your audience. This template can be altered and modified as per your expectations. So, grab it now.
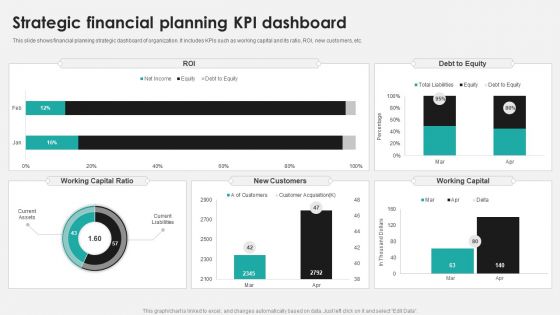
Strategic Financial Planning KPI Dashboard Ppt PowerPoint Presentation Layouts Background Designs PDF
This slide shows financial planning strategic dashboard of organization. It includes KPIs such as working capital and its ratio, ROI, new customers, etc. Pitch your topic with ease and precision using this Strategic Financial Planning KPI Dashboard Ppt PowerPoint Presentation Layouts Background Designs PDF. This layout presents information on New Customers, Working Capital, Debt Equity. It is also available for immediate download and adjustment. So, changes can be made in the color, design, graphics or any other component to create a unique layout.
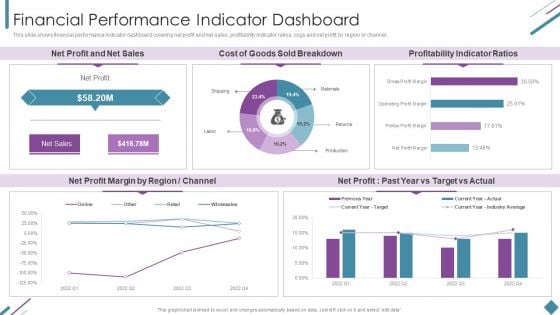
Metrics To Measure Business Performance Financial Performance Indicator Dashboard Pictures PDF
This slide shows financial performance indicator dashboard covering net profit and net sales, profitability indicator ratios, cogs and net profit by region or channel. Deliver an awe inspiring pitch with this creative Metrics To Measure Business Performance Financial Performance Indicator Dashboard Pictures PDF bundle. Topics like Net Profit, Net Sales, Cost Goods, Sold Breakdown can be discussed with this completely editable template. It is available for immediate download depending on the needs and requirements of the user.
Enhancing Financial Institution Operations Dashboard Tracking Customer Retention Rate Partner Introduction PDF
Deliver an awe inspiring pitch with this creative enhancing financial institution operations dashboard tracking customer retention rate partner introduction pdf bundle. Topics like dashboard tracking customer retention rate can be discussed with this completely editable template. It is available for immediate download depending on the needs and requirements of the user.
Enhancing Financial Institution Operations Dashboard Tracking Customer Retention Rate Ideas PDF
Deliver and pitch your topic in the best possible manner with this enhancing financial institution operations dashboard tracking customer retention rate ideas pdf. Use them to share invaluable insights on dashboard tracking customer retention rate and impress your audience. This template can be altered and modified as per your expectations. So, grab it now.
Enhancing Financial Institution Operations Dashboard Tracking Customer Satisfaction Score Icons PDF
Deliver an awe inspiring pitch with this creative enhancing financial institution operations dashboard tracking customer satisfaction score icons pdf bundle. Topics like dashboard tracking customer satisfaction score can be discussed with this completely editable template. It is available for immediate download depending on the needs and requirements of the user.
Enhancing Financial Institution Operations Dashboard Tracking Total Loans And Deposits Graphics PDF
Deliver an awe inspiring pitch with this creative enhancing financial institution operations dashboard tracking total loans and deposits graphics pdf bundle. Topics like dashboard tracking total loans and deposits can be discussed with this completely editable template. It is available for immediate download depending on the needs and requirements of the user.
Enhancing Financial Institution Operations Dashboard Tracking Customer Activities And Revenue Generated Microsoft PDF
Deliver and pitch your topic in the best possible manner with this enhancing financial institution operations dashboard tracking customer activities and revenue generated microsoft pdf. Use them to share invaluable insights on target, revenue, value, achievement and impress your audience. This template can be altered and modified as per your expectations. So, grab it now.
Annual Financial Performance Administration Dashboard With Key Metrics Ppt PowerPoint Presentation Icon Visual Aids PDF
Showcasing this set of slides titled Annual Financial Performance Administration Dashboard With Key Metrics Ppt PowerPoint Presentation Icon Visual Aids PDF. The topics addressed in these templates are Accounts Receivable, Accounts Payable, Planned Profit Margin. All the content presented in this PPT design is completely editable. Download it and make adjustments in color, background, font etc. as per your unique business setting.
Enhancing Financial Institution Operations Dashboard Tracking Online Banking Activities Rules PDF
Deliver and pitch your topic in the best possible manner with this enhancing financial institution operations dashboard tracking online banking activities rules pdf. Use them to share invaluable insights on management, service, access and impress your audience. This template can be altered and modified as per your expectations. So, grab it now.
Strategic Corporate Planning To Attain Corporate Financial Performance Tracking Dashboard Icons PDF
This slide provides information regarding dashboard utilized by firm to monitor financial performance. The performance is tracked through revenues generated, vendors associated, profit generated, etc. This Strategic Corporate Planning To Attain Corporate Financial Performance Tracking Dashboard Icons PDF is perfect for any presentation, be it in front of clients or colleagues. It is a versatile and stylish solution for organizing your meetings. The Strategic Corporate Planning To Attain Corporate Financial Performance Tracking Dashboard Icons PDF features a modern design for your presentation meetings. The adjustable and customizable slides provide unlimited possibilities for acing up your presentation. Slidegeeks has done all the homework before launching the product for you. So, do not wait, grab the presentation templates today
Risk Management For Organization Essential Assets Financial Performance Tracking Dashboard Designs PDF
This slide presents the dashboard which will help firm in tracking the fiscal performance. This dashboard displays revenues and expenses trends and payment received analysis. Deliver an awe inspiring pitch with this creative risk management for organization essential assets financial performance tracking dashboard designs pdf bundle. Topics like receivables analysis, revenue and expense trends can be discussed with this completely editable template. It is available for immediate download depending on the needs and requirements of the user.
Corporate Security And Risk Management Financial Performance Tracking Dashboard Introduction PDF
This slide presents the dashboard which will help firm in tracking the fiscal performance. This dashboard displays revenues and expenses trends and payment received analysis. Deliver an awe inspiring pitch with this creative corporate security and risk management financial performance tracking dashboard introduction pdf bundle. Topics like revenue and expense trends, receivables analysis can be discussed with this completely editable template. It is available for immediate download depending on the needs and requirements of the user.
Corporate Financial Performance Tracking Dashboard Ppt PowerPoint Presentation File Pictures PDF
This slide provides information regarding dashboard utilized by firm to monitor financial performance. The performance is tracked through revenues generated, vendors associated, profit generated, etc. Find a pre designed and impeccable Corporate Financial Performance Tracking Dashboard Ppt PowerPoint Presentation File Pictures PDF. The templates can ace your presentation without additional effort. You can download these easy to edit presentation templates to make your presentation stand out from others. So, what are you waiting for Download the template from Slidegeeks today and give a unique touch to your presentation.
Company Financial Performance Indicators Dashboard With Working Capital And Cash Conversion Icons PDF
This slide shows dashboard of finance KPIs . It covers working capital, cash conversion cycle, vendor payment error rate ,current assets and liabilities. Showcasing this set of slides titled Company Financial Performance Indicators Dashboard With Working Capital And Cash Conversion Icons PDF. The topics addressed in these templates are Current Working Capital, Current Liabilities, Working Capital. All the content presented in this PPT design is completely editable. Download it and make adjustments in color, background, font etc. as per your unique business setting.
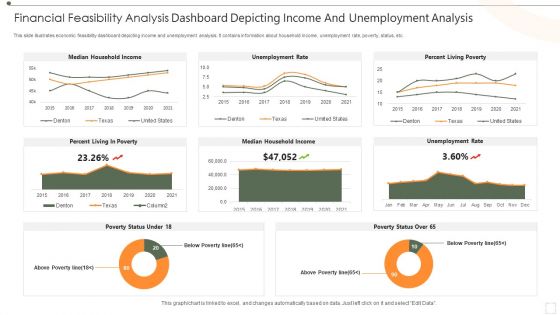
Financial Feasibility Analysis Dashboard Depicting Income And Unemployment Analysis Download PDF
This slide illustrates economic feasibility dashboard depicting income and unemployment analysis. It contains information about household income, unemployment rate, poverty, status, etc. Pitch your topic with ease and precision using this Financial Feasibility Analysis Dashboard Depicting Income And Unemployment Analysis Download PDF. This layout presents information on Median Household Income, Unemployment Rate, Percent Living Poverty. It is also available for immediate download and adjustment. So, changes can be made in the color, design, graphics or any other component to create a unique layout.
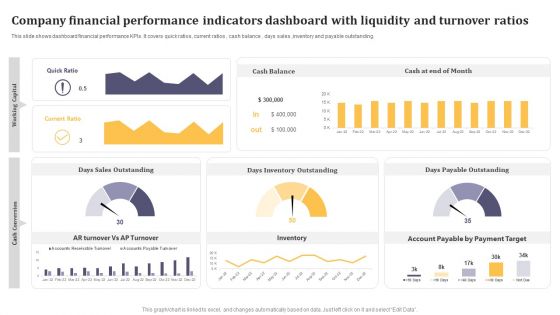
Company Financial Performance Indicators Dashboard With Liquidity And Turnover Ratios Formats PDF
This graph or chart is linked to excel, and changes automatically based on data. Just left click on it and select Edit Data. Pitch your topic with ease and precision using this Company Financial Performance Indicators Dashboard With Liquidity And Turnover Ratios Formats PDF. This layout presents information on Cash Balance, Days Inventory Outstanding, Days Payable Outstanding. It is also available for immediate download and adjustment. So, changes can be made in the color, design, graphics or any other component to create a unique layout.
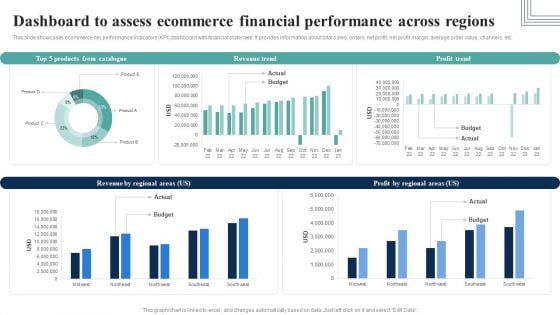
Dashboard To Assess Ecommerce Financial Performance Across Regions Infographics PDF
This slide showcases ecommerce key performance indicators KPI dashboard with financial statement. It provides information about total sales, orders, net profit, net profit margin, average order value, channels, etc.Here you can discover an assortment of the finest PowerPoint and Google Slides templates. With these templates, you can create presentations for a variety of purposes while simultaneously providing your audience with an eye-catching visual experience. Download Dashboard To Assess Ecommerce Financial Performance Across Regions Infographics PDF to deliver an impeccable presentation. These templates will make your job of preparing presentations much quicker, yet still, maintain a high level of quality. Slidegeeks has experienced researchers who prepare these templates and write high-quality content for you. Later on, you can personalize the content by editing the Dashboard To Assess Ecommerce Financial Performance Across Regions Infographics PDF.
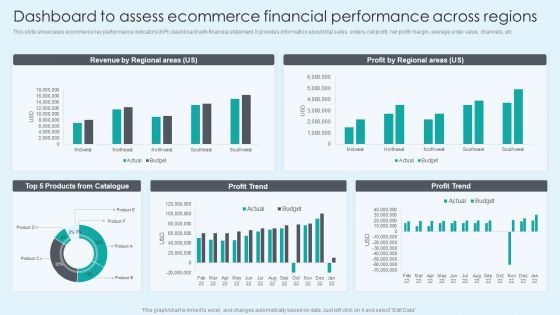
Dashboard To Assess Ecommerce Financial Performance Across Regions Themes PDF
This slide showcases ecommerce key performance indicators KPI dashboard with financial statement. It provides information about total sales, orders, net profit, net profit margin, average order value, channels, etc. Here you can discover an assortment of the finest PowerPoint and Google Slides templates. With these templates, you can create presentations for a variety of purposes while simultaneously providing your audience with an eye catching visual experience. Download Dashboard To Assess Ecommerce Financial Performance Across Regions Themes PDF to deliver an impeccable presentation. These templates will make your job of preparing presentations much quicker, yet still, maintain a high level of quality. Slidegeeks has experienced researchers who prepare these templates and write high quality content for you. Later on, you can personalize the content by editing the Dashboard To Assess Ecommerce Financial Performance Across Regions Themes PDF.
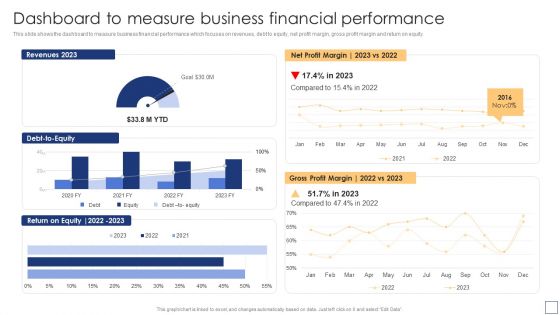
Dashboard To Measure Business Financial Performance Summary PDF
This slide shows the dashboard to measure business financial performance which focuses on revenues, debt to equity, net profit margin, gross profit margin and return on equity. Are you searching for a Dashboard To Measure Business Financial Performance Summary PDF that is uncluttered, straightforward, and original Its easy to edit, and you can change the colors to suit your personal or business branding. For a presentation that expresses how much effort youve put in, this template is ideal With all of its features, including tables, diagrams, statistics, and lists, its perfect for a business plan presentation. Make your ideas more appealing with these professional slides. Download Dashboard To Measure Business Financial Performance Summary PDF from Slidegeeks today.
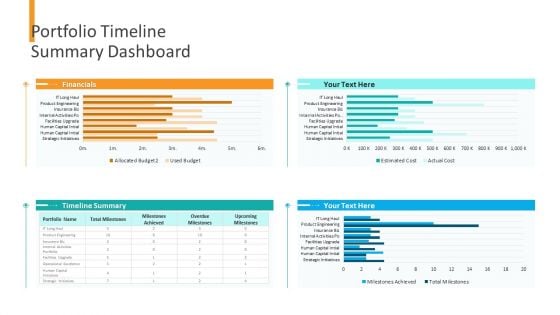
Organizational Financial Assets Assessment Portfolio Timeline Summary Dashboard Clipart PDF
Deliver and pitch your topic in the best possible manner with this organizational financial assets assessment portfolio timeline summary dashboard clipart pdf. Use them to share invaluable insights on financials, timeline summary and impress your audience. This template can be altered and modified as per your expectations. So, grab it now.
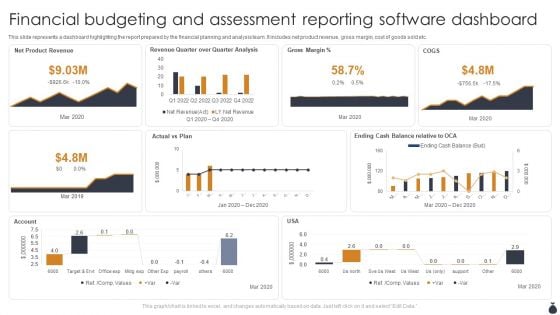
Financial Budgeting And Assessment Reporting Software Dashboard Template PDF
This slide represents a dashboard highlighting the report prepared by the financial planning and analysis team. It includes net product revenue, gross margin, cost of goods sold etc. Showcasing this set of slides titled Financial Budgeting And Assessment Reporting Software Dashboard Template PDF. The topics addressed in these templates are Net Product Revenue, Actual Vs Plan, Account. All the content presented in this PPT design is completely editable. Download it and make adjustments in color, background, font etc. as per your unique business setting.

Organizational Financial Assets Assessment Portfolio Summary Management Dashboard Topics PDF
Deliver an awe-inspiring pitch with this creative organizational financial assets assessment portfolio summary management dashboard topics pdf. bundle. Topics like portfolio owner, allocated budget across portfolios, used budget across portfolios can be discussed with this completely editable template. It is available for immediate download depending on the needs and requirements of the user.
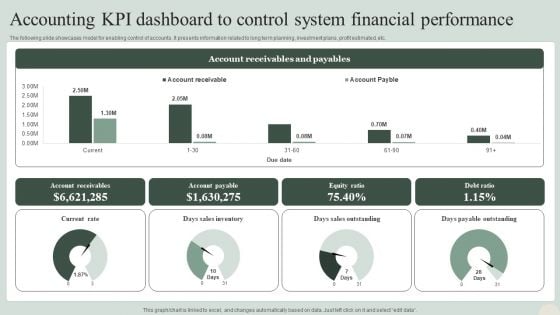
Accounting KPI Dashboard To Control System Financial Performance Formats PDF
The following slide showcases model for enabling control of accounts. It presents information related to long term planning, investment plans, profit estimated, etc. Pitch your topic with ease and precision using this Accounting KPI Dashboard To Control System Financial Performance Formats PDF. This layout presents information on Sales Outstanding, Payable Outstanding, Sales Inventory. It is also available for immediate download and adjustment. So, changes can be made in the color, design, graphics or any other component to create a unique layout.
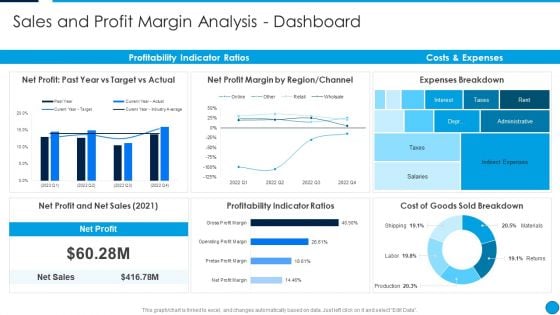
Summary Financial Sales And Profit Margin Analysis Dashboard Pictures PDF
This graph or chart is linked to excel, and changes automatically based on data. Just left click on it and select Edit Data. Deliver an awe inspiring pitch with this creative Summary Financial Sales And Profit Margin Analysis Dashboard Pictures PDF bundle. Topics like Net Profit, Past Year Vs Target Vs Actual, Net Profit Margin By Region, Channel, Expenses Breakdown, Costs And Expenses, Profitability Indicator Ratios can be discussed with this completely editable template. It is available for immediate download depending on the needs and requirements of the user.
Executive Dashboards For Tracking Financial Health Of Enterprise Diagrams PDF
This slide represents the CEO dashboard to track the financial health of an organization. It includes key performance indicators such as revenue, expenses, activity ratio, gross profit margin, EBIT etc. Pitch your topic with ease and precision using this Executive Dashboards For Tracking Financial Health Of Enterprise Diagrams PDF. This layout presents information on Revenue, Expense, Activity Ratio. It is also available for immediate download and adjustment. So, changes can be made in the color, design, graphics or any other component to create a unique layout.
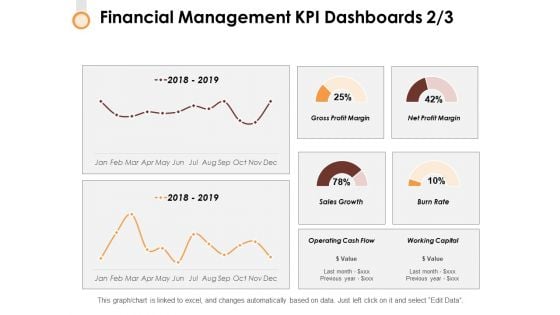
Financial Management Kpi Dashboards 2 3 Ppt PowerPoint Presentation Infographic Template Format Ideas
This is a financial management kpi dashboards 2 3 ppt powerpoint presentation infographic template format ideas. This is a two stage process. The stages in this process are finance, strategy, marketing, compare, business.
Financial Management Kpi Dashboards Strategy Ppt Powerpoint Presentation Gallery Graphics Template
This is a financial management kpi dashboards strategy ppt powerpoint presentation gallery graphics template. This is a six stage process. The stages in this process are finance, marketing, management, investment, analysis.
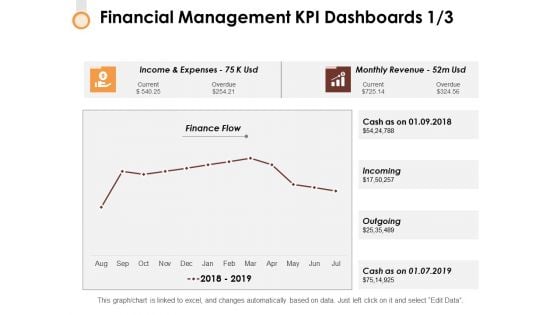
Financial Management Kpi Dashboards 1 3 Ppt PowerPoint Presentation Outline Background
This is a financial management kpi dashboards 1 3 ppt powerpoint presentation outline background. This is a four stage process. The stages in this process are finance, strategy, marketing, compare, business.
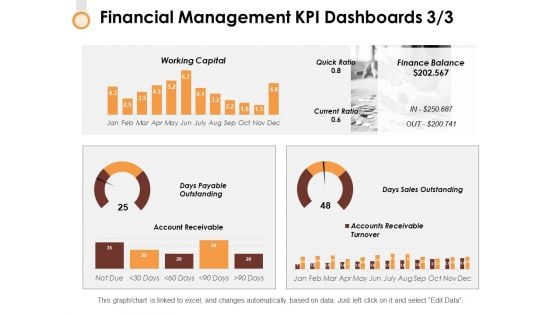
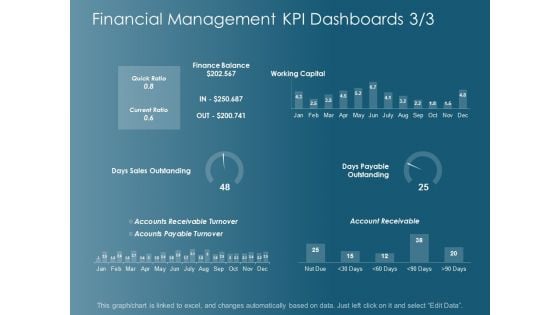
Financial Management Kpi Dashboards 3 3 Ppt PowerPoint Presentation Layouts Graphics Template
This is a financial management kpi dashboards 3 3 ppt powerpoint presentation layouts graphics template. This is a two stage process. The stages in this process are finance, strategy, marketing, compare, business.
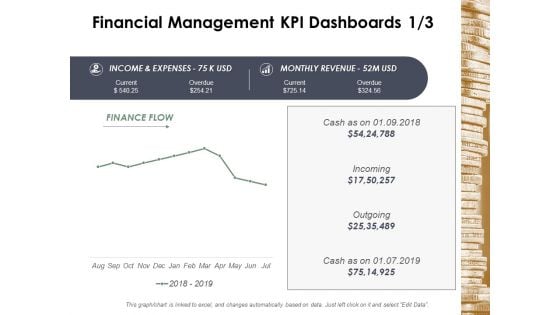
Financial Management Kpi Dashboards Business Ppt Powerpoint Presentation Infographic Template Deck
This is a financial management kpi dashboards business ppt powerpoint presentation infographic template deck. This is a four stage process. The stages in this process are finance, marketing, management, investment, analysis.
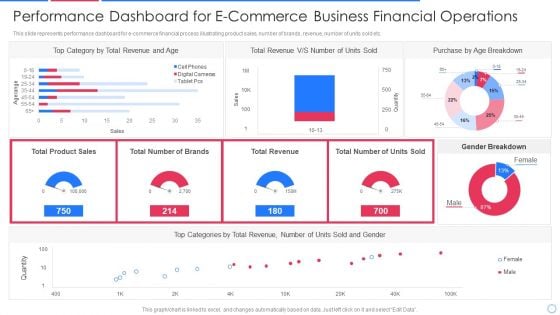
Performance Dashboard For E Commerce Business Financial Operations Infographics PDF
This slide represents performance dashboard for e-commerce financial process illustrating product sales, number of brands, revenue, number of units sold etc.Pitch your topic with ease and precision using this performance dashboard for e commerce business financial operations infographics pdf This layout presents information on category by total revenue, total revenue, purchase by age breakdown It is also available for immediate download and adjustment. So, changes can be made in the color, design, graphics or any other component to create a unique layout.
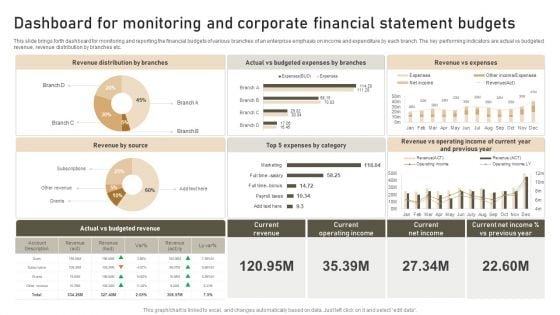
Dashboard For Monitoring And Corporate Financial Statement Budgets Template PDF
This slide brings forth dashboard for monitoring and reporting the financial budgets of various branches of an enterprise emphasis on income and expenditure by each branch. The key performing indicators are actual vs budgeted revenue, revenue distribution by branches etc. Showcasing this set of slides titled Dashboard For Monitoring And Corporate Financial Statement Budgets Template PDF. The topics addressed in these templates are Revenue Distribution, Revenue Source, Revenue Expenses. All the content presented in this PPT design is completely editable. Download it and make adjustments in color, background, font etc. as per your unique business setting.
Dashboard For Cash Flow And Financial KPI Ratio Icons PDF
Showcasing this set of slides titled Dashboard For Cash Flow And Financial KPI Ratio Icons PDF. The topics addressed in these templates are Days Sales Outstanding, Days Payable Outstanding, Return On Assets. All the content presented in this PPT design is completely editable. Download it and make adjustments in color, background, font etc. as per your unique business setting.
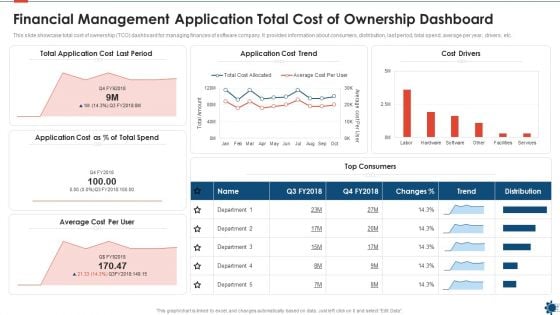
Financial Management Application Total Cost Of Ownership Dashboard Infographics PDF
This slide showcase total cost of ownership TCO dashboard for managing finances of software company. It provides information about consumers, distribution, last period, total spend, average per year, drivers, etc. Showcasing this set of slides titled financial management application total cost of ownership dashboard infographics pdf. The topics addressed in these templates are cost, application. All the content presented in this PPT design is completely editable. Download it and make adjustments in color, background, font etc. as per your unique business setting.
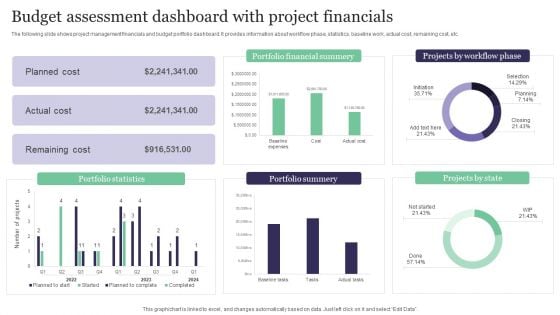
Budget Assessment Dashboard With Project Financials Rules PDF
The following slide shows project management financials and budget portfolio dashboard. It provides information about workflow phase, statistics, baseline work, actual cost, remaining cost, etc. Showcasing this set of slides titled Budget Assessment Dashboard With Project Financials Rules PDF. The topics addressed in these templates are Portfolio Statistics, Portfolio Summery, Projects By State. All the content presented in this PPT design is completely editable. Download it and make adjustments in color, background, font etc. as per your unique business setting.
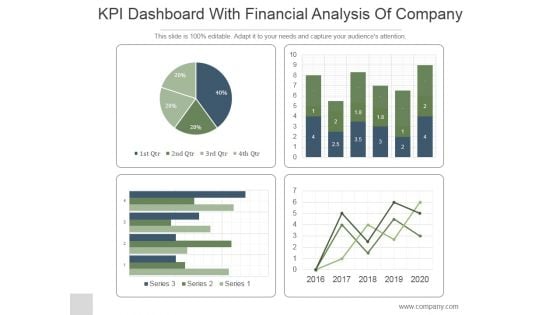
KPI Dashboard With Financial Analysis Of Company Ppt PowerPoint Presentation Backgrounds
This is a kpi dashboard with financial analysis of company ppt powerpoint presentation backgrounds. This is a four stage process. The stages in this process are business, strategy, marketing, line graph, finance.
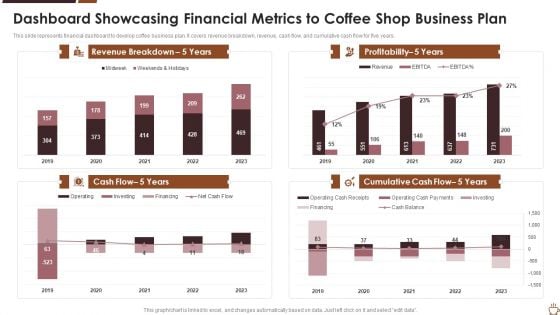
Dashboard Showcasing Financial Metrics To Coffee Shop Business Plan Background PDF
This slide represents financial dashboard to develop coffee business plan. It covers revenue breakdown, revenue, cash flow, and cumulative cash flow for five years. Showcasing this set of slides titled dashboard showcasing financial metrics to coffee shop business plan background pdf. The topics addressed in these templates are dashboard showcasing financial metrics to coffee shop business plan. All the content presented in this PPT design is completely editable. Download it and make adjustments in color, background, font etc. as per your unique business setting.
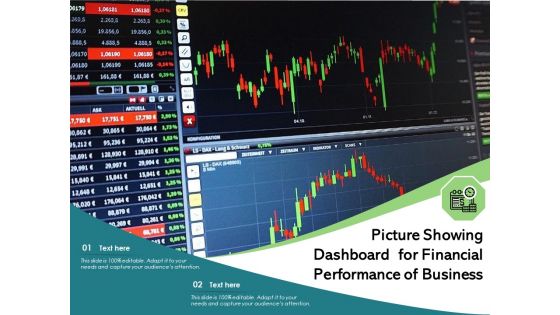
Picture Showing Dashboard For Financial Performance Of Business Ppt PowerPoint Presentation Portfolio Master Slide PDF
Presenting picture showing dashboard for financial performance of business ppt powerpoint presentation portfolio master slide pdf to dispense important information. This template comprises two stages. It also presents valuable insights into the topics including picture showing dashboard for financial performance of business. This is a completely customizable PowerPoint theme that can be put to use immediately. So, download it and address the topic impactfully.
Dashboard For Financial Summary Vector Icon Ppt PowerPoint Presentation Infographic Template Design Inspiration PDF
Presenting this set of slides with name dashboard for financial summary vector icon ppt powerpoint presentation infographic template design inspiration pdf. This is a three stage process. The stages in this process are dashboard for financial summary vector icon. This is a completely editable PowerPoint presentation and is available for immediate download. Download now and impress your audience.

Online Financial Transaction Mobile Banking Dashboard Ppt PowerPoint Presentation Gallery Professional PDF
Persuade your audience using this online financial transaction mobile banking dashboard ppt powerpoint presentation gallery professional pdf. This PPT design covers three stages, thus making it a great tool to use. It also caters to a variety of topics including online financial transaction mobile banking dashboard. Download this PPT design now to present a convincing pitch that not only emphasizes the topic but also showcases your presentation skills.
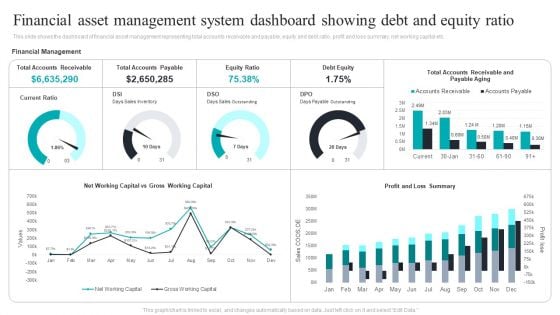
Financial Asset Management System Dashboard Showing Debt And Equity Ratio Graphics PDF
This slide shows the dashboard of financial asset management representing total accounts receivable and payable, equity and debt ratio, profit and loss summary, net working capital etc. Showcasing this set of slides titled Financial Asset Management System Dashboard Showing Debt And Equity Ratio Graphics PDF. The topics addressed in these templates are Financial Asset, Management System, Debt And Equity Ratio. All the content presented in this PPT design is completely editable. Download it and make adjustments in color, background, font etc. as per your unique business setting.
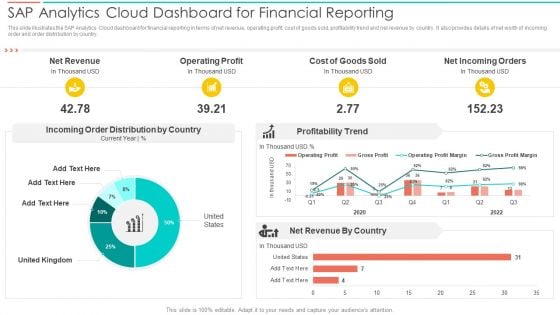
SAC Planning And Implementation SAP Analytics Cloud Dashboard For Financial Reporting Introduction PDF
This slide illustrates the SAP Analytics Cloud dashboard for financial reporting in terms of net revenue, operating profit, cost of goods sold, profitability trend and net revenue by country. It also provides details of net worth of incoming order and order distribution by country. Deliver an awe inspiring pitch with this creative SAC Planning And Implementation SAP Analytics Cloud Dashboard For Financial Reporting Introduction PDF bundle. Topics like Net Revenue, Operating Profit, Cost Goods Sold can be discussed with this completely editable template. It is available for immediate download depending on the needs and requirements of the user.
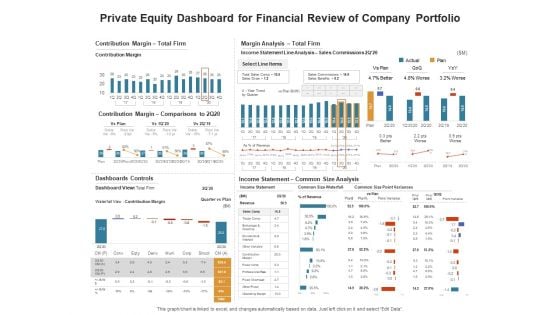
Venture Capitalist Control Board Private Equity Dashboard For Financial Review Of Company Portfolio Information PDF
Presenting this set of slides with name venture capitalist control board private equity dashboard for financial review of company portfolio information pdf. The topics discussed in these slides are contribution margin, margin analysis, income statement, dashboards controls. This is a completely editable PowerPoint presentation and is available for immediate download. Download now and impress your audience.
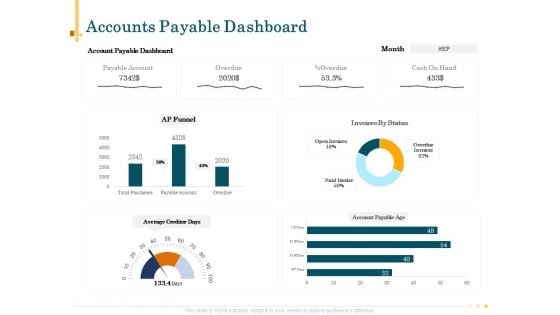
Outsource Bookkeeping Service Manage Financial Transactions Accounts Payable Dashboard Diagrams PDF
Presenting this set of slides with name outsource bookkeeping service manage financial transactions accounts payable dashboard diagrams pdf. The topics discussed in these slide is accounts payable dashboard. This is a completely editable PowerPoint presentation and is available for immediate download. Download now and impress your audience.
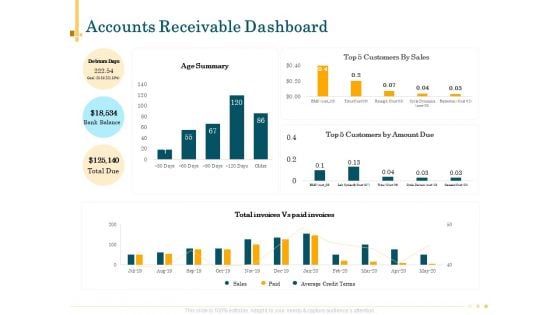
Outsource Bookkeeping Service Manage Financial Transactions Accounts Receivable Dashboard Themes PDF
Presenting this set of slides with name outsource bookkeeping service manage financial transactions accounts receivable dashboard themes pdf. The topics discussed in these slide is accounts receivable dashboard. This is a completely editable PowerPoint presentation and is available for immediate download. Download now and impress your audience.
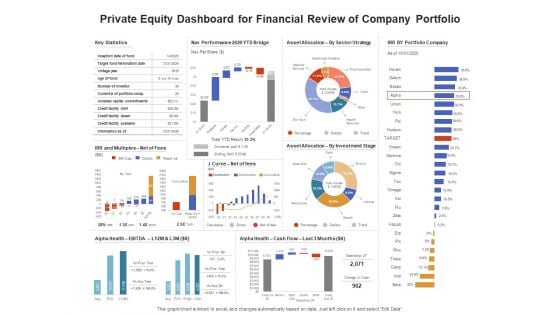
Venture Capitalist Control Board Private Equity Dashboard For Financial Review Of Company Portfolio Plan Elements PDF
Presenting this set of slides with name venture capitalist control board private equity dashboard for financial review of company portfolio plan elements pdf. The topics discussed in these slides are nav performance, key statistics, asset allocation, portfolio company. This is a completely editable PowerPoint presentation and is available for immediate download. Download now and impress your audience.
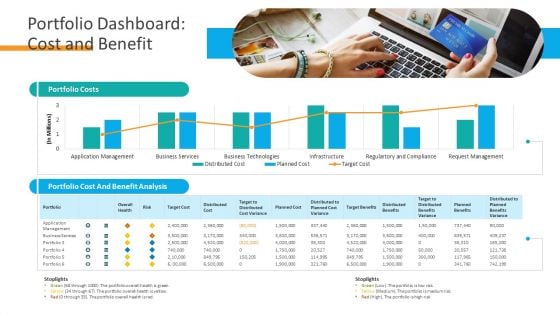
Organizational Financial Assets Assessment Portfolio Dashboard Cost And Benefit Information PDF
Deliver and pitch your topic in the best possible manner with this organizational financial assets assessment portfolio dashboard cost and benefit information pdf. Use them to share invaluable insights on portfolio costs, portfolio cost and benefit analysis and impress your audience. This template can be altered and modified as per your expectations. So, grab it now.
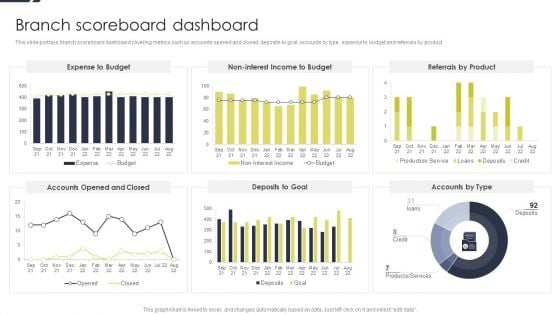
Conducting Monetary Inclusion With Mobile Financial Services Branch Scoreboard Dashboard Sample PDF
This slide portrays branch scoreboard dashboard covering metrics such as accounts opened and closed, deposits to goal, accounts by type, expense to budget and referrals by product. Deliver an awe inspiring pitch with this creative Conducting Monetary Inclusion With Mobile Financial Services Branch Scoreboard Dashboard Sample PDF bundle. Topics like Expense Budget, Referrals Product, Deposits To Goal can be discussed with this completely editable template. It is available for immediate download depending on the needs and requirements of the user.
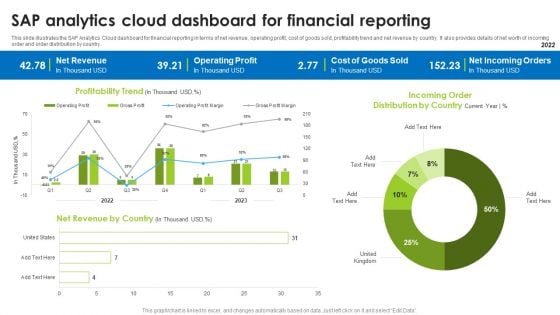
BI Technique For Data Informed Decisions Sap Analytics Cloud Dashboard For Financial Reporting Portrait PDF
This slide illustrates the SAP Analytics Cloud dashboard for financial reporting in terms of net revenue, operating profit, cost of goods sold, profitability trend and net revenue by country. It also provides details of net worth of incoming order and order distribution by country. Coming up with a presentation necessitates that the majority of the effort goes into the content and the message you intend to convey. The visuals of a PowerPoint presentation can only be effective if it supplements and supports the story that is being told. Keeping this in mind our experts created BI Technique For Data Informed Decisions Sap Analytics Cloud Dashboard For Financial Reporting Portrait PDF to reduce the time that goes into designing the presentation. This way, you can concentrate on the message while our designers take care of providing you with the right template for the situation.
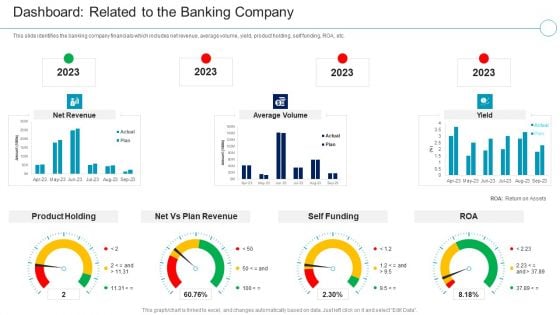
Financial Services Enterprise Transformation Dashboard Related To The Banking Company Information PDF
This slide shows the company financials Total Branches and Total R and D Expenses of ABC Bank. It includes the financials before the implementation of strategies for the years 2019 to 2023 with key notes.Deliver an awe inspiring pitch with this creative Financial Services Enterprise Transformation Dashboard Related To The Banking Company Information PDF bundle. Topics like Company Financials Before The Implementation Of Strategies can be discussed with this completely editable template. It is available for immediate download depending on the needs and requirements of the user.
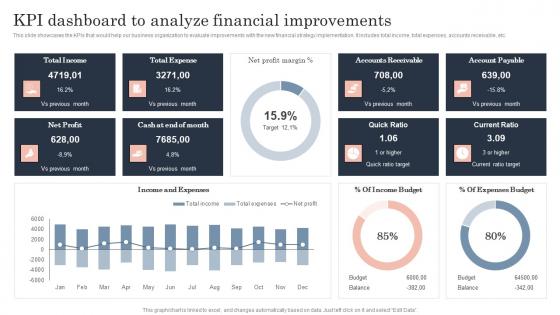
Kpi Dashboard To Analyze Financial Guide To Corporate Financial Growth Plan Designs Pdf
This slide showcases the KPIs that would help our business organization to evaluate improvements with the new financial strategy implementation. It includes total income, total expenses, accounts receivable, etc.Presenting this PowerPoint presentation, titled Kpi Dashboard To Analyze Financial Guide To Corporate Financial Growth Plan Designs Pdf, with topics curated by our researchers after extensive research. This editable presentation is available for immediate download and provides attractive features when used. Download now and captivate your audience. Presenting this Kpi Dashboard To Analyze Financial Guide To Corporate Financial Growth Plan Designs Pdf. Our researchers have carefully researched and created these slides with all aspects taken into consideration. This is a completely customizable Kpi Dashboard To Analyze Financial Guide To Corporate Financial Growth Plan Designs Pdf that is available for immediate downloading. Download now and make an impact on your audience. Highlight the attractive features available with our PPTs. This slide showcases the KPIs that would help our business organization to evaluate improvements with the new financial strategy implementation. It includes total income, total expenses, accounts receivable, etc.
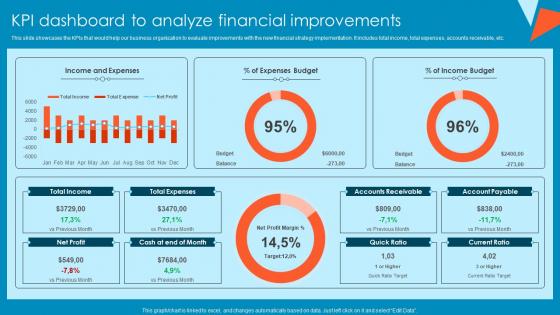
KPI Dashboard To Analyze Financial Improvements Tactical Financial Governance Brochure Pdf
This slide showcases the KPIs that would help our business organization to evaluate improvements with the new financial strategy implementation. It includes total income, total expenses, accounts receivable, etc.Boost your pitch with our creative KPI Dashboard To Analyze Financial Improvements Tactical Financial Governance Brochure Pdf. Deliver an awe-inspiring pitch that will mesmerize everyone. Using these presentation templates you will surely catch everyones attention. You can browse the ppts collection on our website. We have researchers who are experts at creating the right content for the templates. So you do not have to invest time in any additional work. Just grab the template now and use them. This slide showcases the KPIs that would help our business organization to evaluate improvements with the new financial strategy implementation. It includes total income, total expenses, accounts receivable, etc.

 Home
Home