financial management
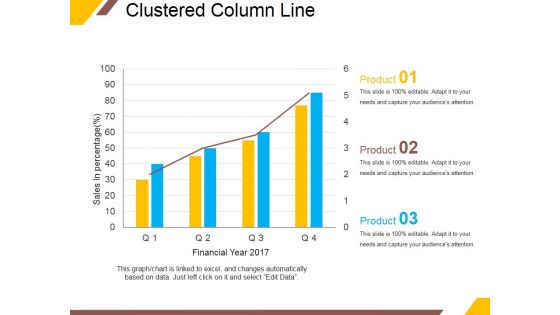
Clustered Column Line Ppt PowerPoint Presentation Portfolio Outline
This is a clustered column line ppt powerpoint presentation portfolio outline. This is a four stage process. The stages in this process are sales in percentage, financial year, product, graph, growth.
Scatter Bubble Chart Ppt PowerPoint Presentation Icon Elements
This is a scatter bubble chart ppt powerpoint presentation icon elements. This is a six stage process. The stages in this process are highest profit, profit, financial year, product.
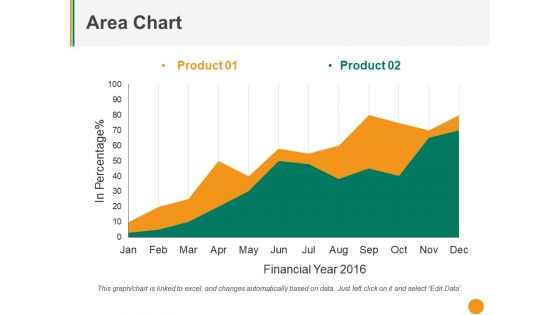
Area Chart Ppt PowerPoint Presentation File Graphic Tips
This is a area chart ppt powerpoint presentation file graphic tips. This is a two stage process. The stages in this process are product, in percentage, financial year, business, growth.
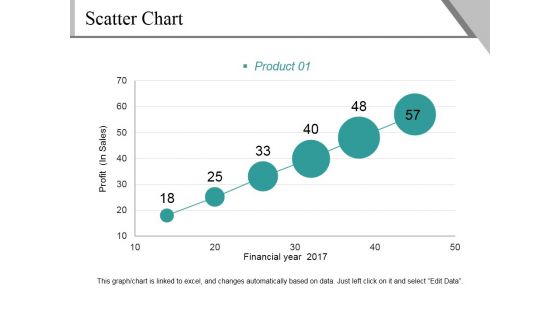
Scatter Chart Ppt PowerPoint Presentation File Background Image
This is a scatter chart ppt powerpoint presentation file background image. This is a six stage process. The stages in this process are profit, financial year, product, growth, success.
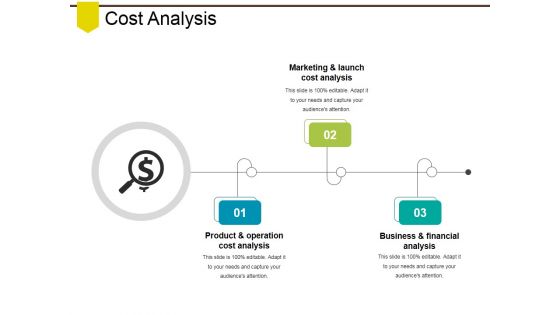
Cost Analysis Ppt PowerPoint Presentation Infographics Visual Aids
This is a cost analysis ppt powerpoint presentation infographics visual aids. This is a three stage process. The stages in this process are product and operation cost analysis, marketing and launch cost analysis, business and financial analysis.
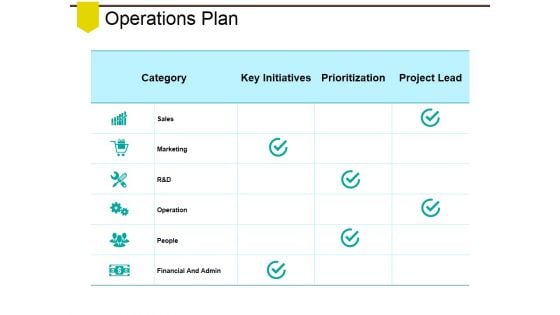
Operations Plan Ppt PowerPoint Presentation Model Samples
This is a operations plan ppt powerpoint presentation model samples. This is a three stage process. The stages in this process are sales, marketing, operation, people, financial and admin.
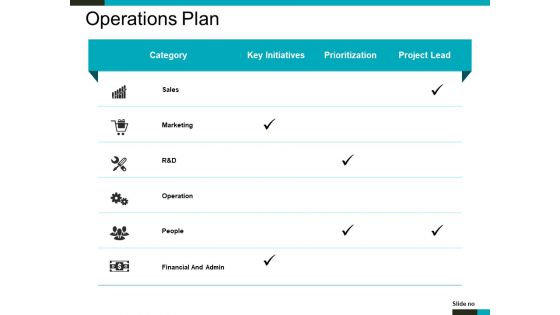
Operations Plan Ppt PowerPoint Presentation Summary Clipart Images
This is a operations plan ppt powerpoint presentation summary clipart images. This is a six stage process. The stages in this process are sales, marketing, operation, people, financial and admin.
Cost Analysis Ppt PowerPoint Presentation Summary Icons
This is a cost analysis ppt powerpoint presentation summary icons. This is a three stage process. The stages in this process are marketing and launch cost analysis, business and financial analysis, cost analysis.
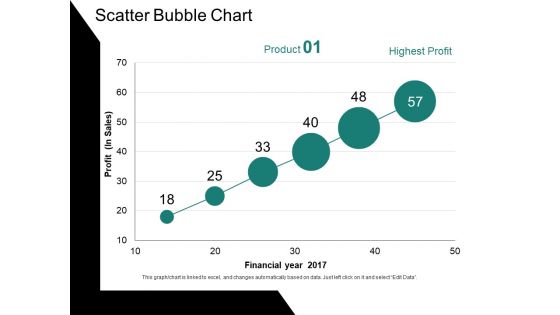
Scatter Bubble Chart Ppt PowerPoint Presentation Ideas Gallery
This is a scatter bubble chart ppt powerpoint presentation ideas gallery. This is a six stage process. The stages in this process are profit, financial year, chart, business, growth.
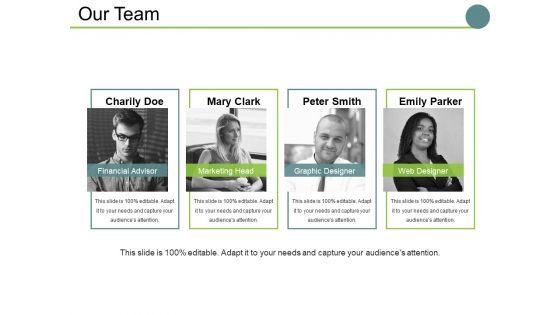
Our Team Ppt PowerPoint Presentation File Skills
This is a our team ppt powerpoint presentation file skills. This is a four stage process. The stages in this process are financial advisor, marketing head, graphic designer, web designer, team.
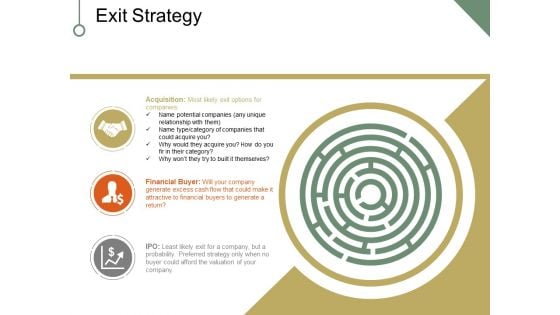
Exit Strategy Ppt PowerPoint Presentation Infographics Graphic Tips
This is a exit strategy ppt powerpoint presentation infographics graphic tips. This is a three stage process. The stages in this process are acquisition, financial buyer, ipo, maze, business.
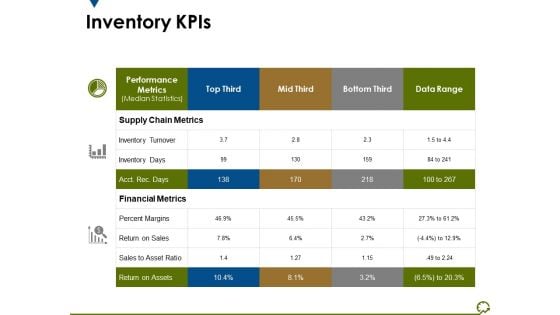
Inventory Kpis Ppt PowerPoint Presentation Infographic Template Display
This is a inventory kpis ppt powerpoint presentation infographic template display. This is a three stage process. The stages in this process are supply chain metrics, financial metrics, percent margins, return on assets, inventory turnover.
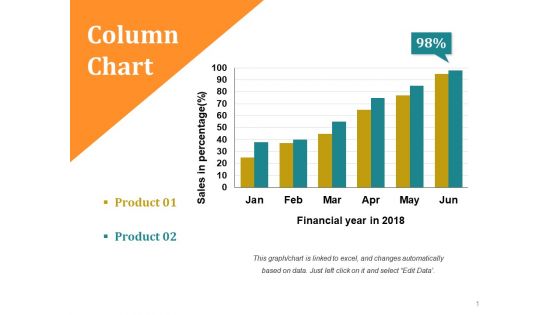
Column Chart Ppt PowerPoint Presentation Slides Smartart
This is a column chart ppt powerpoint presentation slides smartart. This is a two stage process. The stages in this process are sales in percentage, financial year in, business, growth, strategy.
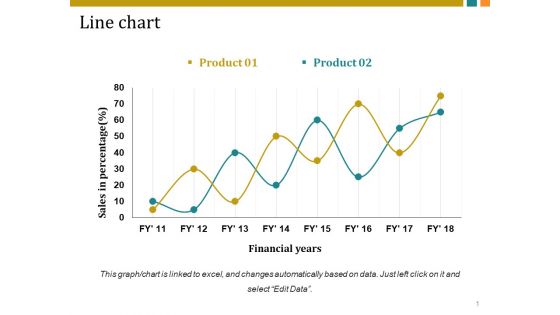
Line Chart Ppt PowerPoint Presentation Inspiration Vector
This is a line chart ppt powerpoint presentation inspiration vector. This is a two stage process. The stages in this process are sales in percentage, financial years, business, marketing, growth.
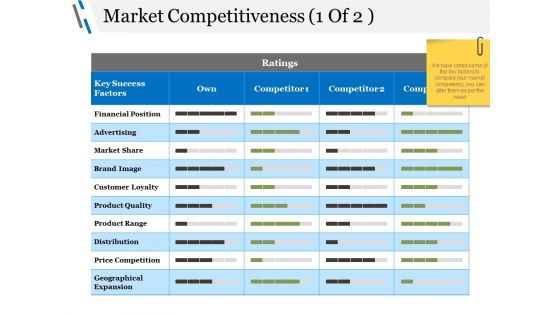
Market Competitiveness Template 1 Ppt PowerPoint Presentation Inspiration Deck
This is a market competitiveness template 1 ppt powerpoint presentation inspiration deck. This is a three stage process. The stages in this process are financial position, advertising, market share, brand image, customer loyalty.
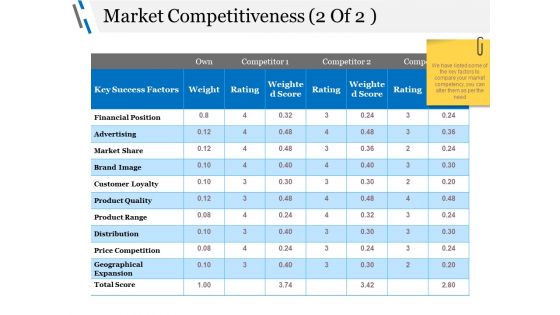
Market Competitiveness Template 2 Ppt PowerPoint Presentation Pictures Elements
This is a market competitiveness template 2 ppt powerpoint presentation pictures elements. This is a three stage process. The stages in this process are financial position, advertising, market share, brand image, customer loyalty.

Line Chart Ppt PowerPoint Presentation Infographics Graphic Images
This is a line chart ppt powerpoint presentation infographics graphic images. This is a two stage process. The stages in this process are sales in percentage, financial years, growth, business, marketing.
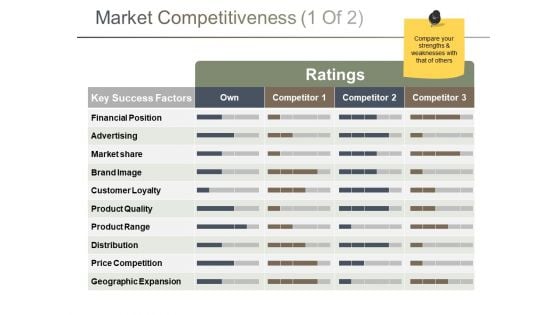
Market Competitiveness Template 1 Ppt PowerPoint Presentation Pictures Vector
This is a market competitiveness template 1 ppt powerpoint presentation pictures vector. This is a three stage process. The stages in this process are financial position, advertising, market share, brand image, customer loyalty.
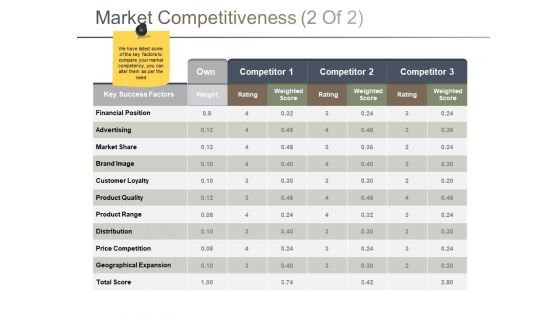
Market Competitiveness Template 2 Ppt PowerPoint Presentation Infographics Influencers
This is a market competitiveness template 2 ppt powerpoint presentation infographics influencers. This is a three stage process. The stages in this process are financial position, advertising, market share, brand image, customer loyalty.
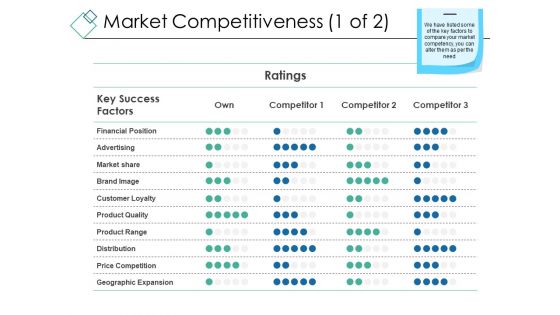
Market Competitiveness Template 1 Ppt PowerPoint Presentation Layouts Templates
This is a market competitiveness template 1 ppt powerpoint presentation layouts templates. This is a three stage process. The stages in this process are financial position, advertising, market share, brand image, customer loyalty.
Market Competitiveness Template 2 Ppt PowerPoint Presentation Icon Master Slide
This is a market competitiveness template 2 ppt powerpoint presentation icon master slide. This is a three stage process. The stages in this process are financial position, advertising, market share, brand image, customer loyalty.

Market Competitiveness Template 1 Ppt PowerPoint Presentation Slides Template
This is a market competitiveness template 1 ppt powerpoint presentation slides template. This is a three stage process. The stages in this process are financial position, advertising, market share, brand image, customer loyalty.
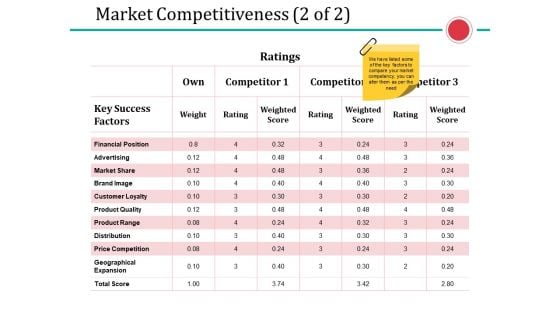
Market Competitiveness Template 2 Ppt PowerPoint Presentation Portfolio Graphic Tips
This is a market competitiveness template 2 ppt powerpoint presentation portfolio graphic tips. This is a three stage process. The stages in this process are financial position, advertising, market share, brand image, customer loyalty.
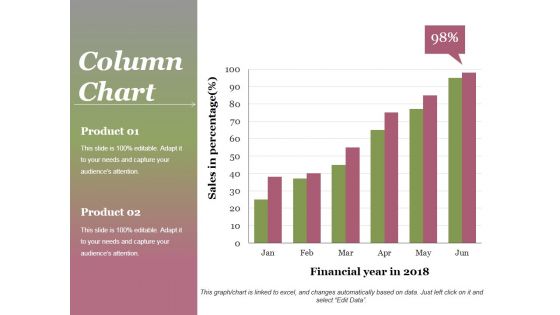
Column Chart Ppt PowerPoint Presentation Gallery Background
This is a column chart ppt powerpoint presentation gallery background. This is a two stage process. The stages in this process are product, sales in percentage, financial year, graph, success.
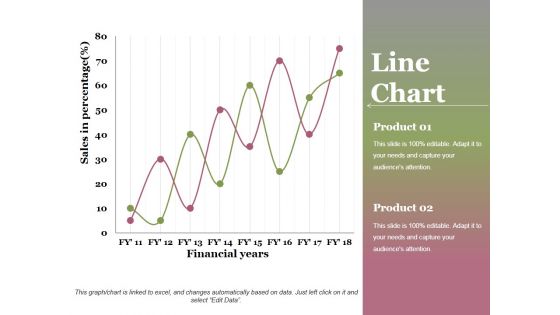
Line Chart Ppt PowerPoint Presentation Professional Graphics Design
This is a line chart ppt powerpoint presentation professional graphics design. This is a two stage process. The stages in this process are financial years, sales in percentage, product, growth, success.
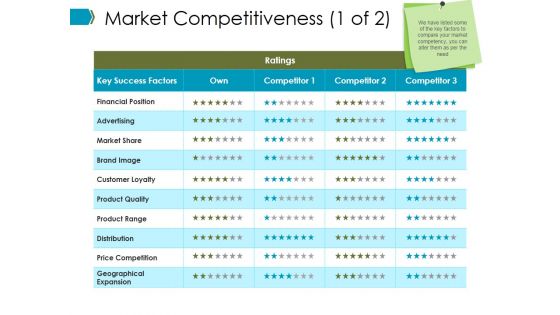
Market Competitiveness Template Ppt PowerPoint Presentation Summary Ideas
This is a market competitiveness template ppt powerpoint presentation summary ideas. This is a three stage process. The stages in this process are financial position, advertising, market share, brand image, customer loyalty.
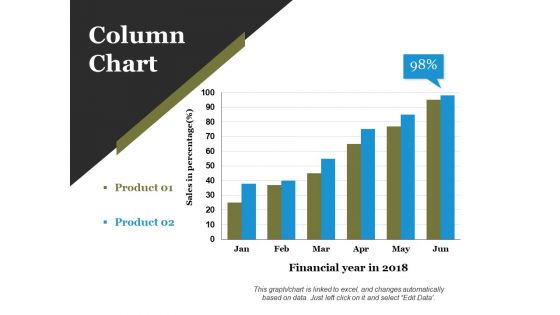
Column Chart Ppt PowerPoint Presentation Infographics Layout Ideas
This is a column chart ppt powerpoint presentation infographics layout ideas. This is a two stage process. The stages in this process are financial year in, business, marketing, growth, graph.
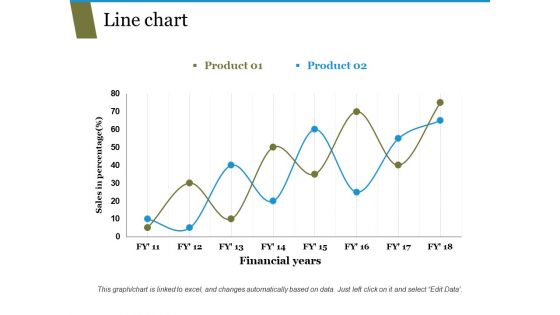
Line Chart Ppt PowerPoint Presentation Pictures Templates
This is a line chart ppt powerpoint presentation pictures templates. This is a two stage process. The stages in this process are sales in percentage, financial years, business, marketing, growth.
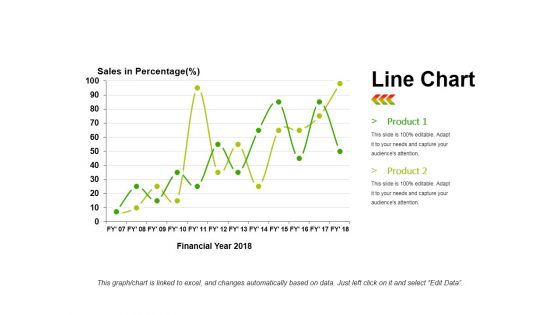
Line Chart Ppt PowerPoint Presentation Infographics Infographics
This is a line chart ppt powerpoint presentation infographics infographics. This is a two stage process. The stages in this process are product, sales in percentage, financial year, line chart, finance.
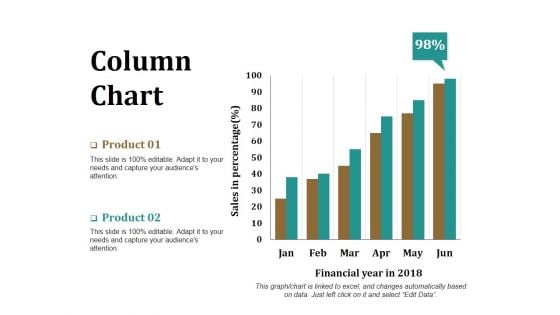
Column Chart Ppt PowerPoint Presentation Model Graphics Download
This is a column chart ppt powerpoint presentation model graphics download. This is a two stage process. The stages in this process are product, financial year, sales in percentage, bar graph, success.
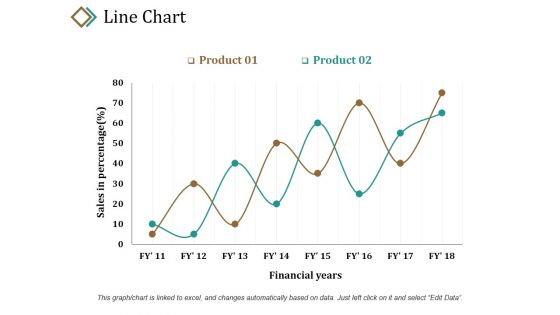
Line Chart Ppt PowerPoint Presentation Layouts Example
This is a line chart ppt powerpoint presentation layouts example. This is a two stage process. The stages in this process are sales in percentage, product, financial years, growth, success.
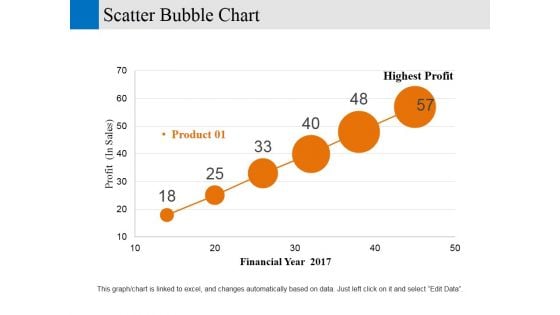
Scatter Bubble Chart Ppt PowerPoint Presentation Gallery Designs Download
This is a scatter bubble chart ppt powerpoint presentation gallery designs download. This is a six stage process. The stages in this process are financial year, profit, business, marketing, strategy.
Clustered Column Line Ppt PowerPoint Presentation Icon Good
This is a clustered column line ppt powerpoint presentation icon good. This is a three stage process. The stages in this process are product, financial year, bar graph, business, growth.
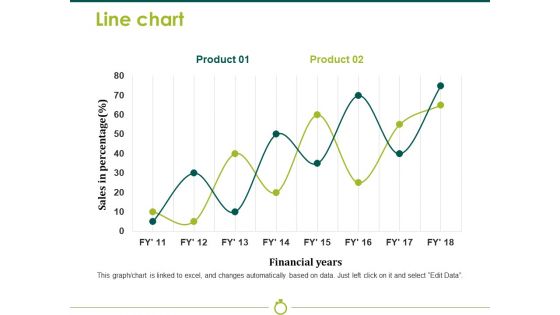
Line Chart Template 2 Ppt PowerPoint Presentation Model Background Image
This is a line chart template 2 ppt powerpoint presentation model background image. This is a two stage process. The stages in this process are sales in percentage, financial years, business, marketing, strategy, graph.
Bar Chart Ppt PowerPoint Presentation Icon Information
This is a bar chart ppt powerpoint presentation icon information. This is a one stage process. The stages in this process are product, sales in percentage, financial years, bar graph, growth.
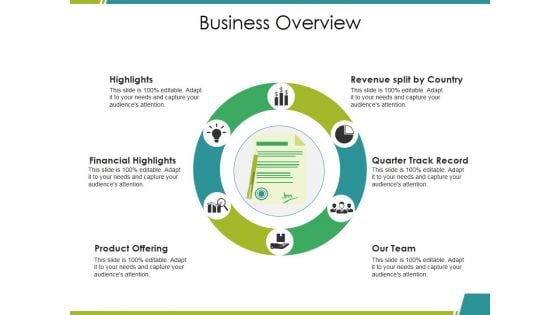
Business Overview Ppt PowerPoint Presentation File Graphics Pictures
This is a business overview ppt powerpoint presentation file graphics pictures. This is a six stage process. The stages in this process are highlights, financial highlights, product offering, our team, quarter track record.
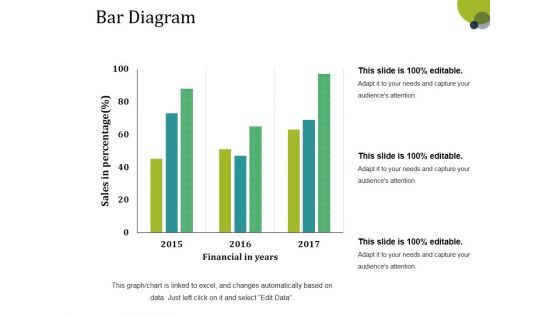
Bar Diagram Ppt PowerPoint Presentation Gallery Structure
This is a bar diagram ppt powerpoint presentation gallery structure. This is a three stage process. The stages in this process are financial in years, sales in percentage, bar graph, growth, success.
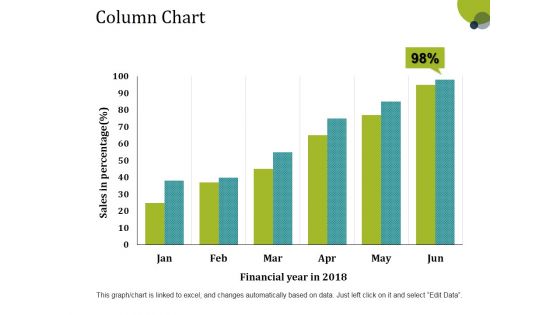
Column Chart Ppt PowerPoint Presentation Layouts Tips
This is a column chart ppt powerpoint presentation layouts tips. This is a six stage process. The stages in this process are sales in percentage, financial year, bar graph, growth, success.
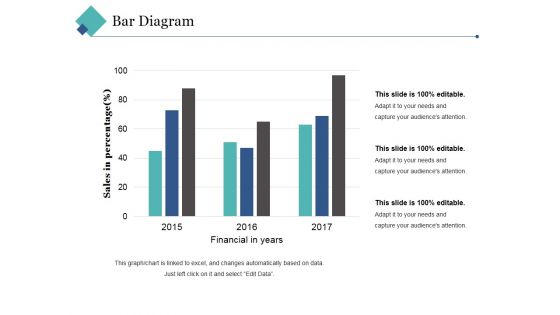
Bar Diagram Ppt PowerPoint Presentation Pictures Background Image
This is a bar diagram ppt powerpoint presentation pictures background image. This is a three stage process. The stages in this process are financial in years, sales in percentage, bar graph, growth, success.
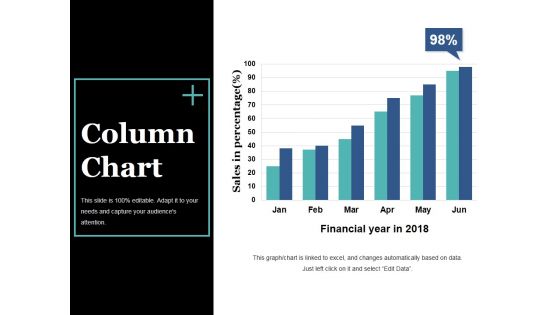
Column Chart Ppt PowerPoint Presentation Slides Visual Aids
This is a column chart ppt powerpoint presentation slides visual aids. This is a six stage process. The stages in this process are bar graph, growth, success, sales in percentage, financial year.
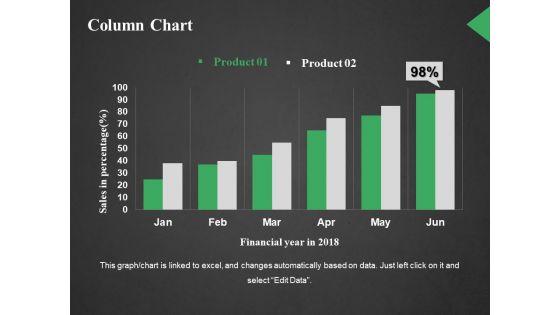
Column Chart Ppt PowerPoint Presentation Outline Styles
This is a column chart ppt powerpoint presentation outline styles. This is a two stage process. The stages in this process are sales in percentage, financial year in, business, marketing, graph.

Line Chart Ppt PowerPoint Presentation Show Guide
This is a line chart ppt powerpoint presentation show guide. This is a two stage process. The stages in this process are product, sales in percentage, financial years, growth, success.
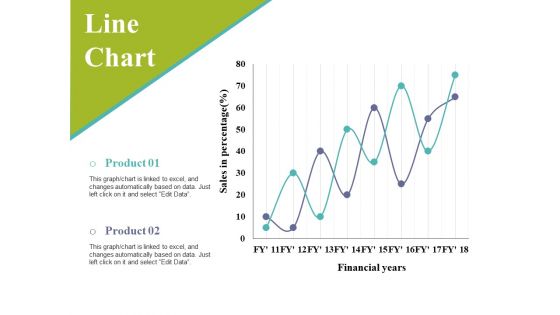
Line Chart Ppt PowerPoint Presentation Infographic Template Slides
This is a line chart ppt powerpoint presentation infographic template slides. This is a two stage process. The stages in this process are sales in percentage, financial years, business, marketing, graph.
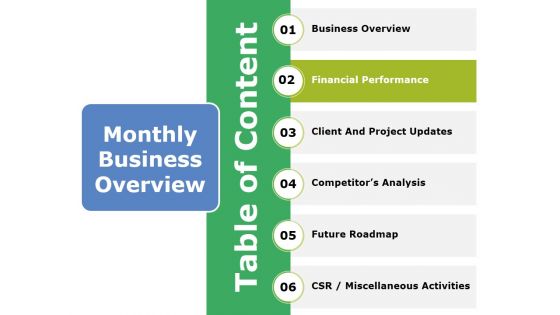
Table Of Content Template 1 Ppt PowerPoint Presentation Pictures Guidelines
This is a table of content template 1 ppt powerpoint presentation pictures guidelines. This is a six stage process. The stages in this process are business overview, financial performance, client and project updates, future roadmap, miscellaneous activities.
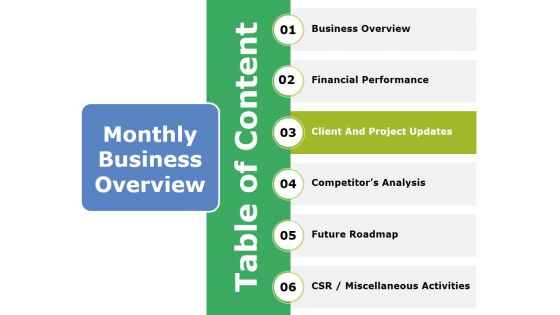
Table Of Content Template 2 Ppt PowerPoint Presentation File Structure
This is a table of content template 2 ppt powerpoint presentation file structure. This is a six stage process. The stages in this process are business overview, financial performance, client and project updates, future roadmap, miscellaneous activities.
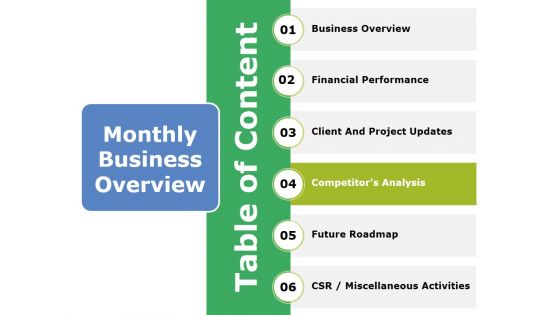
Table Of Content Template 3 Ppt PowerPoint Presentation Summary Graphics Template
This is a table of content template 3 ppt powerpoint presentation summary graphics template. This is a six stage process. The stages in this process are business overview, financial performance, client and project updates, future roadmap, miscellaneous activities.
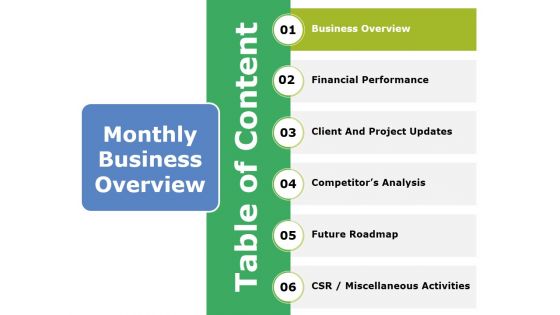
Table Of Content Template Ppt PowerPoint Presentation Model Grid
This is a table of content template ppt powerpoint presentation model grid. This is a six stage process. The stages in this process are business overview, financial performance, client and project updates, future roadmap, miscellaneous activities.
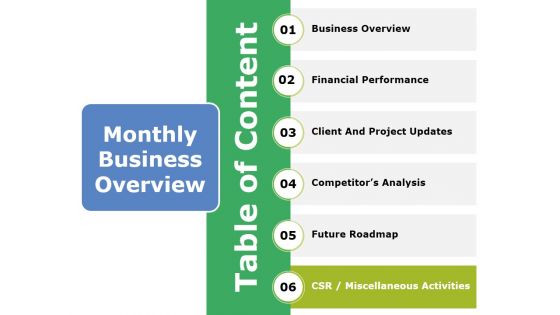
Table Of Content Template 1 Ppt PowerPoint Presentation Styles Graphic Tips
This is a table of content template 1 ppt powerpoint presentation styles graphic tips. This is a six stage process. The stages in this process are business overview, financial performance, client and project updates, future roadmap, miscellaneous activities.

Table Of Content Template Ppt PowerPoint Presentation Model Graphics Design
This is a table of content template ppt powerpoint presentation model graphics design. This is a six stage process. The stages in this process are business overview, financial performance, client and project updates, future roadmap, miscellaneous activities.
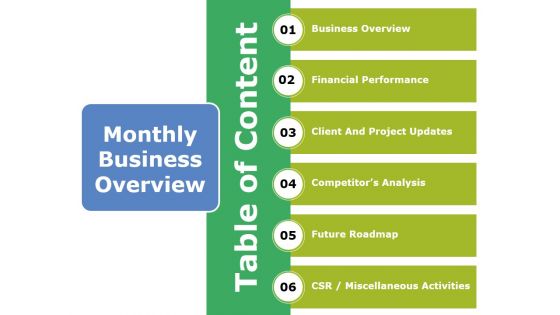
Table Of Content Ppt PowerPoint Presentation Summary Topics
This is a table of content ppt powerpoint presentation summary topics. This is a six stage process. The stages in this process are business overview, financial performance, client and project updates, future roadmap, miscellaneous activities.
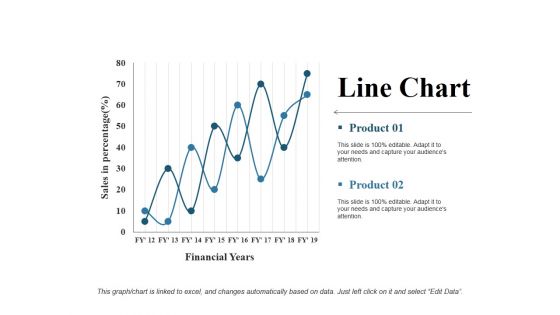
Line Chart Ppt PowerPoint Presentation Gallery Rules
This is a line chart ppt powerpoint presentation gallery rules. This is a two stage process. The stages in this process are financial years, product, sales in percentage, line chart, growth.
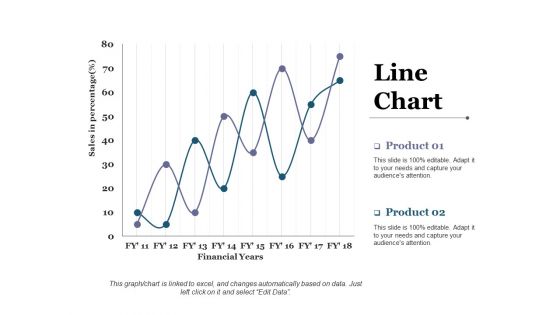
Line Chart Ppt PowerPoint Presentation Styles Themes
This is a line chart ppt powerpoint presentation styles themes. This is a two stage process. The stages in this process are business, marketing, financial years, sales in percentage.
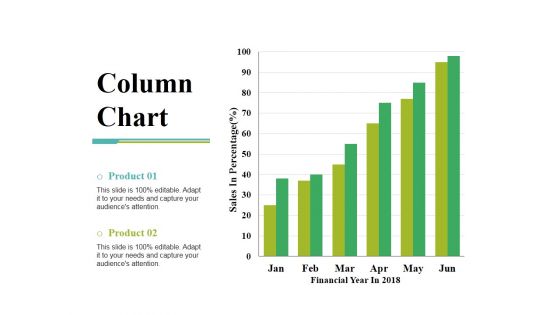
Column Chart Ppt PowerPoint Presentation Gallery Slide Portrait
This is a column chart ppt powerpoint presentation gallery slide portrait. This is a two stage process. The stages in this process are sales in percentage, financial year, product, bar graph, growth.
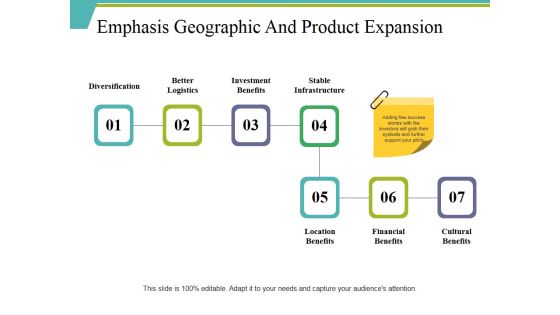
Emphasis Geographic And Product Expansion Ppt PowerPoint Presentation Gallery Rules
This is a emphasis geographic and product expansion ppt powerpoint presentation gallery rules. This is a seven stage process. The stages in this process are diversification, investment benefits, stable infrastructure, financial benefits, cultural benefits.
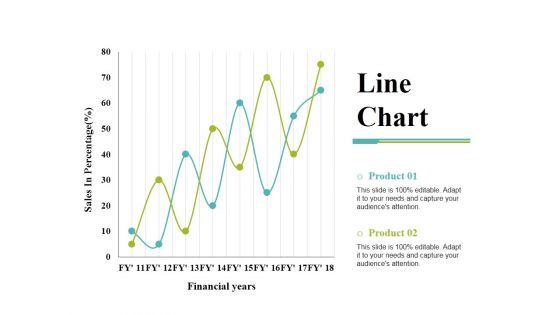
Line Chart Ppt PowerPoint Presentation Gallery Templates
This is a line chart ppt powerpoint presentation gallery templates. This is a two stage process. The stages in this process are product, financial years, sales in percentage, line chart.
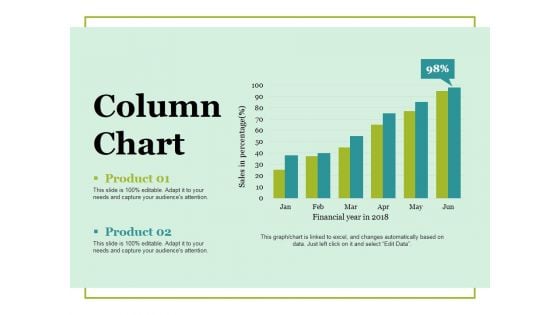
Column Chart Ppt PowerPoint Presentation Ideas Vector
This is a column chart ppt powerpoint presentation ideas vector. This is a two stage process. The stages in this process are column chart, product, financial years, sales in percentage, growth.

Our Team Ppt PowerPoint Presentation File Format
This is a our team ppt powerpoint presentation file format. This is a four stage process. The stages in this process are financial advisor, marketing head, graphic designer, web designer.
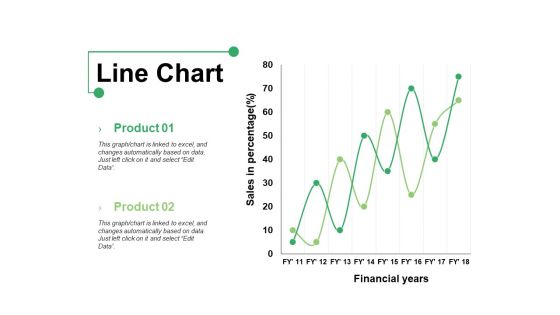
Line Chart Ppt PowerPoint Presentation Show Graphics Example
This is a line chart ppt powerpoint presentation show graphics example. This is a two stage process. The stages in this process are product, line chart, financial years, sales in percentage.
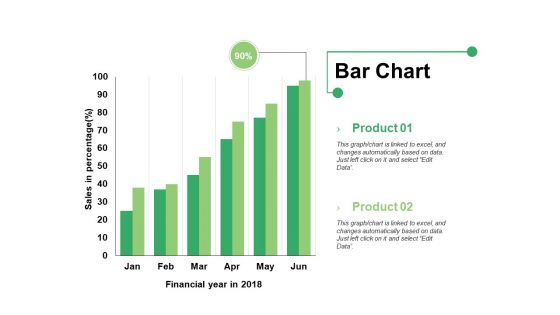
Bar Chart Ppt PowerPoint Presentation Infographics Format Ideas
This is a bar chart ppt powerpoint presentation infographics format ideas. This is a two stage process. The stages in this process are bar graph, product, financial year, sales in percentage.
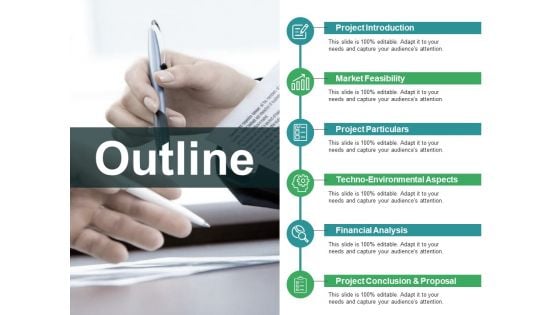
Outline Ppt PowerPoint Presentation Model Visual Aids
This is a outline ppt powerpoint presentation model visual aids. This is a six stage process. The stages in this process are project introduction, market feasibility, project particulars, financial analysis.


 Continue with Email

 Home
Home


