financial management
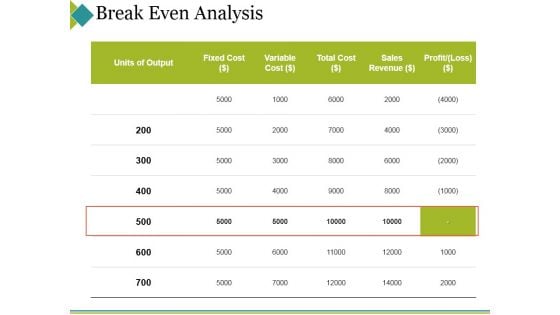
Break Even Analysis Ppt PowerPoint Presentation Outline Example Topics
This is a break even analysis ppt powerpoint presentation outline example topics. This is a five stage process. The stages in this process are units of output, variable, fixed cost, total cost, sales revenue.
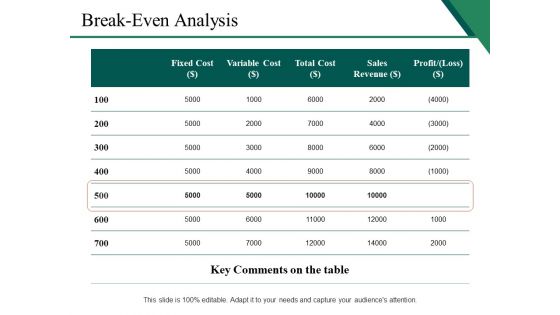
Break Even Analysis Ppt PowerPoint Presentation Pictures Good
This is a break even analysis ppt powerpoint presentation pictures good. This is a five stage process. The stages in this process are key comments on the table, units of output, fixed cost, variable cost, sales revenue.
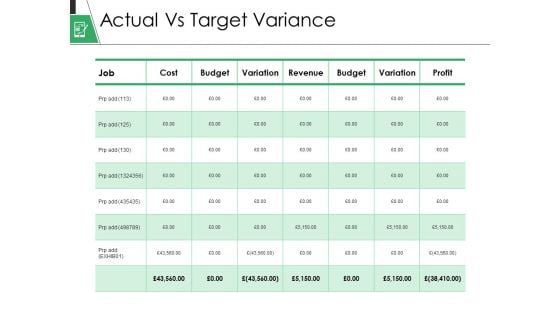
Actual Vs Target Variance Ppt PowerPoint Presentation Gallery Background
This is a actual vs target variance ppt powerpoint presentation gallery background. This is a eight stage process. The stages in this process are Cost, Budget, Variation, Revenue, Budget.
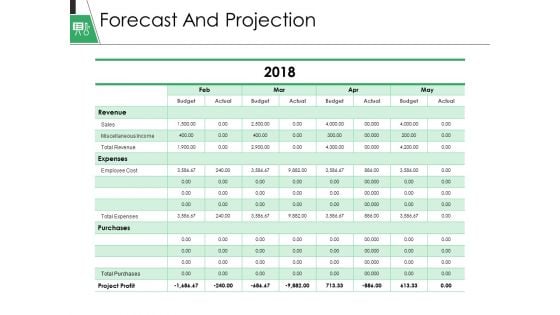
Forecast And Projection Ppt PowerPoint Presentation Gallery Display
This is a forecast and projection ppt powerpoint presentation gallery display. This is a four stage process. The stages in this process are revenue, expenses, purchases, project profit, budget.

Actual Vs Target Variance Ppt PowerPoint Presentation File Backgrounds
This is a actual vs target variance ppt powerpoint presentation file backgrounds. This is a eight stage process. The stages in this process are job, cost, budget, revenue, variation.
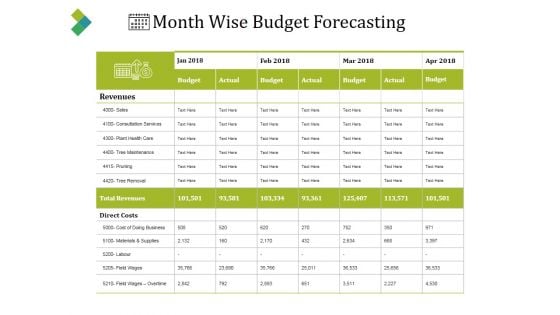
Month Wise Budget Forecasting Ppt PowerPoint Presentation Model Show
This is a month wise budget forecasting ppt powerpoint presentation model show. This is a four stage process. The stages in this process are budget, actual, revenue, sales, direct costs.
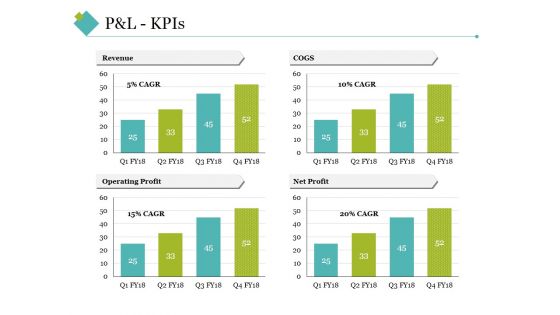
P And L Kpis Template 2 Ppt PowerPoint Presentation Inspiration Grid
This is a p and l kpis template 2 ppt powerpoint presentation inspiration grid. This is a four stage process. The stages in this process are revenue, cogs, operating profit, net profit.
Income Statement Overview Ppt PowerPoint Presentation Infographic Template Icon
This is a income statement overview ppt powerpoint presentation infographic template icon. This is a five stage process. The stages in this process are revenue, profit margin, operating profit margin.
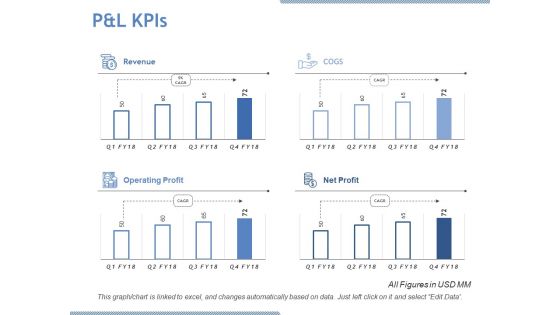
P And L Kpis Ppt PowerPoint Presentation Designs Download
This is a p and l kpis ppt powerpoint presentation designs download. This is a four stage process. The stages in this process are revenue, cogs, operating profit, net profit.
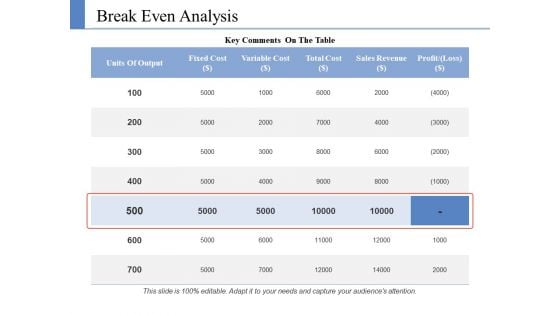
Break Even Analysis Ppt PowerPoint Presentation Portfolio Graphics Design
This is a break even analysis ppt powerpoint presentation portfolio graphics design. This is a five stage process. The stages in this process are units of output, fixed cost, variable cost, total cost, sales revenue.
Consequences Of Poor Quality Ppt PowerPoint Presentation Styles Guidelines
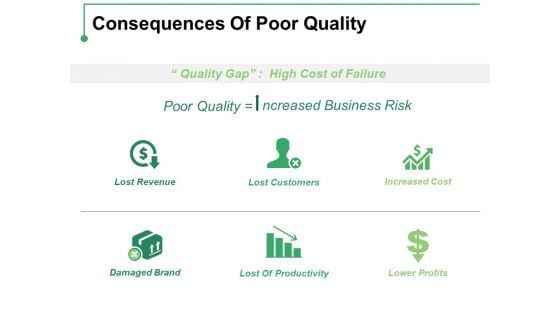
This is a consequences of poor quality ppt powerpoint presentation styles guidelines. This is a six stage process. The stages in this process are lost revenue, lost customers, increased cost, damaged brand, lower profits.
Break Even Analysis Ppt PowerPoint Presentation Inspiration Example Introduction
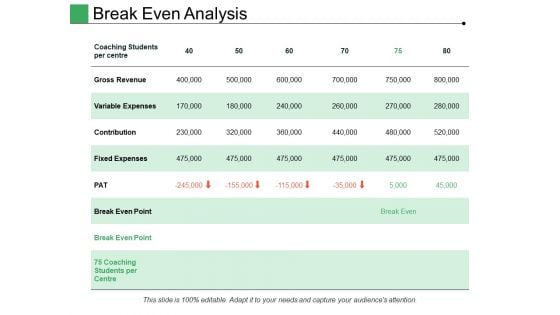
This is a break even analysis ppt powerpoint presentation inspiration example introduction. This is a four stage process. The stages in this process are gross revenue, variable expenses, contribution, break even point, pat.
Comparison Based On Criteria Ppt PowerPoint Presentation Gallery Information
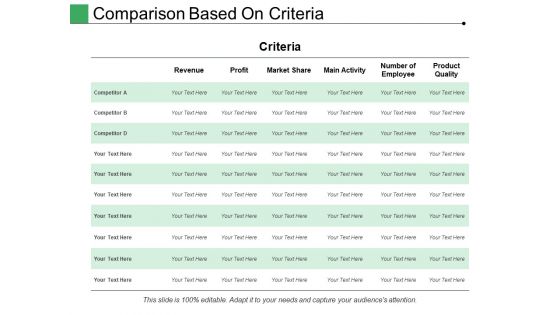
This is a comparison based on criteria ppt powerpoint presentation gallery information. This is a six stage process. The stages in this process are criteria, revenue, profit, business, competitor.
Income Statement Overview Ppt PowerPoint Presentation File Structure
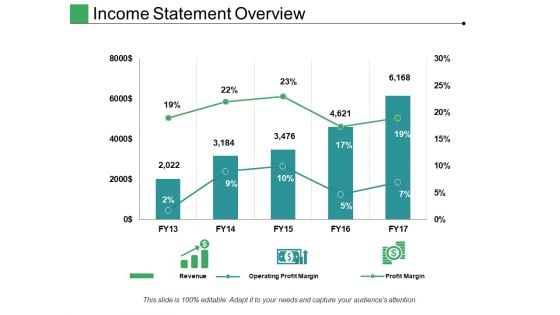
This is a income statement overview ppt powerpoint presentation file structure. This is a five stage process. The stages in this process are revenue, operating profit margin, profit margin.
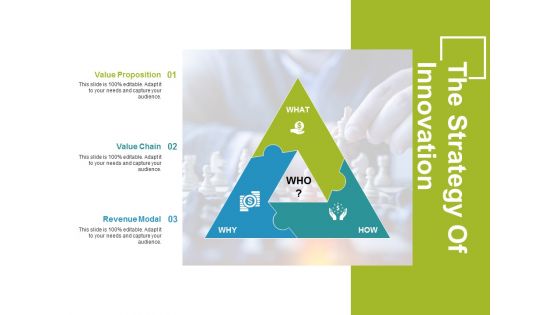
The Strategy Of Innovation Template 1 Ppt PowerPoint Presentation Professional Graphics Download
This is a the strategy of innovation template 1 ppt powerpoint presentation professional graphics download. This is a three stage process. The stages in this process are value proposition, value chain, revenue modal.
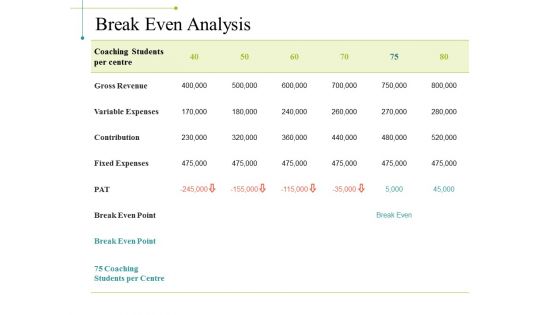
Break Even Analysis Ppt PowerPoint Presentation Model Example File
This is a break even analysis ppt powerpoint presentation model example file. This is a six stage process. The stages in this process are gross revenue, variable expenses, contribution, fixed expenses, break even point.
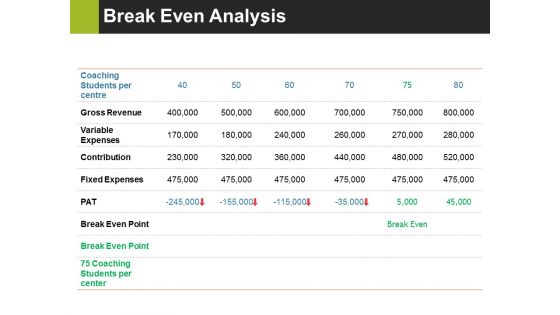
Break Even Analysis Ppt PowerPoint Presentation Layouts Rules
This is a break even analysis ppt powerpoint presentation layouts rules. This is a six stage process. The stages in this process are gross revenue, variable expenses, contribution, fixed expenses.

Comparison Based On Criteria Ppt PowerPoint Presentation Infographic Template Graphic Tips
This is a comparison based on criteria ppt powerpoint presentation infographic template graphic tips. This is a seven stage process. The stages in this process are revenue, market share, main activity, number of employee, product quality.

Business Model Innovation Ppt PowerPoint Presentation File Infographic Template
This is a business model innovation ppt powerpoint presentation file infographic template. This is a three stage process. The stages in this process are revenue model innovation, customer model innovation, organizational model innovation.
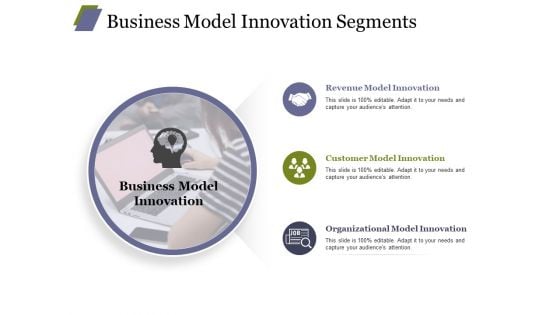
Business Model Innovation Segments Ppt PowerPoint Presentation Professional Example Topics
This is a business model innovation segments ppt powerpoint presentation professional example topics. This is a three stage process. The stages in this process are revenue model innovation, customer model innovation, organizational model innovation.
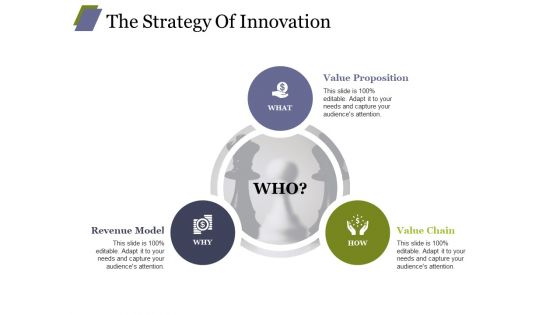
The Strategy Of Innovation Ppt PowerPoint Presentation Model Templates
This is a the strategy of innovation ppt powerpoint presentation model templates. This is a three stage process. The stages in this process are value proposition, value chain, revenue model.
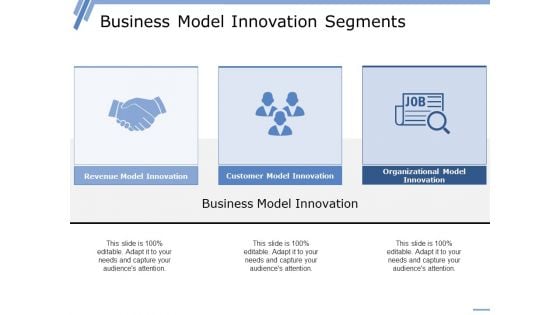
Business Model Innovation Segments Ppt PowerPoint Presentation Summary Introduction
This is a business model innovation segments ppt powerpoint presentation summary introduction. This is a three stage process. The stages in this process are customer model innovation, business model innovation, revenue model innovation.
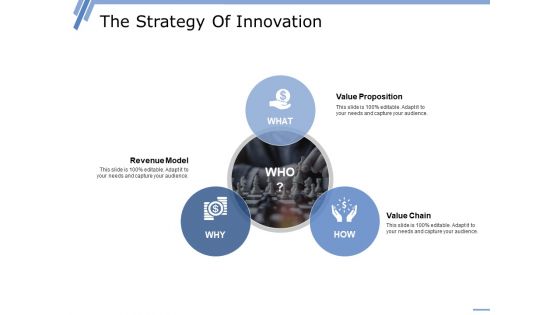
The Strategy Of Innovation Ppt PowerPoint Presentation Outline Display
This is a the strategy of innovation ppt powerpoint presentation outline display. This is a three stage process. The stages in this process are value proposition, value chain, revenue model.
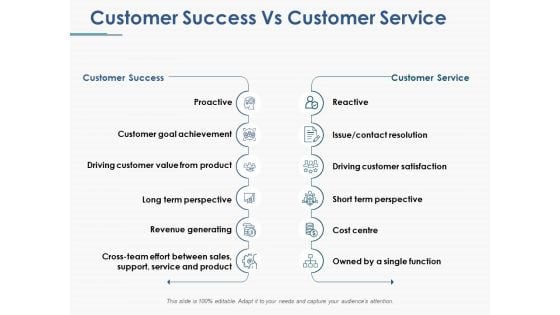
Customer Success Vs Customer Service Ppt PowerPoint Presentation Portfolio Professional
This is a customer success vs customer service ppt powerpoint presentation portfolio professional. This is a six stage process. The stages in this process are reactive, proactive, cost centre, revenue generating, customer service, customer success.

Customer Success Vs Customer Service Ppt PowerPoint Presentation Summary Objects
This is a customer success vs customer service ppt powerpoint presentation summary objects. This is a two stage process. The stages in this process are proactive, customer goal achievement, driving customer value from product, long term perspective, revenue generating.
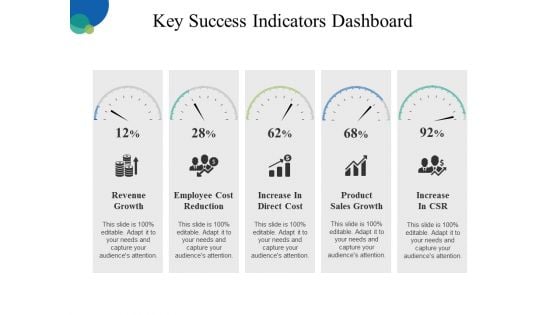
Key Success Indicators Dashboard Ppt PowerPoint Presentation Outline Slideshow
This is a key success indicators dashboard ppt powerpoint presentation outline slideshow. This is a five stage process. The stages in this process are revenue growth, employee cost reduction, increase in direct cost, product sales growth, increase in csr.
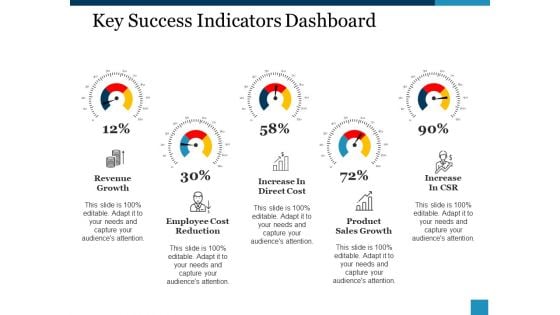
Key Success Indicators Dashboard Ppt PowerPoint Presentation Inspiration Guide
This is a key success indicators dashboard ppt powerpoint presentation inspiration guide. This is a five stage process. The stages in this process are revenue growth, increase in direct cost, increase in csr, employee cost reduction, product, sales growth.
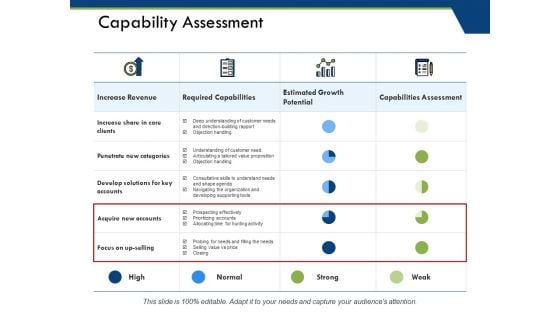
Capability Assessment Ppt PowerPoint Presentation Ideas Visual Aids
This is a capability assessment ppt powerpoint presentation ideas visual aids. This is a four stage process. The stages in this process are increase revenue, required capabilities, capabilities assessment, acquire new accounts.
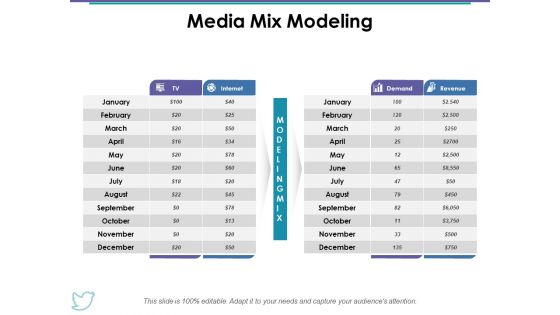
Media Mix Modeling Ppt PowerPoint Presentation Gallery Example
This is a media mix modeling ppt powerpoint presentation gallery example. This is a two stage process. The stages in this process are media mix modeling, demand, revenue, business, table.

Dollar Signs With Growing Up Arrow For Profit Growth Ppt PowerPoint Presentation Layouts Examples
This is a dollar signs with growing up arrow for profit growth ppt powerpoint presentation layouts examples. This is a four stage process. The stages in this process are growth, increase sales, increase revenue.
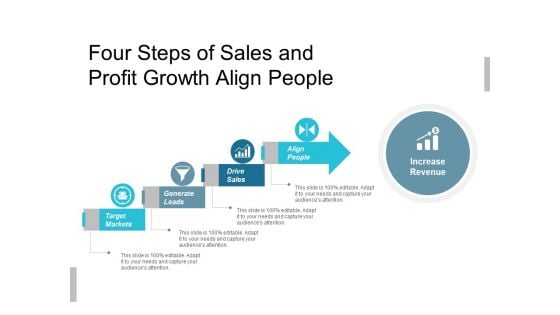
Four Steps Of Sales And Profit Growth Align People Ppt PowerPoint Presentation Infographic Template Deck
This is a four steps of sales and profit growth align people ppt powerpoint presentation infographic template deck. This is a four stage process. The stages in this process are growth, increase sales, increase revenue.
Profit Growth Bar Graph With Rising Arrow And Dollar Sign Ppt PowerPoint Presentation Icon Designs
This is a profit growth bar graph with rising arrow and dollar sign ppt powerpoint presentation icon designs. This is a five stage process. The stages in this process are growth, increase sales, increase revenue.
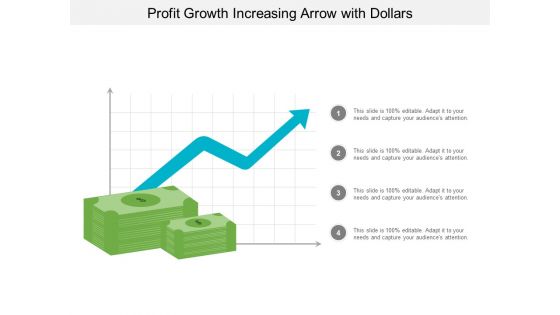
Profit Growth Increasing Arrow With Dollars Ppt PowerPoint Presentation Model Outfit
This is a profit growth increasing arrow with dollars ppt powerpoint presentation model outfit. This is a four stage process. The stages in this process are growth, increase sales, increase revenue.
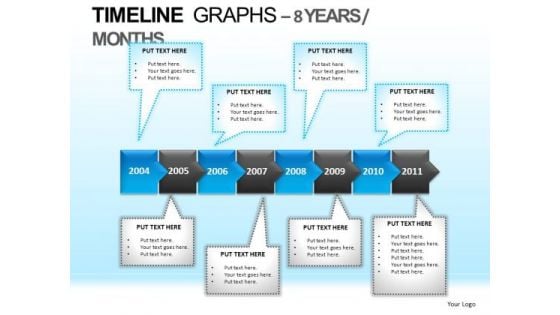
PowerPoint Slides Business Education Timeline Graphs Ppt Process
PowerPoint Slides Business Education timeline graphs PPT Process-These high quality, editable pre-designed powerpoint slides have been carefully created by our professional team to help you impress your audience. Each graphic in every slide is vector based and is 100% editable in powerpoint. Each and every property of any slide - color, size, shading etc can be modified to build an effective powerpoint presentation. Use these slides to convey complex business concepts in a simplified manner. Any text can be entered at any point in the powerpoint slide. Simply DOWNLOAD, TYPE and PRESENT! Test boundaries of presenting with our PowerPoint Slides Business Education Timeline Graphs Ppt Process. Download without worries with our money back guaranteee.
PowerPoint Presentation Designs Download Bulleted List Pyramid Ppt Process
PowerPoint Presentation Designs Download Bulleted List Pyramid PPT Process-These high quality, editable pre-designed powerpoint slides have been carefully created by our professional team to help you impress your audience. Each graphic in every slide is vector based and is 100% editable in powerpoint. Each and every property of any slide - color, size, shading etc can be modified to build an effective powerpoint presentation. Use these slides to convey complex business concepts in a simplified manner. Any text can be entered at any point in the powerpoint slide. Simply DOWNLOAD, TYPE and PRESENT! Ensure success with our PowerPoint Presentation Designs Download Bulleted List Pyramid Ppt Process. Download without worries with our money back guaranteee.
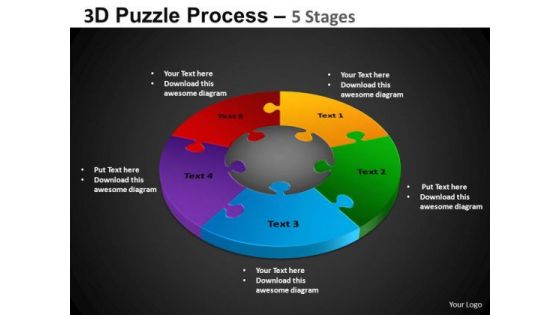
PowerPoint Presentation Designs Download Pie Chart Puzzle Process Ppt Backgrounds
PowerPoint Presentation Designs Download Pie chart Puzzle Process PPT Backgrounds-These high quality, editable pre-designed powerpoint slides have been carefully created by our professional team to help you impress your audience. Each graphic in every slide is vector based and is 100% editable in powerpoint. Each and every property of any slide - color, size, shading etc can be modified to build an effective powerpoint presentation. Use these slides to convey complex business concepts in a simplified manner. Any text can be entered at any point in the powerpoint slide. Simply DOWNLOAD, TYPE and PRESENT! Exceed expectations with our PowerPoint Presentation Designs Download Pie Chart Puzzle Process Ppt Backgrounds. Download without worries with our money back guaranteee.
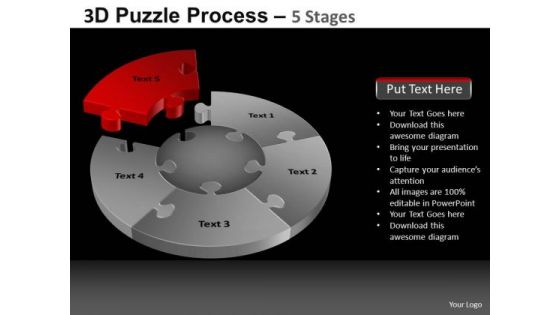
PowerPoint Presentation Strategy Pie Chart Puzzle Process Ppt Themes
PowerPoint Presentation Strategy Pie chart Puzzle Process PPT Themes-These high quality, editable pre-designed powerpoint slides have been carefully created by our professional team to help you impress your audience. Each graphic in every slide is vector based and is 100% editable in powerpoint. Each and every property of any slide - color, size, shading etc can be modified to build an effective powerpoint presentation. Use these slides to convey complex business concepts in a simplified manner. Any text can be entered at any point in the powerpoint slide. Simply DOWNLOAD, TYPE and PRESENT! Address problems with our PowerPoint Presentation Strategy Pie Chart Puzzle Process Ppt Themes. Download without worries with our money back guaranteee.
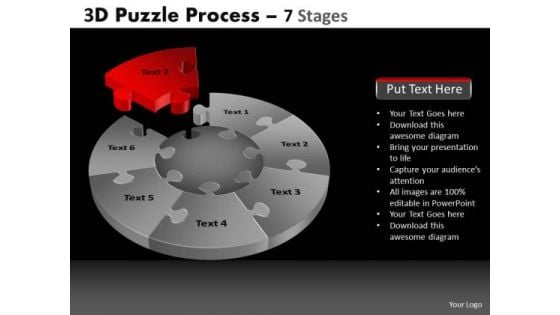
PowerPoint Slide Designs Diagram Pie Chart Puzzle Process Ppt Slidelayout
PowerPoint Slide Designs Diagram Pie chart Puzzle Process PPT Slidelayout-These high quality, editable pre-designed powerpoint slides have been carefully created by our professional team to help you impress your audience. Each graphic in every slide is vector based and is 100% editable in powerpoint. Each and every property of any slide - color, size, shading etc can be modified to build an effective powerpoint presentation. Use these slides to convey complex business concepts in a simplified manner. Any text can be entered at any point in the powerpoint slide. Simply DOWNLOAD, TYPE and PRESENT! Research problems with our PowerPoint Slide Designs Diagram Pie Chart Puzzle Process Ppt Slidelayout. Download without worries with our money back guaranteee.
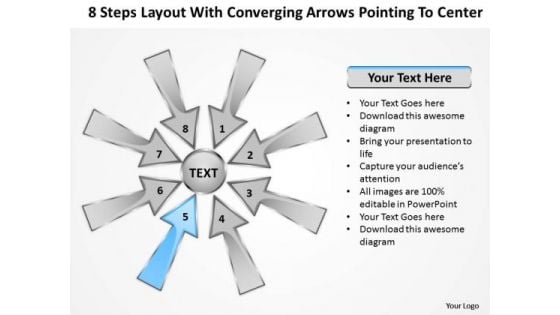
Steps Layout With Converging Arrows Pointing To Center Charts And Diagrams PowerPoint Slides
We present our steps layout with converging arrows pointing to center Charts and Diagrams PowerPoint Slides.Present our Arrows PowerPoint Templates because it focuses the light on the path to sure shot success. Download and present our Circle Charts PowerPoint Templates because you have a good idea of the roadmap to your desired destination. Download and present our Shapes PowerPoint Templates because this diagram provides trainers a tool to teach the procedure in a highly visual, engaging way. Present our Business PowerPoint Templates because it enlightens your team and colleagues on the critical factors involved. Present our Flow Charts PowerPoint Templates because it outlines the process with this innovative graphic to authenticate your plan of achieving the goal of added value/profit.Use these PowerPoint slides for presentations relating to 3d, abstract, all, around, arrow, aspect, attention, attract, blue, center, collect, colorful, conceptual, converge, course, cutout, direct, direction, factor, gather, globalization, go, green, guide, illustration, indicate, integration, isolated, location, many, movement, point, pointer, rainbow, reach, red, round, show, sides, sign, source, sphere, strategy, summon, symbol, target, unity, way, white, yellow. The prominent colors used in the PowerPoint template are Blue, Gray, Black. Presenters tell us our steps layout with converging arrows pointing to center Charts and Diagrams PowerPoint Slides are Royal. The feedback we get is that our aspect PowerPoint templates and PPT Slides are Clever. Presenters tell us our steps layout with converging arrows pointing to center Charts and Diagrams PowerPoint Slides are designed to make your presentations professional. You can be sure our attention PowerPoint templates and PPT Slides are Spectacular. People tell us our steps layout with converging arrows pointing to center Charts and Diagrams PowerPoint Slides are Ultra. PowerPoint presentation experts tell us our attract PowerPoint templates and PPT Slides are Endearing. Monitor plans with our Steps Layout With Converging Arrows Pointing To Center Charts And Diagrams PowerPoint Slides. Download without worries with our money back guaranteee.
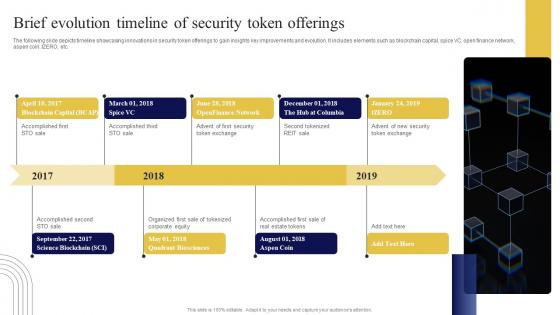
Brief Evolution Timeline Of Security Exploring Investment Opportunities Portrait Pdf
The following slide depicts timeline showcasing innovations in security token offerings to gain insights key improvements and evolution. It includes elements such as blockchain capital, spice VC, open finance network, aspen coin, tZERO, etc. Do you have to make sure that everyone on your team knows about any specific topic I yes, then you should give Brief Evolution Timeline Of Security Exploring Investment Opportunities Portrait Pdf a try. Our experts have put a lot of knowledge and effort into creating this impeccable Brief Evolution Timeline Of Security Exploring Investment Opportunities Portrait Pdf. You can use this template for your upcoming presentations, as the slides are perfect to represent even the tiniest detail. You can download these templates from the Slidegeeks website and these are easy to edit. So grab these today The following slide depicts timeline showcasing innovations in security token offerings to gain insights key improvements and evolution. It includes elements such as blockchain capital, spice VC, open finance network, aspen coin, tZERO, etc.
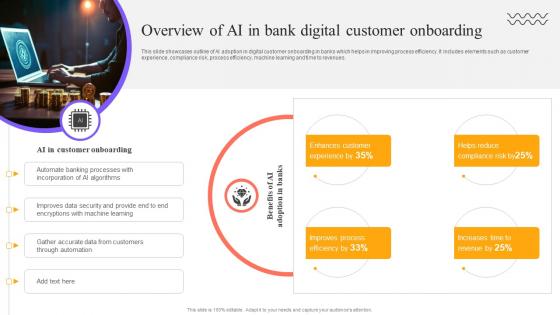
Digital Approach To Client Overview Of AI In Bank Digital Customer Onboarding
This slide showcases outline of AI adoption in digital customer onboarding in banks which helps in improving process efficiency. It includes elements such as customer experience, compliance risk, process efficiency, machine learning and time to revenues. Coming up with a presentation necessitates that the majority of the effort goes into the content and the message you intend to convey. The visuals of a PowerPoint presentation can only be effective if it supplements and supports the story that is being told. Keeping this in mind our experts created Digital Approach To Client Overview Of AI In Bank Digital Customer Onboarding to reduce the time that goes into designing the presentation. This way, you can concentrate on the message while our designers take care of providing you with the right template for the situation. This slide showcases outline of AI adoption in digital customer onboarding in banks which helps in improving process efficiency. It includes elements such as customer experience, compliance risk, process efficiency, machine learning and time to revenues.
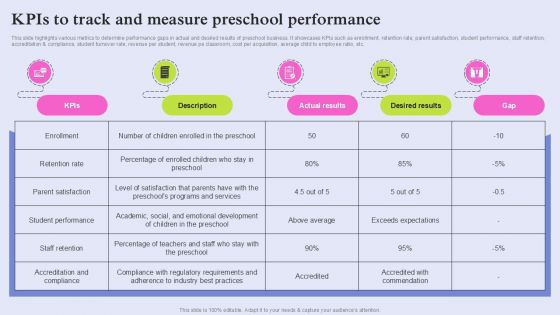
Pre School Marketing Strategy To Enhance Enrollment Rate Kpis To Track And Measure Preschool Diagrams PDF
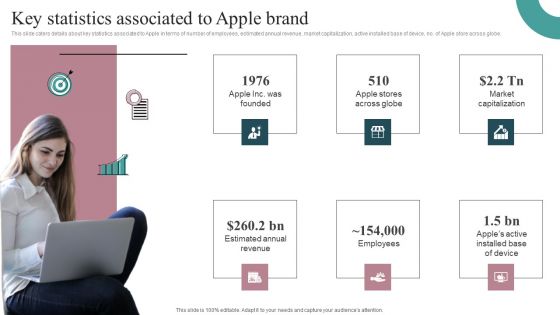
Tactical Brand Strategy Apple Key Statistics Associated To Apple Brand Ideas PDF
This slide caters details about key statistics associated to Apple in terms of number of employees, estimated annual revenue, market capitalization, active installed base of device, no. of Apple store across globe. Do you have an important presentation coming up Are you looking for something that will make your presentation stand out from the rest Look no further than Tactical Brand Strategy Apple Key Statistics Associated To Apple Brand Ideas PDF. With our professional designs, you can trust that your presentation will pop and make delivering it a smooth process. And with Slidegeeks, you can trust that your presentation will be unique and memorable. So why wait Grab Tactical Brand Strategy Apple Key Statistics Associated To Apple Brand Ideas PDF today and make your presentation stand out from the rest.
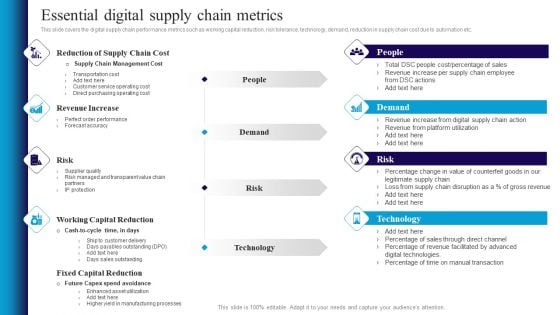
Deploying Automation In Logistics To Improve Essential Digital Supply Chain Metrics Professional PDF
This slide covers the digital supply chain performance metrics such as working capital reduction, risk tolerance, technology, demand, reduction in supply chain cost due to automation etc. Are you in need of a template that can accommodate all of your creative concepts This one is crafted professionally and can be altered to fit any style. Use it with Google Slides or PowerPoint. Include striking photographs, symbols, depictions, and other visuals. Fill, move around, or remove text boxes as desired. Test out color palettes and font mixtures. Edit and save your work, or work with colleagues. Download Deploying Automation In Logistics To Improve Essential Digital Supply Chain Metrics Professional PDF and observe how to make your presentation outstanding. Give an impeccable presentation to your group and make your presentation unforgettable.

Software Advantages Of Business Testing To Avoid Barriers Ppt File Portfolio PDF
This slide displays the benefits for testing the business related software to avoid difficulties and barriers while working. It includes saves money, inspire customer confidence, improve security, etc. Persuade your audience using this Software Advantages Of Business Testing To Avoid Barriers Ppt File Portfolio PDF. This PPT design covers three stages, thus making it a great tool to use. It also caters to a variety of topics including Saves Money, Inspires Customer, Confidence And Satisfaction, Improves Security. Download this PPT design now to present a convincing pitch that not only emphasizes the topic but also showcases your presentation skills.
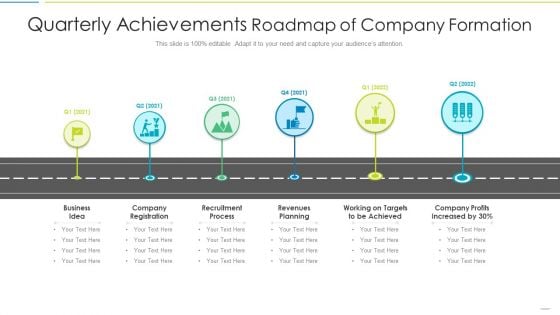
Quarterly Achievements Roadmap Of Company Formation Diagrams PDF
Presenting quarterly achievements roadmap of company formation diagrams pdf to dispense important information. This template comprises six stages. It also presents valuable insights into the topics including business idea, company registration, recruitment process, revenues planning, working on targets to be achieved. This is a completely customizable PowerPoint theme that can be put to use immediately. So, download it and address the topic impactfully.
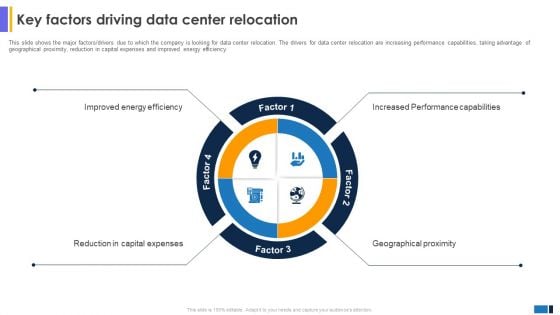
Key Factors Driving Data Center Relocation Data Center Migration Information Technology Background PDF
This slide shows the major factors drivers due to which the company is looking for data center relocation. The drivers for data center relocation are increasing performance capabilities, taking advantage of geographical proximity, reduction in capital expenses and improved energy efficiency. If you are looking for a format to display your unique thoughts, then the professionally designed Key Factors Driving Data Center Relocation Data Center Migration Information Technology Background PDF is the one for you. You can use it as a Google Slides template or a PowerPoint template. Incorporate impressive visuals, symbols, images, and other charts. Modify or reorganize the text boxes as you desire. Experiment with shade schemes and font pairings. Alter, share or cooperate with other people on your work. Download Key Factors Driving Data Center Relocation Data Center Migration Information Technology Background PDF and find out how to give a successful presentation. Present a perfect display to your team and make your presentation unforgettable.
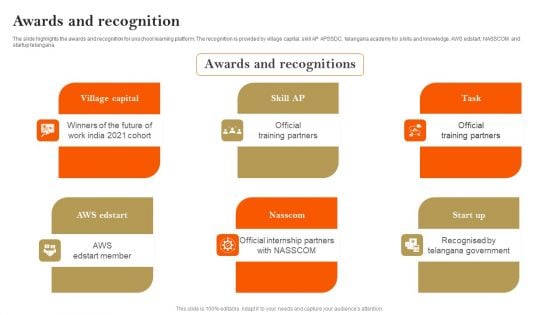
E Learning Platform Company Profile Awards And Recognition Ideas PDF
The slide highlights the awards and recognition for unschool learning platform. The recognition is provided by village capital, skill AP APSSDC, telangana academy for skills and knowledge, AWS edstart, NASSCOM and startup telangana. If you are looking for a format to display your unique thoughts, then the professionally designed E Learning Platform Company Profile Awards And Recognition Ideas PDF is the one for you. You can use it as a Google Slides template or a PowerPoint template. Incorporate impressive visuals, symbols, images, and other charts. Modify or reorganize the text boxes as you desire. Experiment with shade schemes and font pairings. Alter, share or cooperate with other people on your work. Download E Learning Platform Company Profile Awards And Recognition Ideas PDF and find out how to give a successful presentation. Present a perfect display to your team and make your presentation unforgettable.
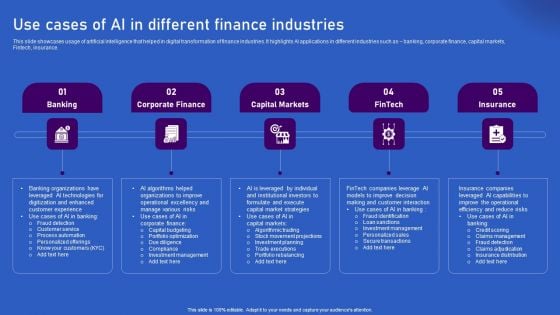
Ways Artificial Intelligence Is Transforming Finance Sector Use Cases Of AI In Different Finance Industries Diagrams PDF
This slide showcases usage of artificial intelligence that helped in digital transformation of finance industries. It highlights AI applications in different industries such as banking, corporate finance, capital markets, Fintech, insurance. Find highly impressive Ways Artificial Intelligence Is Transforming Finance Sector Use Cases Of AI In Different Finance Industries Diagrams PDF on Slidegeeks to deliver a meaningful presentation. You can save an ample amount of time using these presentation templates. No need to worry to prepare everything from scratch because Slidegeeks experts have already done a huge research and work for you. You need to download Ways Artificial Intelligence Is Transforming Finance Sector Use Cases Of AI In Different Finance Industries Diagrams PDF for your upcoming presentation. All the presentation templates are 100 percent editable and you can change the color and personalize the content accordingly. Download now.
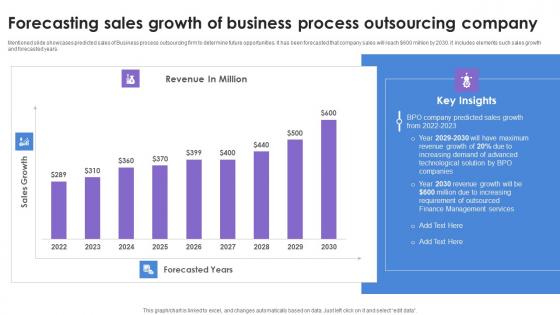
Forecasting Sales Growth Of Business Process Outsourcing Company Summary Pdf
Mentioned slide showcases predicted sales of Business process outsourcing firm to determine future opportunities. It has been forecasted that company sales will reach dollar600 million by 2030. it includes elements such sales growth and forecasted years. Showcasing this set of slides titled Forecasting Sales Growth Of Business Process Outsourcing Company Summary Pdf. The topics addressed in these templates are Revenue In Million, Forecasted Years. All the content presented in this PPT design is completely editable. Download it and make adjustments in color, background, font etc. as per your unique business setting. Mentioned slide showcases predicted sales of Business process outsourcing firm to determine future opportunities. It has been forecasted that company sales will reach dollar600 million by 2030. it includes elements such sales growth and forecasted years.
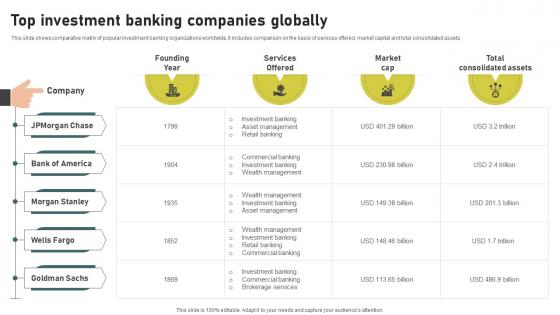
Top Investment Banking Companies Investment Banking Simplified Functions Fin SS V
This slide shows comparative matrix of popular investment banking organizations worldwide. It includes comparison on the basis of services offered, market capital and total consolidated assets. If you are looking for a format to display your unique thoughts, then the professionally designed Top Investment Banking Companies Investment Banking Simplified Functions Fin SS V is the one for you. You can use it as a Google Slides template or a PowerPoint template. Incorporate impressive visuals, symbols, images, and other charts. Modify or reorganize the text boxes as you desire. Experiment with shade schemes and font pairings. Alter, share or cooperate with other people on your work. Download Top Investment Banking Companies Investment Banking Simplified Functions Fin SS V and find out how to give a successful presentation. Present a perfect display to your team and make your presentation unforgettable. This slide shows comparative matrix of popular investment banking organizations worldwide. It includes comparison on the basis of services offered, market capital and total consolidated assets.
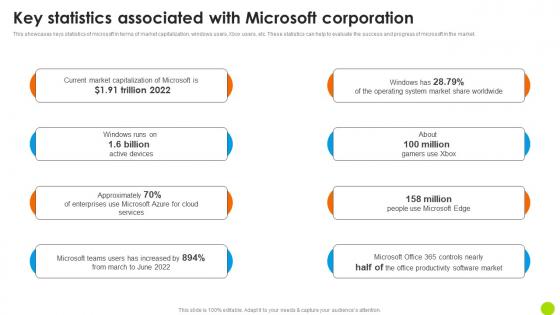
Key Statistics Associated With Microsoft Corporation Microsoft Long Term Business Pictures PDF
This showcases keys statistics of microsoft in terms of market capitalization, windows users, Xbox users, etc. These statistics can help to evaluate the success and progress of microsoft in the market. This Key Statistics Associated With Microsoft Corporation Microsoft Long Term Business Pictures PDF is perfect for any presentation, be it in front of clients or colleagues. It is a versatile and stylish solution for organizing your meetings. The Key Statistics Associated With Microsoft Corporation Microsoft Long Term Business Pictures PDF features a modern design for your presentation meetings. The adjustable and customizable slides provide unlimited possibilities for acing up your presentation. Slidegeeks has done all the homework before launching the product for you. So, do not wait, grab the presentation templates today This showcases keys statistics of microsoft in terms of market capitalization, windows users, Xbox users, etc. These statistics can help to evaluate the success and progress of microsoft in the market.
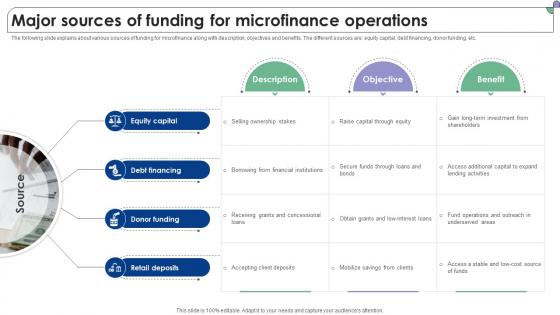
Major Sources Of Funding For Microfinance Operations Complete Guide To Microfinance Fin SS V
The following slide explains about various sources of funding for microfinance along with description, objectives and benefits. The different sources are equity capital, debt financing, donor funding, etc. This Major Sources Of Funding For Microfinance Operations Complete Guide To Microfinance Fin SS V is perfect for any presentation, be it in front of clients or colleagues. It is a versatile and stylish solution for organizing your meetings. The Major Sources Of Funding For Microfinance Operations Complete Guide To Microfinance Fin SS V features a modern design for your presentation meetings. The adjustable and customizable slides provide unlimited possibilities for acing up your presentation. Slidegeeks has done all the homework before launching the product for you. So, do not wait, grab the presentation templates today The following slide explains about various sources of funding for microfinance along with description, objectives and benefits. The different sources are equity capital, debt financing, donor funding, etc.
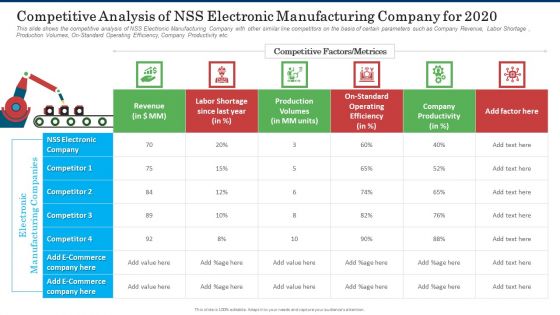
Competitive Analysis Of NSS Electronic Manufacturing Company For 2020 Themes PDF
This slide shows the competitive analysis of NSS Electronic Manufacturing Company with other similar line competitors on the basis of certain parameters such as Company Revenue, Labor Shortage , Production Volumes, On Standard Operating Efficiency, Company Productivity etc. Deliver an awe inspiring pitch with this creative competitive analysis of nss electronic manufacturing company for 2020 themes pdf bundle. Topics like revenue, labor shortage since last year, production volumes, on standard operating efficiency, company productivity, metrices can be discussed with this completely editable template. It is available for immediate download depending on the needs and requirements of the user.
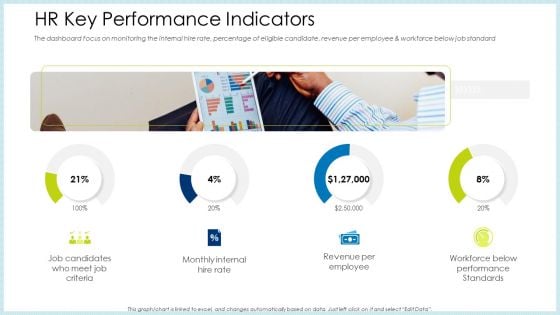
Technology Innovation Human Resource System HR Key Performance Indicators Ppt Styles Designs Download PDF
The dashboard focus on monitoring the internal hire rate, percentage of eligible candidate, revenue per employee and workforce below job standard. Presenting technology innovation human resource system hr key performance indicators ppt styles designs download pdf to provide visual cues and insights. Share and navigate important information on four stages that need your due attention. This template can be used to pitch topics like revenue per employee, performance standards, internal rate. In addition, this PPT design contains high-resolution images, graphics, etc, that are easily editable and available for immediate download.
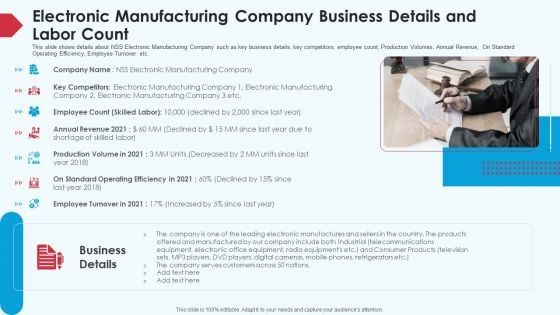
Skill Shortage In A Production Firm Case Study Solution Electronic Manufacturing Company Business Details And Labor Count Designs PDF
This slide shows details about NSS Electronic Manufacturing Company such as key business details, key competitors, employee count, Production Volumes, Annual Revenue, On Standard Operating Efficiency, Employee Turnover etc. Presenting skill shortage in a production firm case study solution electronic manufacturing company business details and labor count designs pdf to provide visual cues and insights. Share and navigate important information on one stage that need your due attention. This template can be used to pitch topics like annual revenue, manufacturing, business details, standard operating efficiency. In addtion, this PPT design contains high resolution images, graphics, etc, that are easily editable and available for immediate download.
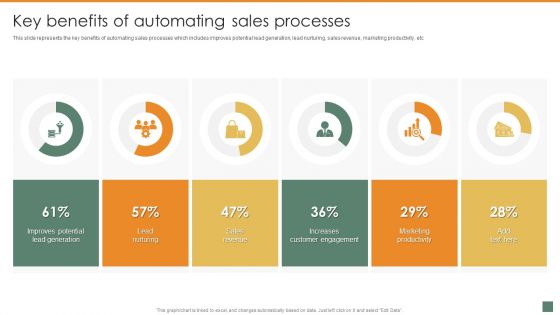
Key Benefits Of Automating Sales Processes Summary And Significance Of Sales Automation Diagrams PDF
This slide represents the key benefits of automating sales processes which includes improves potential lead generation, lead nurturing, sales revenue, marketing productivity, etc. Formulating a presentation can take up a lot of effort and time, so the content and message should always be the primary focus. The visuals of the PowerPoint can enhance the presenters message, so our Key Benefits Of Automating Sales Processes Summary And Significance Of Sales Automation Diagrams PDF was created to help save time. Instead of worrying about the design, the presenter can concentrate on the message while our designers work on creating the ideal templates for whatever situation is needed. Slidegeeks has experts for everything from amazing designs to valuable content, we have put everything into Key Benefits Of Automating Sales Processes Summary And Significance Of Sales Automation Diagrams PDF
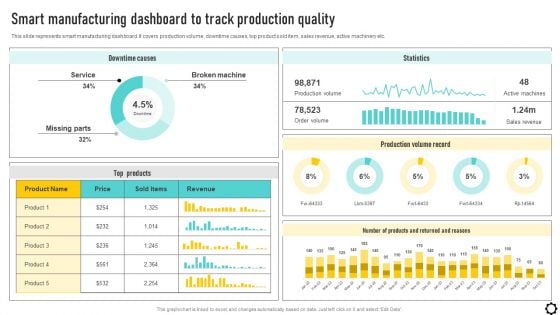
Optimizing Production Process Smart Manufacturing Dashboard To Track Production Diagrams PDF
This slide represents smart manufacturing dashboard. It covers production volume, downtime causes, top product sold item, sales revenue, active machinery etc. If you are looking for a format to display your unique thoughts, then the professionally designed Optimizing Production Process Smart Manufacturing Dashboard To Track Production Diagrams PDF is the one for you. You can use it as a Google Slides template or a PowerPoint template. Incorporate impressive visuals, symbols, images, and other charts. Modify or reorganize the text boxes as you desire. Experiment with shade schemes and font pairings. Alter, share or cooperate with other people on your work. Download Optimizing Production Process Smart Manufacturing Dashboard To Track Production Diagrams PDF and find out how to give a successful presentation. Present a perfect display to your team and make your presentation unforgettable.
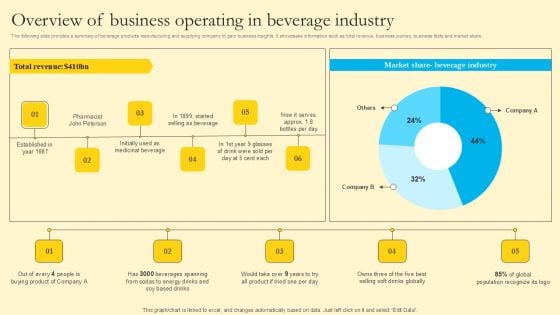
Comprehensive Guide For Sales And Advertising Processes Overview Of Business Operating In Beverage Industry Clipart PDF

HR Scoreboard With Status And Trend Mockup PDF
The purpose of this slide is to illustrate the human resource strategic scorecard in order to measure the leading or downward indicators of HRM performance. the key attributes include hires by month, revenue per employee, employee retention along with status and trend. Showcasing this set of slides titled HR Scoreboard With Status And Trend Mockup PDF. The topics addressed in these templates are Revenue Per Employee, Employee Retention, Executive Scorecard. All the content presented in this PPT design is completely editable. Download it and make adjustments in color, background, font etc. as per your unique business setting.


 Continue with Email

 Home
Home


