financial
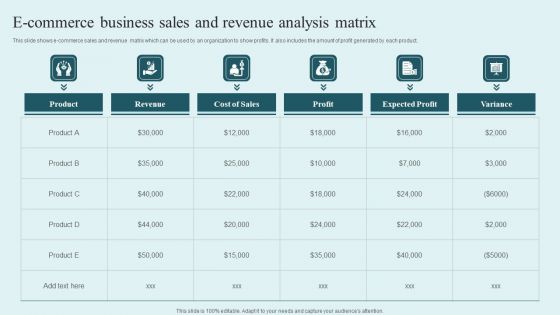
E Commerce Business Sales And Revenue Analysis Matrix Infographics PDF
This slide shows e-commerce sales and revenue matrix which can be used by an organization to show profits. It also includes the amount of profit generated by each product. Pitch your topic with ease and precision using this E Commerce Business Sales And Revenue Analysis Matrix Infographics PDF. This layout presents information on Product, Revenue, Cost Sales, Profit. It is also available for immediate download and adjustment. So, changes can be made in the color, design, graphics or any other component to create a unique layout.
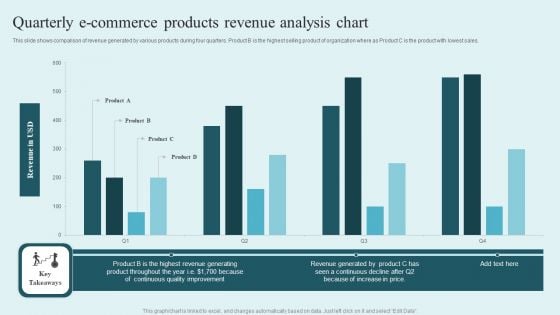
Quarterly E Commerce Products Revenue Analysis Chart Guidelines PDF
This slide shows comparison of revenue generated by various products during four quarters. Product B is the highest selling product of organization where as Product C is the product with lowest sales. Showcasing this set of slides titled Quarterly E Commerce Products Revenue Analysis Chart Guidelines PDF. The topics addressed in these templates are Revenue USD, Product, Continuous Quality Improvement. All the content presented in this PPT design is completely editable. Download it and make adjustments in color, background, font etc. as per your unique business setting.
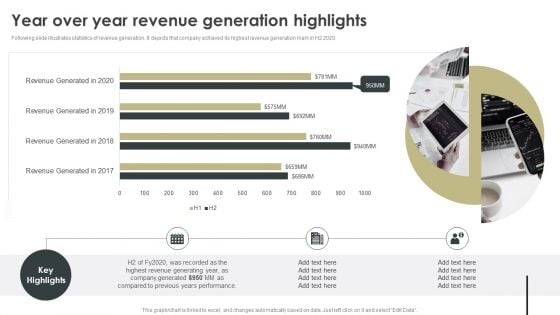
Year Over Year Revenue Generation Highlights Inspiration PDF
Following slide illustrates statistics of revenue generation. It depicts that company achieved its highest revenue generation mark in H2 2020. This Year Over Year Revenue Generation Highlights Inspiration PDF from Slidegeeks makes it easy to present information on your topic with precision. It provides customization options, so you can make changes to the colors, design, graphics, or any other component to create a unique layout. It is also available for immediate download, so you can begin using it right away. Slidegeeks has done good research to ensure that you have everything you need to make your presentation stand out. Make a name out there for a brilliant performance.
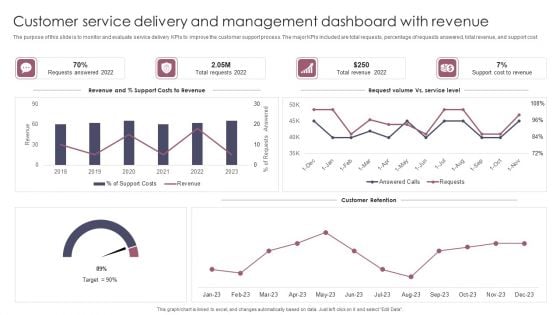
Customer Service Delivery And Management Dashboard With Revenue Brochure PDF
The purpose of this slide is to monitor and evaluate service delivery KPIs to improve the customer support process. The major KPIs included are total requests, percentage of requests answered, total revenue, and support cost. Pitch your topic with ease and precision using this Customer Service Delivery And Management Dashboard With Revenue Brochure PDF. This layout presents information on Customer Service Delivery, Management Dashboard With Revenue. It is also available for immediate download and adjustment. So, changes can be made in the color, design, graphics or any other component to create a unique layout.
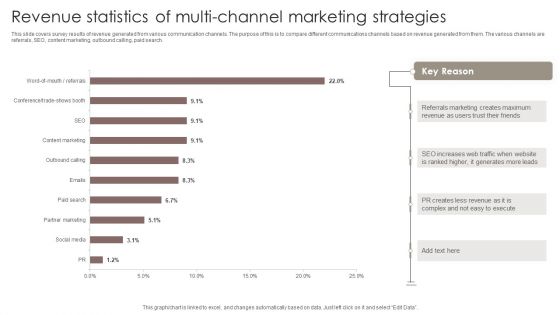
Revenue Statistics Of Multi Channel Marketing Strategies Microsoft PDF
This slide covers survey results of revenue generated from various communication channels. The purpose of this is to compare different communications channels based on revenue generated from them. The various channels are referrals, SEO, content marketing, outbound calling, paid search.Pitch your topic with ease and precision using this Revenue Statistics Of Multi Channel Marketing Strategies Microsoft PDF. This layout presents information on Referrals Marketing, Creates Maximum, Generates Leads. It is also available for immediate download and adjustment. So, changes can be made in the color, design, graphics or any other component to create a unique layout.
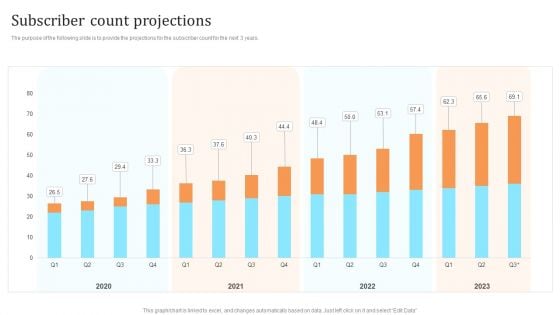
Membership Based Revenue Plan Subscriber Count Projections Template PDF
Membership Based Revenue Plan Subscriber Count Projections Template PDF Explore a selection of the finest Membership Based Revenue Plan Subscriber Count Projections Template PDF here. With a plethora of professionally designed and pre-made slide templates, you can quickly and easily find the right one for your upcoming presentation. You can use our Membership Based Revenue Plan Subscriber Count Projections Template PDF to effectively convey your message to a wider audience. Slidegeeks has done a lot of research before preparing these presentation templates. The content can be personalized and the slides are highly editable. Grab templates today from Slidegeeks.
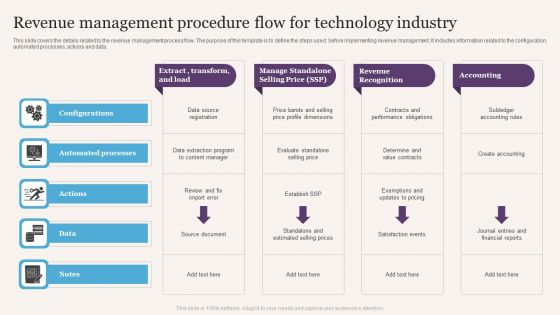
Revenue Management Procedure Flow For Technology Industry Ideas PDF
This slide covers the details related to the revenue management process flow. The purpose of this template is to define the steps used before implementing revenue management. It includes information related to the configuration, automated processes, actions and data. Pitch your topic with ease and precision using this Revenue Management Procedure Flow For Technology Industry Ideas PDF. This layout presents information on Automated Processes, Data, Price. It is also available for immediate download and adjustment. So, changes can be made in the color, design, graphics or any other component to create a unique layout.
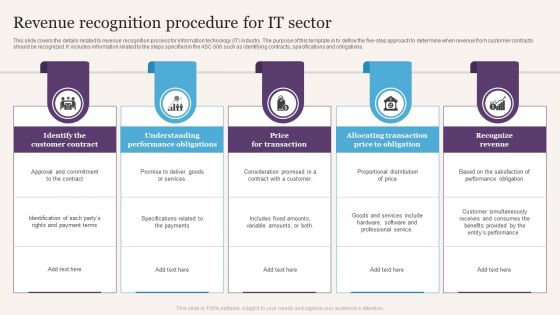
Revenue Recognition Procedure For IT Sector Topics PDF
This slide covers the details related to revenue recognition process for information technology IT industry. The purpose of this template is to define the five step approach to determine when revenue from customer contracts should be recognized. It includes information related to the steps specified in the ASC 606 such as identifying contracts, specifications and obligations. Showcasing this set of slides titled Revenue Recognition Procedure For IT Sector Topics PDF. The topics addressed in these templates are Services, Customer, Price. All the content presented in this PPT design is completely editable. Download it and make adjustments in color, background, font etc. as per your unique business setting.
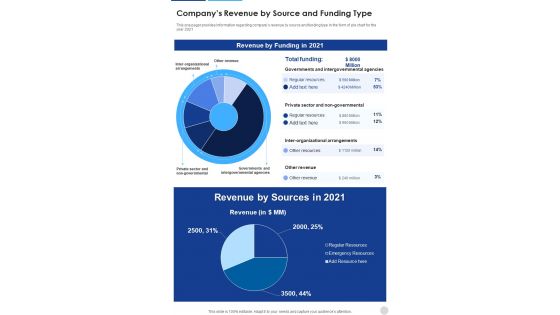
Companys Revenue By Source And Funding Type One Pager Documents
This one pager provides information regarding companys revenue by source and funding type in the form of pie chart for the year 2021. Presenting you an exemplary Companys Revenue By Source And Funding Type One Pager Documents. Our one-pager comprises all the must-have essentials of an inclusive document. You can edit it with ease, as its layout is completely editable. With such freedom, you can tweak its design and other elements to your requirements. Download this Companys Revenue By Source And Funding Type One Pager Documents brilliant piece now.
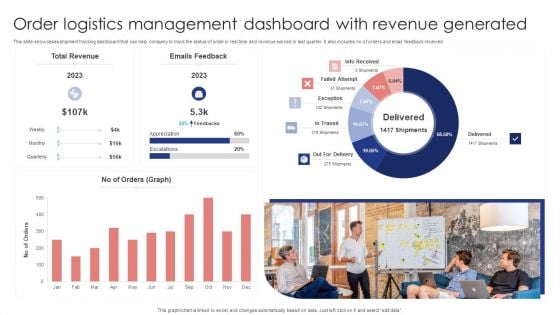
Order Logistics Management Dashboard With Revenue Generated Slides PDF
This slide showcases shipment tracking dashboard that can help company to track the status of order in real time and revenue earned in last quarter. It also includes no of orders and email feedback received. Showcasing this set of slides titled Order Logistics Management Dashboard With Revenue Generated Slides PDF. The topics addressed in these templates are Total Revenue, Emails Feedback, Orders Graph. All the content presented in this PPT design is completely editable. Download it and make adjustments in color, background, font etc. as per your unique business setting.
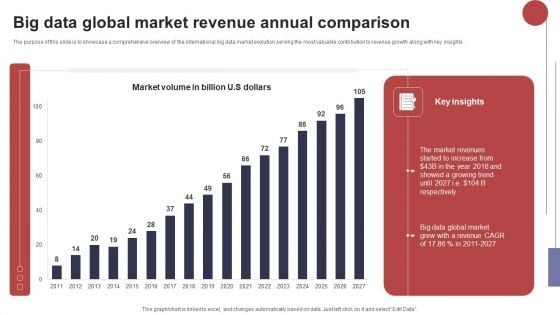
Big Data Global Market Revenue Annual Comparison Structure PDF
The purpose of this slide is to showcase a comprehensive overview of the international big data market evolution serving the most valuable contribution to revenue growth along with key insights. Pitch your topic with ease and precision using this Big Data Global Market Revenue Annual Comparison Structure PDF. This layout presents information on Market Revenues, Global Market, Growing Trend. It is also available for immediate download and adjustment. So, changes can be made in the color, design, graphics or any other component to create a unique layout.
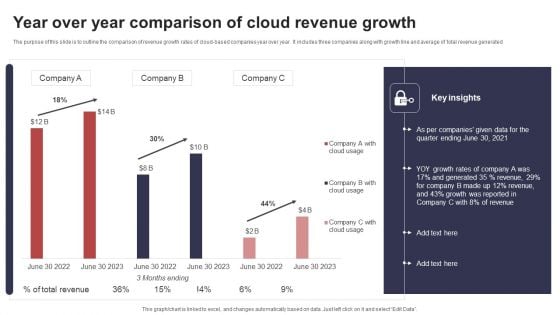
Year Over Year Comparison Of Cloud Revenue Growth Sample PDF
The purpose of this slide is to outline the comparison of revenue growth rates of cloud based companies year over year. It includes three companies along with growth line and average of total revenue generated. Showcasing this set of slides titled Year Over Year Comparison Of Cloud Revenue Growth Sample PDF. The topics addressed in these templates are Yoy Growth Rates, Generated, Growth Reported. All the content presented in this PPT design is completely editable. Download it and make adjustments in color, background, font etc. as per your unique business setting.
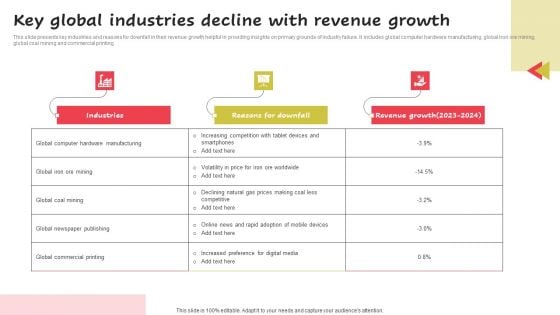
Key Global Industries Decline With Revenue Growth Diagrams PDF
This slide presents key industries and reasons for downfall in their revenue growth helpful in providing insights on primary grounds of industry failure. It includes global computer hardware manufacturing, global iron ore mining, global coal mining and commercial printing. Showcasing this set of slides titled Key Global Industries Decline With Revenue Growth Diagrams PDF. The topics addressed in these templates are Industries, Reasons Downfall, Revenue Growth. All the content presented in this PPT design is completely editable. Download it and make adjustments in color, background, font etc. as per your unique business setting.
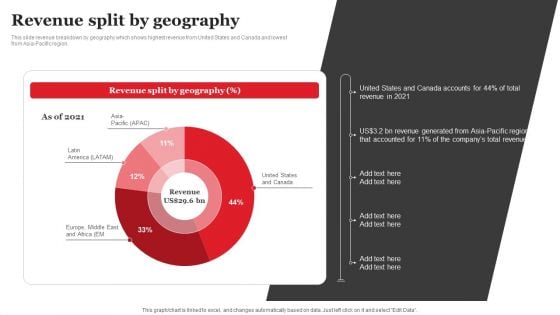
Streaming Platform Company Outline Revenue Split By Geography Guidelines PDF
This slide revenue breakdown by geography which shows highest revenue from United States and Canada and lowest from Asia-Pacific region. Slidegeeks is here to make your presentations a breeze with Streaming Platform Company Outline Revenue Split By Geography Guidelines PDF With our easy to use and customizable templates, you can focus on delivering your ideas rather than worrying about formatting. With a variety of designs to choose from, you are sure to find one that suits your needs. And with animations and unique photos, illustrations, and fonts, you can make your presentation pop. So whether you are giving a sales pitch or presenting to the board, make sure to check out Slidegeeks first.

Evaluating Sales Revenue Budget To Control Risks Sample PDF
The following slide depicts the projected five year sales revenue budget to evaluate companys future performance. It mainly includes elements such as total units in pipeline, growth and conversion rate, annual units to be sold, price per unit, total revenue etc. From laying roadmaps to briefing everything in detail, our templates are perfect for you. You can set the stage with your presentation slides. All you have to do is download these easy to edit and customizable templates. Evaluating Sales Revenue Budget To Control Risks Sample PDF will help you deliver an outstanding performance that everyone would remember and praise you for. Do download this presentation today.
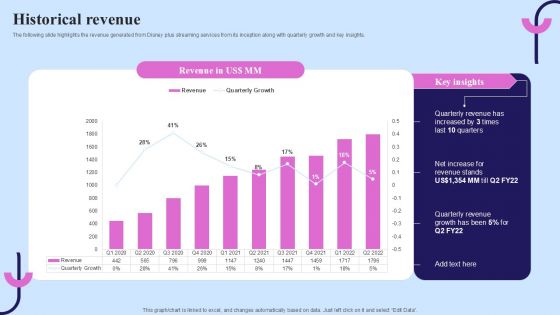
Video Streaming Technology Company Introduction Historical Revenue Topics PDF
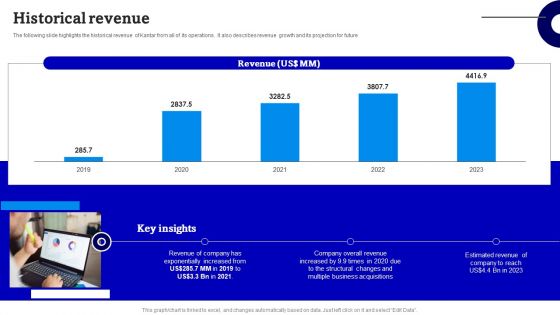
Consulting Firm Business Profile Historical Revenue Elements PDF
The following slide highlights the historical revenue of Kantar from all of its operations. It also describes revenue growth and its projection for future This modern and well arranged Consulting Firm Business Profile Historical Revenue Elements PDF provides lots of creative possibilities. It is very simple to customize and edit with the Powerpoint Software. Just drag and drop your pictures into the shapes. All facets of this template can be edited with Powerpoint no extra software is necessary. Add your own material, put your images in the places assigned for them, adjust the colors, and then you can show your slides to the world, with an animated slide included.
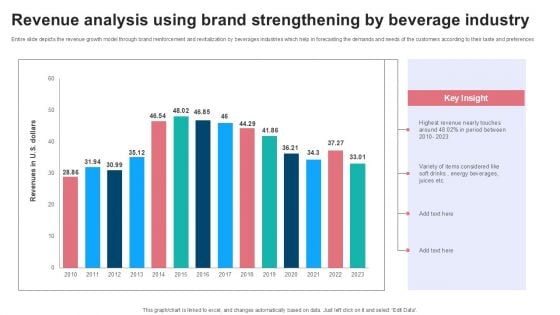
Revenue Analysis Using Brand Strengthening By Beverage Industry Microsoft PDF
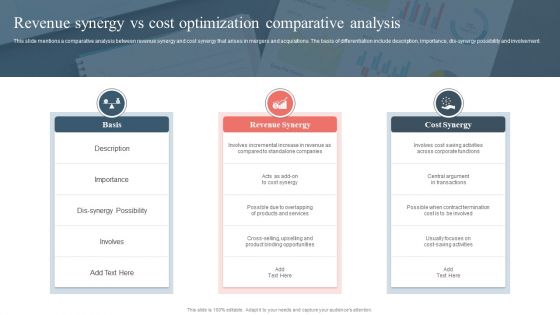
Revenue Synergy Vs Cost Optimization Comparative Analysis Structure PDF
This slide mentions a comparative analysis between revenue synergy and cost synergy that arises in mergers and acquisitions. The basis of differentiation include description, importance, dis-synergy possibility and involvement. Persuade your audience using this Revenue Synergy Vs Cost Optimization Comparative Analysis Structure PDF. This PPT design covers three stages, thus making it a great tool to use. It also caters to a variety of topics including Basis, Revenue Synergy, Cost Synergy. Download this PPT design now to present a convincing pitch that not only emphasizes the topic but also showcases your presentation skills.
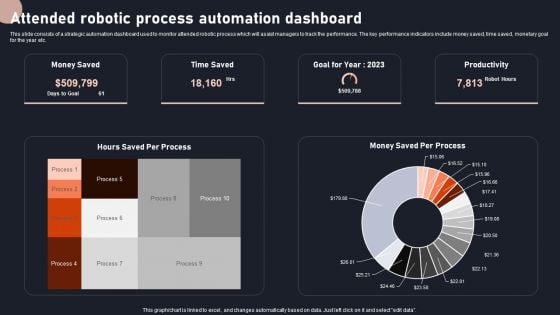
Attended Robotic Process Automation Dashboard Rules PDF
This slide consists of a strategic automation dashboard used to monitor attended robotic process which will assist managers to track the performance. The key performance indicators include money saved, time saved, monetary goal for the year etc. Showcasing this set of slides titled Attended Robotic Process Automation Dashboard Rules PDF. The topics addressed in these templates are Productivity, Goal, Process Automation Dashboard. All the content presented in this PPT design is completely editable. Download it and make adjustments in color, background, font etc. as per your unique business setting.
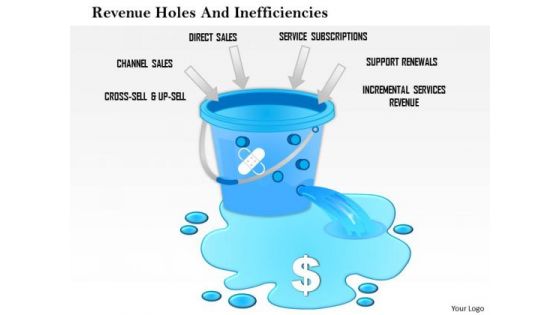
Business Framework Revenue Holes And Inefficiencies PowerPoint Presentation
Use this diagram in business presentations to display revenue holes and inefficiencies. You can use this diagram to make awesome presentations and describe the entire process in an impressive manner.
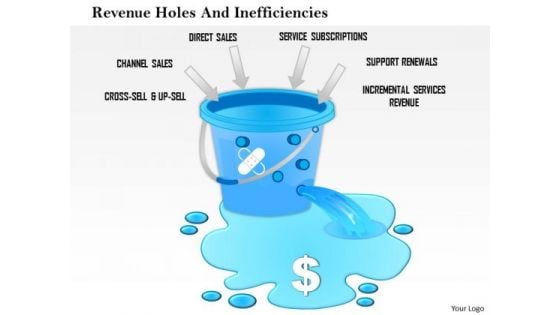
Business Framework Revenue Holes And Inefficiencies PowerPoint Presentation 1
Use this diagram in business presentations to display revenue holes and inefficiencies. You can use this diagram to make awesome presentations and describe the entire process in an impressive manner.
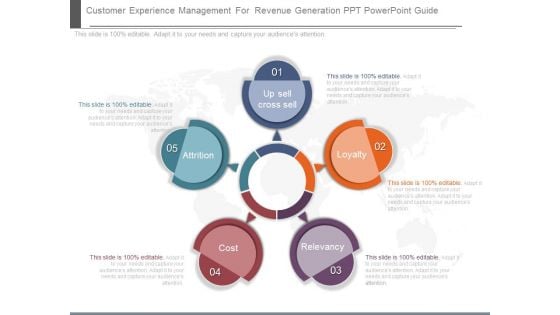
Customer Experience Management For Revenue Generation Ppt Powerpoint Guide
This is a customer experience management for revenue generation ppt powerpoint guide. This is a five stage process. The stages in this process are attrition, up sell cross sell, loyalty, relevancy, cost.
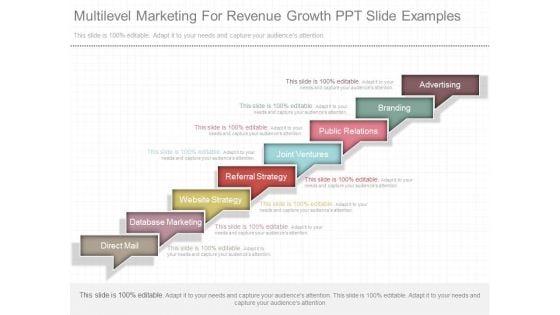
Multilevel Marketing For Revenue Growth Ppt Slide Examples
This is a multilevel marketing for revenue growth ppt slide examples. This is a eight stage process. The stages in this process are direct mail, database marketing, website strategy, referral strategy, joint ventures, public relations, branding, advertising.
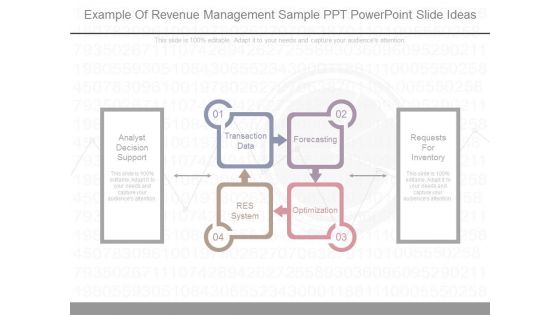
Example Of Revenue Management Sample Ppt Powerpoint Slide Ideas
This is a example of revenue management sample ppt powerpoint slide ideas. This is a four stage process. The stages in this process are transaction data, forecasting, res system, optimization, analyst decision support, requests for inventory.
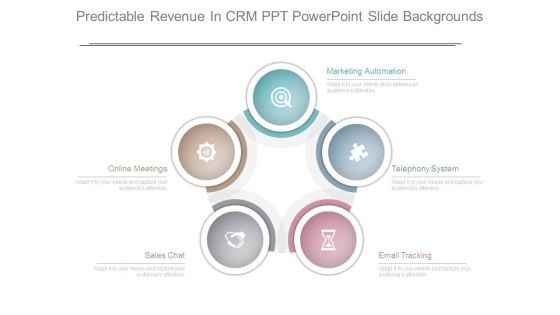
Predictable Revenue In Crm Ppt Powerpoint Slide Backgrounds
This is a predictable revenue in crm ppt powerpoint slide backgrounds. This is a five stage process. The stages in this process are marketing automation, telephony system, email tracking, sales chat, online meetings.
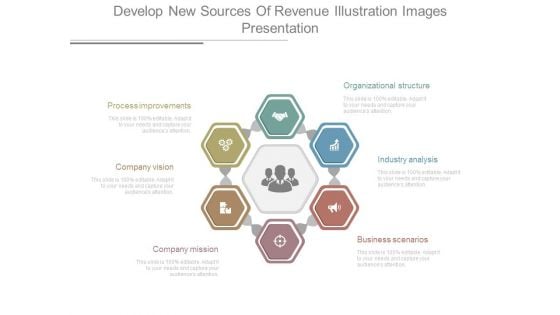
Develop New Sources Of Revenue Illustration Images Presentation
This is a develop new sources of revenue illustration images presentation. This is a six stage process. The stages in this process are organizational structure, industry analysis, business scenarios, company mission, company vision, process improvements.
Develop New Sources Of Revenue Illustration Ppt Icon
This is a develop new sources of revenue illustration ppt icon. This is a six stage process. The stages in this process are company mission, process improvements, company vision, business scenarios, strategic planning, industry analysis.
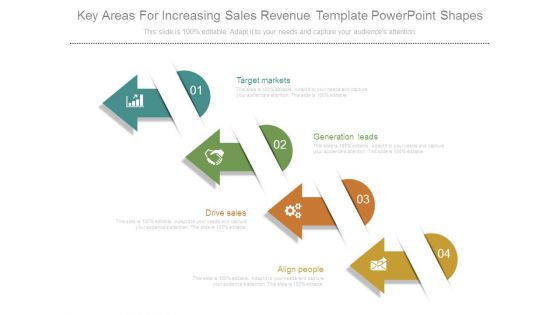
Key Areas For Increasing Sales Revenue Template Powerpoint Shapes
This is a key areas for increasing sales revenue template powerpoint shapes. This is a four stage process. The stages in this process are target markets, generation leads, drive sales, align people.
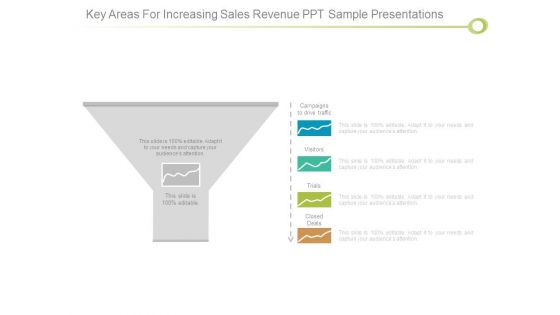
Key Areas For Increasing Sales Revenue Ppt Sample Presentations
This is a key areas for increasing sales revenue ppt sample presentations. This is a one stage process. The stages in this process are campaigns to drive traffic, visitors, trials, closed deals.

Revenue Growth For Bar Graph Ppt Examples Slides
This is a revenue growth for bar graph ppt examples slides. This is a five stage process. The stages in this process are bar graph, years, business, growth, marketing.
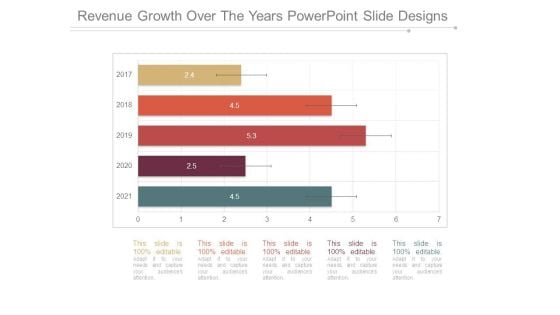
Revenue Growth Over The Years Powerpoint Slide Designs
This is a revenue growth over the years powerpoint slide designs. This is a five stage process. The stages in this process are bar graph, years, business, growth, marketing.
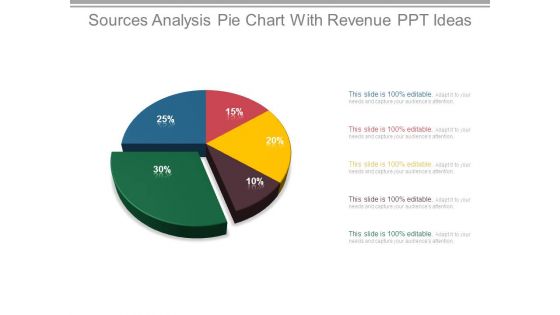
Sources Analysis Pie Chart With Revenue Ppt Ideas
This is a sources analysis pie chart with revenue ppt ideas. This is a five stage process. The stages in this process are finance, success, business, marketing, percentage, pie chart.
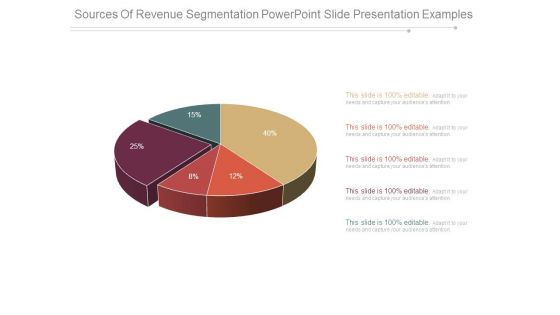
Sources Of Revenue Segmentation Powerpoint Slide Presentation Examples
This is a sources of revenue segmentation powerpoint slide presentation examples. This is a five stage process. The stages in this process are finance, success, business, marketing, percentage, pie chart.
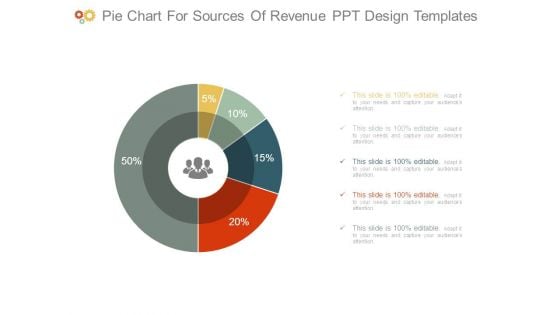
Pie Chart For Sources Of Revenue Ppt Design Templates
This is a pie chart for sources of revenue ppt design templates. This is a five stage process. The stages in this process are finance, success, business, marketing, percentage, donut.
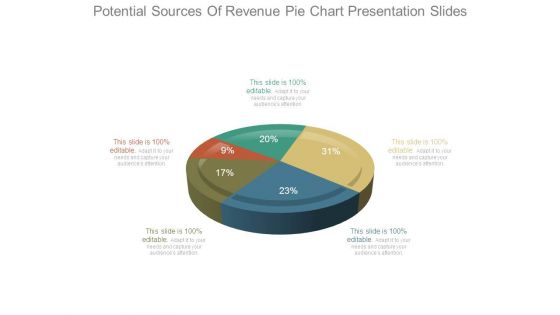
Potential Sources Of Revenue Pie Chart Presentation Slides
This is a potential sources of revenue pie chart presentation slides. This is a five stage process. The stages in this process are finance, success, business, marketing, percentage, pie.
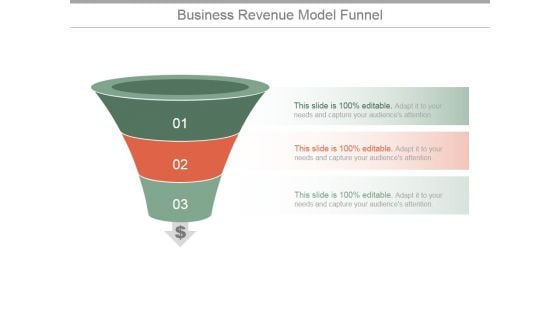
Business Revenue Model Funnel Ppt PowerPoint Presentation Information
This is a business revenue model funnel ppt powerpoint presentation information. This is a three stage process. The stages in this process are business, process, funnel, marketing, strategy, success.
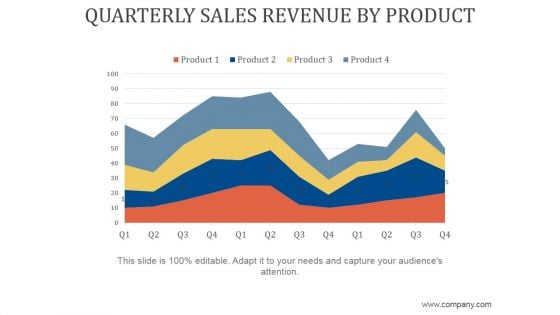
Quarterly Sales Revenue By Product Ppt PowerPoint Presentation Background Designs
This is a quarterly sales revenue by product ppt powerpoint presentation background designs. This is a four stage process. The stages in this process are business, strategy, marketing, analysis, growth strategy.
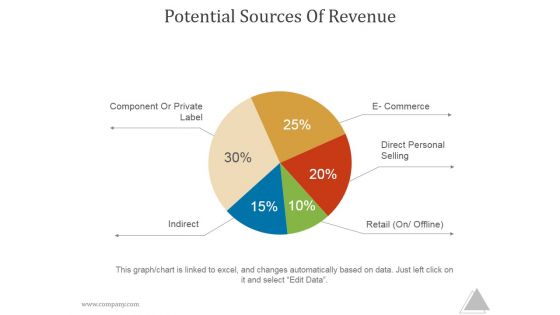
Potential Sources Of Revenue Ppt PowerPoint Presentation Background Designs
This is a potential sources of revenue ppt powerpoint presentation background designs. This is a five stage process. The stages in this process are e commerce, direct personal selling, retail on offline, component or private label indirect.
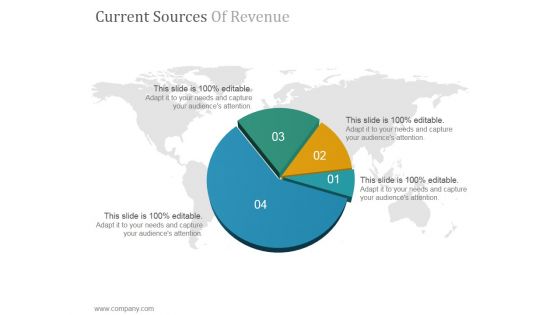
Current Sources Of Revenue Ppt PowerPoint Presentation Example 2015
This is a current sources of revenue ppt powerpoint presentation example 2015. This is a four stage process. The stages in this process are pie, division, map, finance, company.
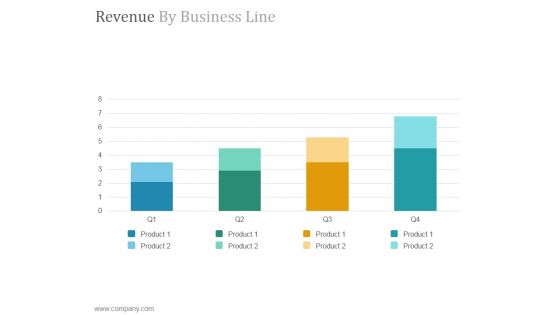
Revenue By Business Line Ppt PowerPoint Presentation Example File
This is a revenue by business line ppt powerpoint presentation example file. This is a four stage process. The stages in this process are product, growth, graph, business, success.
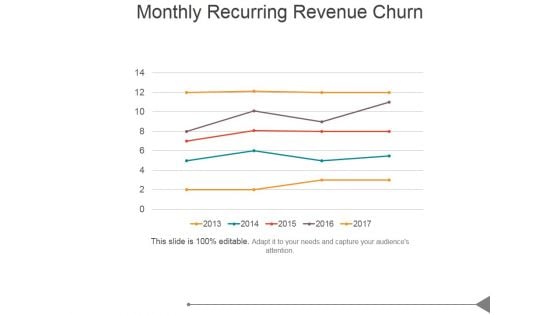
Monthly Recurring Revenue Churn Template 1 Ppt PowerPoint Presentation Clipart
This is a monthly recurring revenue churn template 1 ppt powerpoint presentation clipart. This is a one stage process. The stages in this process are business, marketing, success, in percentage, growth.
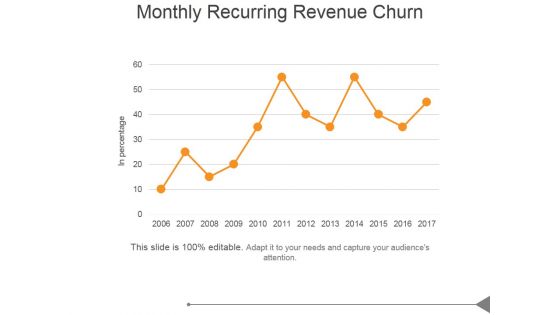
Monthly Recurring Revenue Churn Ppt PowerPoint Presentation Images
This is a monthly recurring revenue churn ppt powerpoint presentation images. This is a five stage process. The stages in this process are business, marketing, success, bar graph, growth.
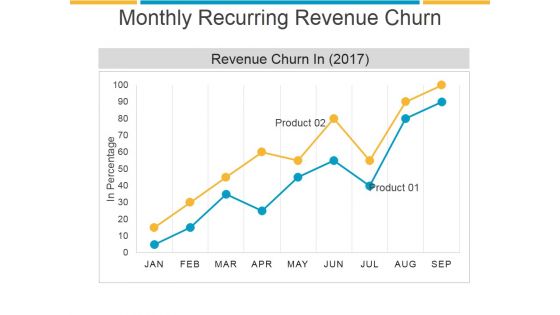
Monthly Recurring Revenue Churn Template 2 Ppt PowerPoint Presentation Gallery
This is a monthly recurring revenue churn template 2 ppt powerpoint presentation gallery. This is a two stage process. The stages in this process are growth, business, process, finance, success.
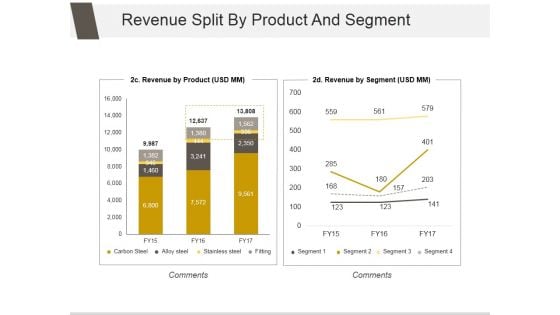
Revenue Split By Product And Segment Ppt PowerPoint Presentation Professional
This is a revenue split by product and segment ppt powerpoint presentation professional. This is a two stage process. The stages in this process are business, strategy, analysis, marketing, growth.
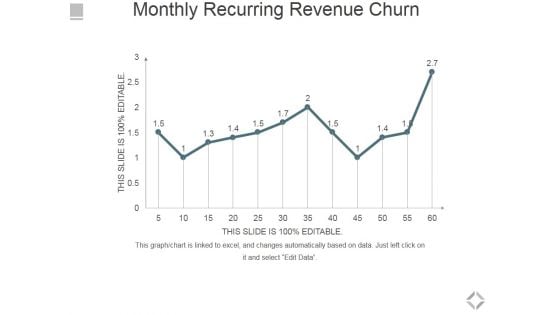
Monthly Recurring Revenue Churn Ppt PowerPoint Presentation Infographics Microsoft
This is a monthly recurring revenue churn ppt powerpoint presentation infographics microsoft. This is a one stage process. The stages in this process are bar graph, business, marketing, success, growth.
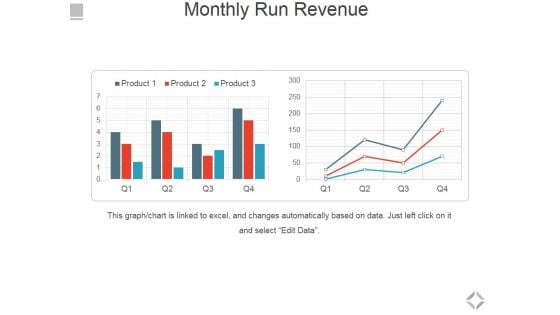
Monthly Run Revenue Ppt PowerPoint Presentation Show Styles
This is a monthly run revenue ppt powerpoint presentation show styles. This is a two stage process. The stages in this process are bar graph, business, marketing, success, growth.
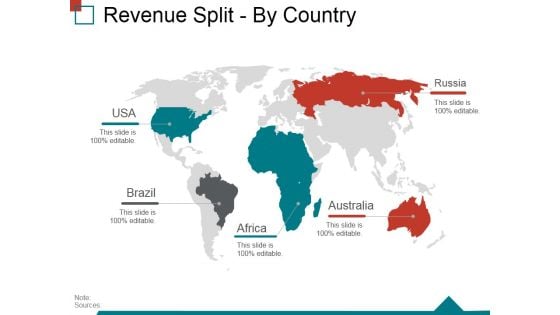
Revenue Split By Country Ppt PowerPoint Presentation Infographic Template Samples
This is a revenue split by country ppt powerpoint presentation infographic template samples. This is a five stage process. The stages in this process are usa, brazil, africa, africa, australia, russia.
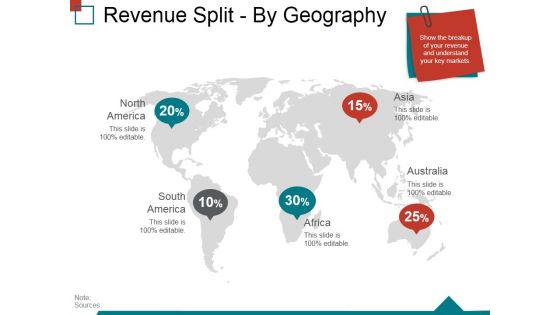
Revenue Split By Geography Ppt PowerPoint Presentation Gallery Slideshow
This is a revenue split by geography ppt powerpoint presentation gallery slideshow. This is a five stage process. The stages in this process are north america, south america, africa, australia, asia.
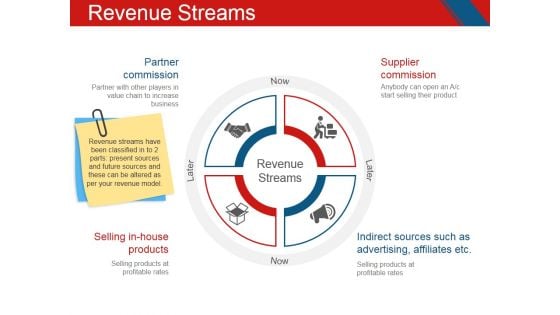
Revenue Streams Template 1 Ppt PowerPoint Presentation Infographics
This is a revenue streams template 1 ppt powerpoint presentation infographics. This is a four stage process. The stages in this process are partner commission, supplier commission, selling in house products, indirect sources such as advertising, affiliates.
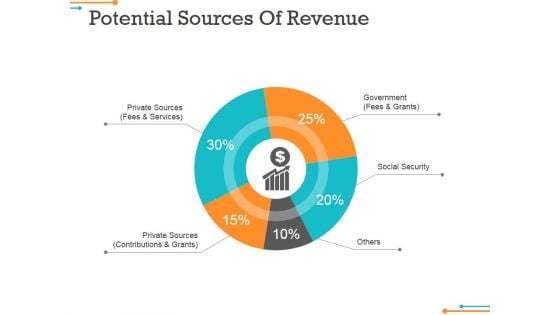
Potential Sources Of Revenue Ppt PowerPoint Presentation Ideas Inspiration
This is a potential sources of revenue ppt powerpoint presentation ideas inspiration. This is a five stage process. The stages in this process are government, social security, private sources, others.
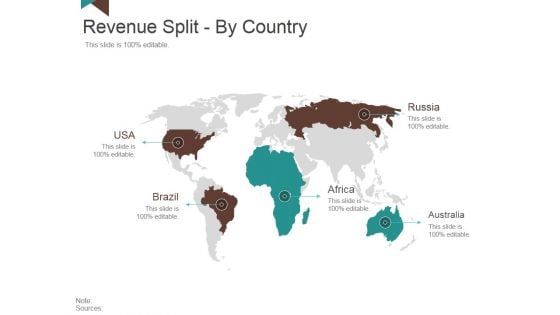
Revenue Split By Country Ppt PowerPoint Presentation Layouts Layout
This is a revenue split by country ppt powerpoint presentation layouts layout. This is a five stage process. The stages in this process are usa, brazil, africa russia, australia.
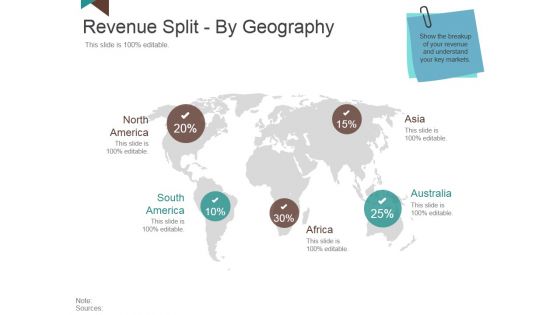
Revenue Split By Geography Ppt PowerPoint Presentation Summary Model
This is a revenue split by geography ppt powerpoint presentation summary model. This is a five stage process. The stages in this process are north america south america africa australia, asia.
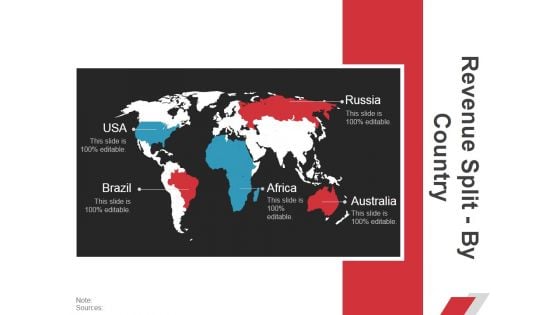
Revenue Split By Country Ppt PowerPoint Presentation Gallery Sample
This is a revenue split by country ppt powerpoint presentation gallery sample. This is a five stage process. The stages in this process are usa, russia, brazil, africa, australia.
Revenue Split By Geography Ppt PowerPoint Presentation Icon Styles
This is a revenue split by geography ppt powerpoint presentation icon styles. This is a five stage process. The stages in this process are north america, south america, asia, africa, australia.
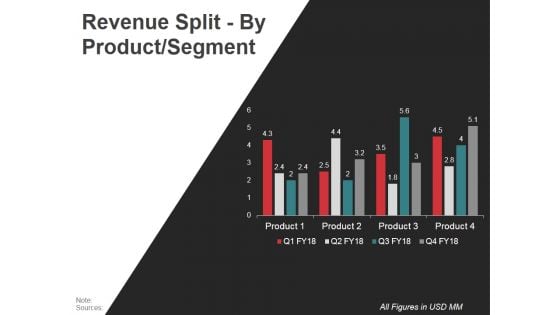
Revenue Split By Product Segment Template Ppt PowerPoint Presentation Graphics
This is a revenue split by product segment template ppt powerpoint presentation graphics. This is a four stage process. The stages in this process are product, business, marketing, planning, process.
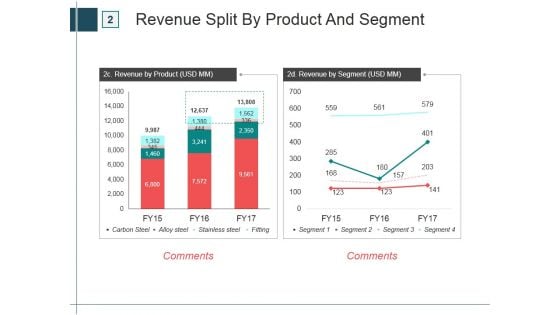
Revenue Split By Product And Segment Ppt PowerPoint Presentation Slide
This is a revenue split by product and segment ppt powerpoint presentation slide. This is a two stage process. The stages in this process are carbon steel, alloy steel, stainless steel, fitting.

Current Sources Of Revenue Ppt PowerPoint Presentation Layouts Portrait
This is a current sources of revenue ppt powerpoint presentation layouts portrait. This is a six stage process. The stages in this process are percentage, finance, business, process, marketing.

Potential Sources Of Revenue Ppt PowerPoint Presentation Infographics Structure
This is a potential sources of revenue ppt powerpoint presentation infographics structure. This is a five stage process. The stages in this process are government, social security, private sources, others.
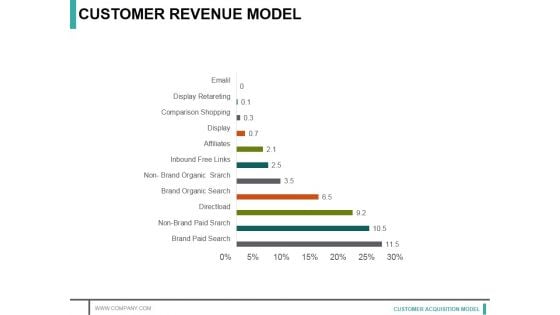
Customer Revenue Model Ppt PowerPoint Presentation Layouts Structure
This is a customer revenue model ppt powerpoint presentation layouts structure. This is a eleven stage process. The stages in this process are display, affiliates, inbound free links, directload.


 Continue with Email

 Home
Home


