financial

Business Growth Strategy And Revenue Model Ppt PowerPoint Presentation Complete Deck With Slides
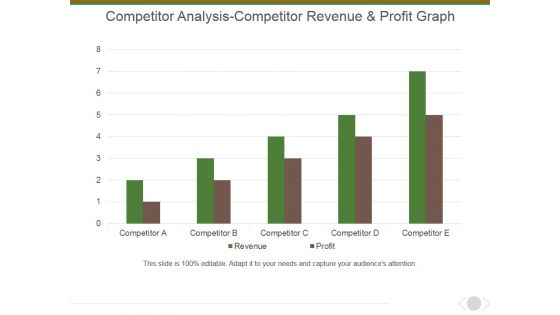
Competitor Analysis Competitor Revenue And Profit Graph Ppt PowerPoint Presentation Gallery Vector
This is a competitor analysis competitor revenue and profit graph ppt powerpoint presentation gallery vector. This is a five stage process. The stages in this process are bar graph, marketing, management, business, presentation.
Monthly Recurring Revenue Churn Template 1 Ppt PowerPoint Presentation Icon Microsoft
This is a monthly recurring revenue churn template 1 ppt powerpoint presentation icon microsoft. This is a four stage process. The stages in this process are bar graph, growth, success, business, marketing.
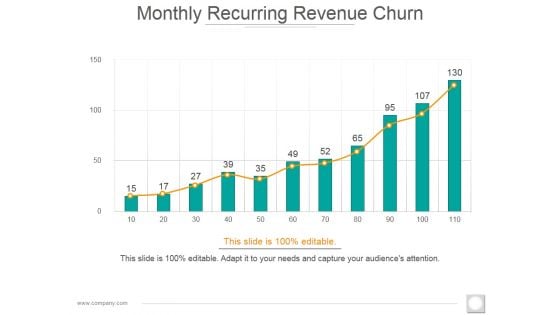
Monthly Recurring Revenue Churn Template 2 Ppt PowerPoint Presentation Diagram Images
This is a monthly recurring revenue churn template 2 ppt powerpoint presentation diagram images. This is a eleven stage process. The stages in this process are bar graph, growth, success, business, marketing.
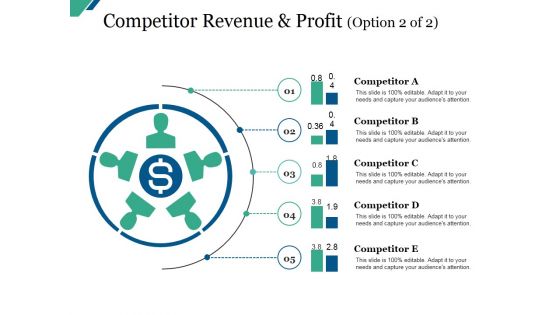
Competitor Revenue And Profit Template 1 Ppt PowerPoint Presentation Professional Slides
This is a competitor revenue and profit template 1 ppt powerpoint presentation professional slides. This is a five stage process. The stages in this process are business, marketing, circle, process, finance.
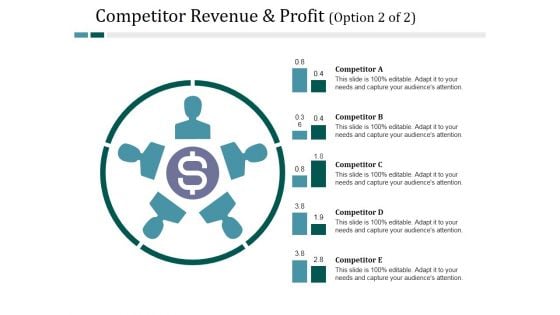
Competitor Revenue And Profit Template 2 Ppt PowerPoint Presentation Styles Examples
This is a competitor revenue and profit template 2 ppt powerpoint presentation styles examples. This is a five stage process. The stages in this process are business, process, management, strategy, competitor.
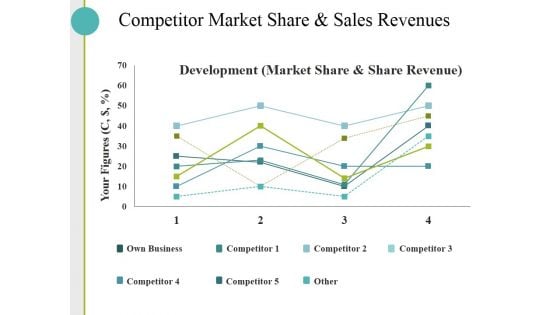
Competitor Market Share And Sales Revenues Ppt PowerPoint Presentation Inspiration Gallery
This is a competitor market share and sales revenues ppt powerpoint presentation inspiration gallery. This is a four stage process. The stages in this process are line chart, growth, marketing, strategy, business, analysis.
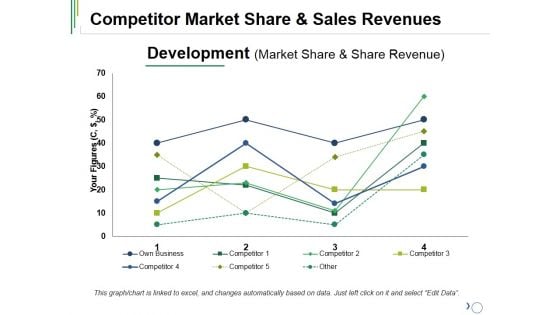
Competitor Market Share And Sales Revenues Ppt PowerPoint Presentation Pictures Information
This is a competitor market share and sales revenues ppt powerpoint presentation pictures information. This is a four stage process. The stages in this process are your figures, business, marketing, own business, competitor.
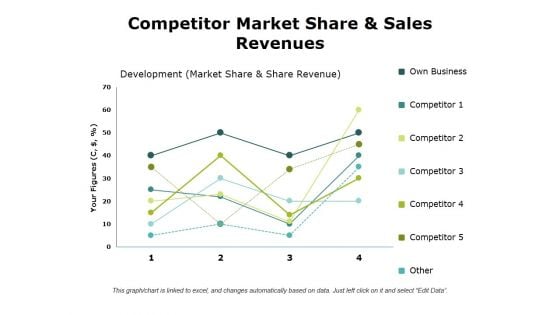
Competitor Market Share And Sales Revenues Ppt PowerPoint Presentation Outline Templates
This is a competitor market share and sales revenues ppt powerpoint presentation outline templates. This is a five stage process. The stages in this process are business, line chart, marketing, analysis, strategy.
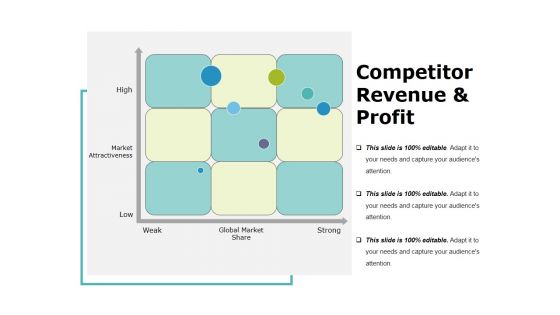
Competitor Revenue And Profit Template 2 Ppt PowerPoint Presentation Infographics Styles
This is a competitor revenue and profit template 2 ppt powerpoint presentation infographics styles. This is a three stage process. The stages in this process are high, market attractiveness, low, weak, global market share, strong.
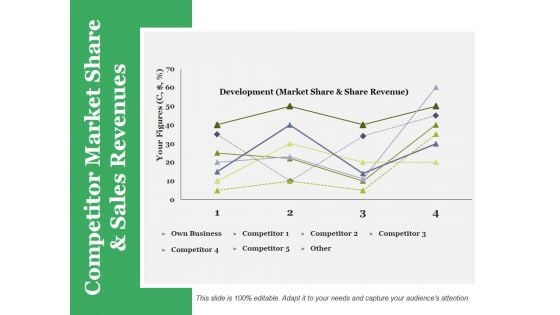
Competitor Market Share And Sales Revenues Ppt PowerPoint Presentation Styles Guide
This is a competitor market share and sales revenues ppt powerpoint presentation styles guide. This is a four stage process. The stages in this process are business, growth, analysis, strategy, success.
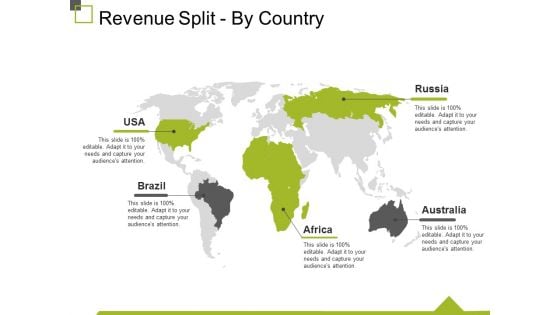
Revenue Split By Country Ppt PowerPoint Presentation Infographic Template Graphic Images
This is a revenue split by country ppt powerpoint presentation infographic template graphic images. This is a five stage process. The stages in this process are usa, brazil, africa, australia, russia.
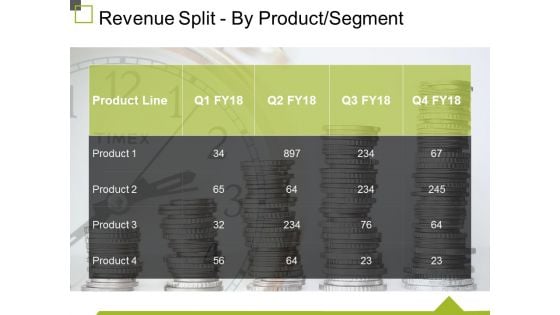
Revenue Split By Product Segment Template 1 Ppt PowerPoint Presentation Outline Layout
This is a revenue split by product segment template 1 ppt powerpoint presentation outline layout. This is a four stage process. The stages in this process are product line, business, marketing, tables, planning.
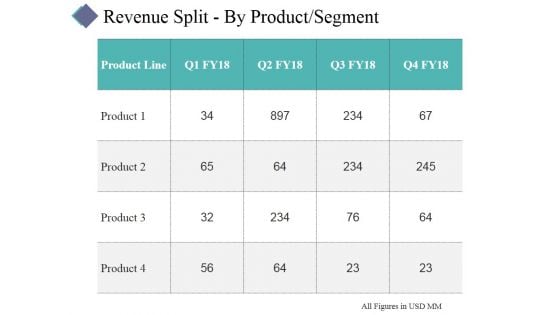
Revenue Split By Product Segment Template 1 Ppt PowerPoint Presentation Infographic Template Summary
This is a revenue split by product segment template 1 ppt powerpoint presentation infographic template summary. This is a four stage process. The stages in this process are business, table, management, analysis, success.
Revenue Split By Product Segment Template Ppt PowerPoint Presentation Icon Graphics Download
This is a revenue split by product segment template ppt powerpoint presentation icon graphics download. This is a four stage process. The stages in this process are table, business, marketing, data, management.
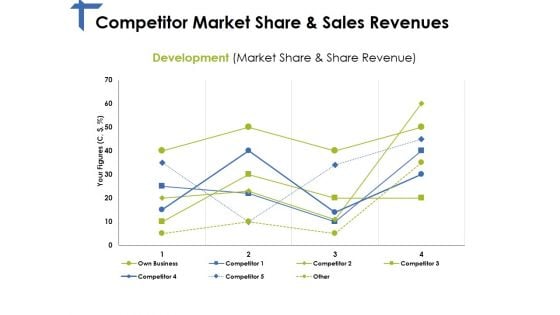
Competitor Market Share And Sales Revenues Ppt PowerPoint Presentation Summary Graphics Tutorials
This is a competitor market share and sales revenues ppt powerpoint presentation summary graphics tutorials. This is a four stage process. The stages in this process are own business, development, competitor, your figures.

Competitor Market Share And Sales Revenues Ppt PowerPoint Presentation Model Graphic Images
This is a competitor market share and sales revenues ppt powerpoint presentation model graphic images. This is a five stage process. The stages in this process are competitor, own business, growth, success.
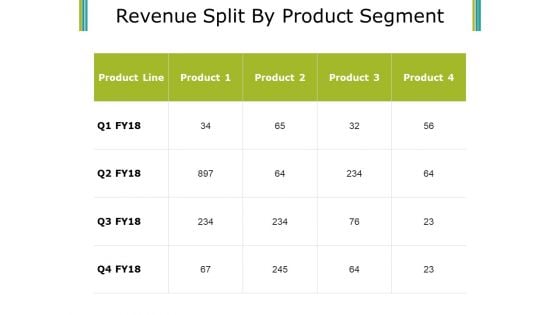
Revenue Split By Product Segment Template 2 Ppt PowerPoint Presentation Professional Show
This is a revenue split by product segment template 2 ppt powerpoint presentation professional show. This is a four stage process. The stages in this process are product, product line, table, business, marketing.
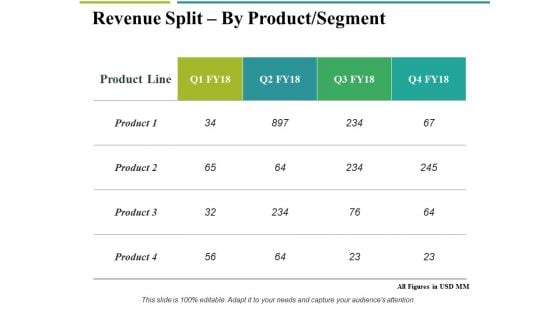
Revenue Split By Product Segment Template 1 Ppt PowerPoint Presentation Professional Files
This is a revenue split by product segment template 1 ppt powerpoint presentation professional files. This is a four stage process. The stages in this process are product line, business, marketing, table, planning.
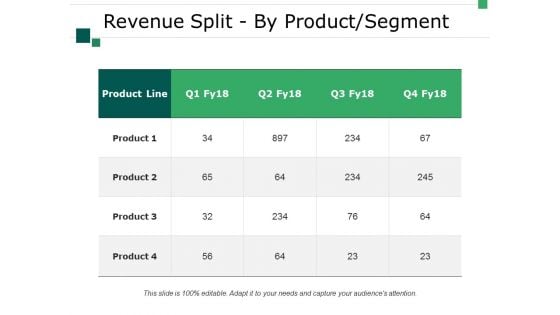
Revenue Split By Product Segment Template 1 Ppt PowerPoint Presentation Model Slide Portrait
This is a revenue split by product segment template 1 ppt powerpoint presentation model slide portrait. This is a four stage process. The stages in this process are product line, business, marketing, planning, table.
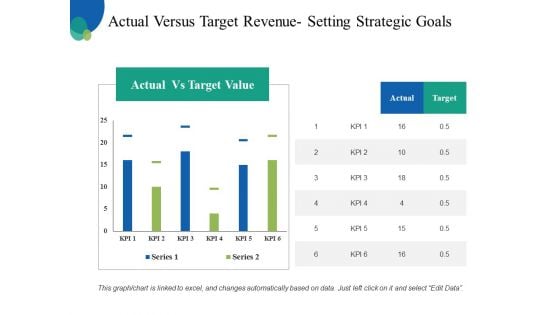
Actual Versus Target Revenue Setting Strategic Goals Ppt PowerPoint Presentation Ideas Elements
This is a actual versus target revenue setting strategic goals ppt powerpoint presentation ideas elements. This is a two stage process. The stages in this process are actual vs target value, actual, target, business, planning.
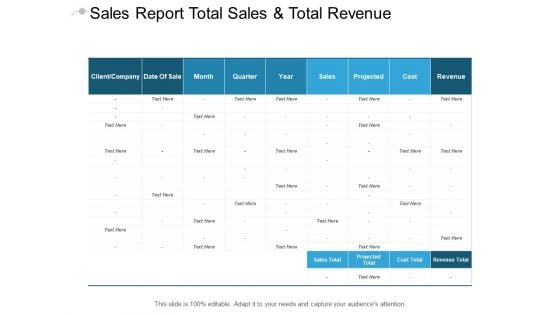
Sales Report Total Sales And Total Revenue Ppt PowerPoint Presentation Pictures Templates
This is a Sales Report Total Sales And Total Revenue Ppt Powerpoint Presentation Pictures Templates. This is a one stage process. The stages in this process are sales plan, sales prospecting, sales reps.
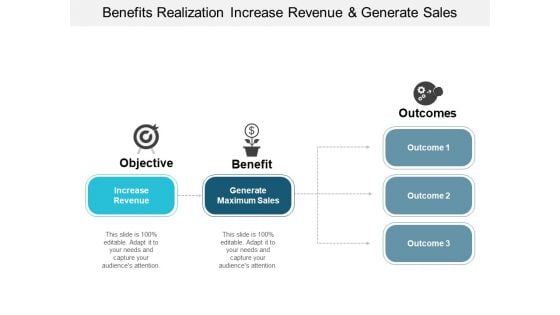
Benefits Realization Increase Revenue And Generate Sales Ppt PowerPoint Presentation Show Objects
This is a benefits realization increase revenue and generate sales ppt powerpoint presentation show objects. This is a three stage process. The stages in this process are objective and benefit, goal and benefit, plan and benefit.
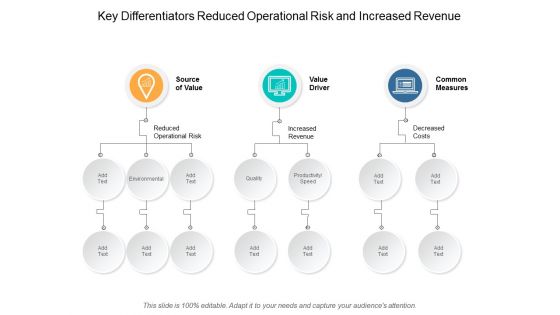
Key Differentiators Reduced Operational Risk And Increased Revenue Ppt Powerpoint Presentation Model Outline
This is a key differentiators reduced operational risk and increased revenue ppt powerpoint presentation model outline. This is a three stage process. The stages in this process are value drivers, utility drivers, worth drivers.
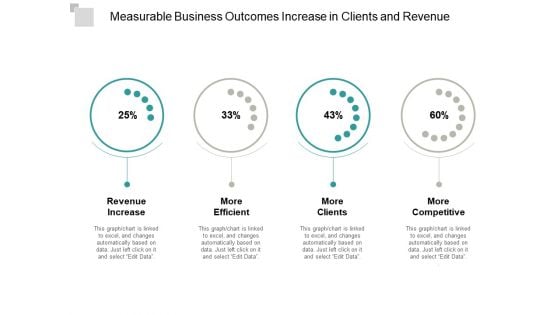
Measurable Business Outcomes Increase In Clients And Revenue Ppt Powerpoint Presentation Portfolio Ideas
This is a measurable business outcomes increase in clients and revenue ppt powerpoint presentation portfolio ideas. This is a four stage process. The stages in this process are business outcomes, business results, business output.
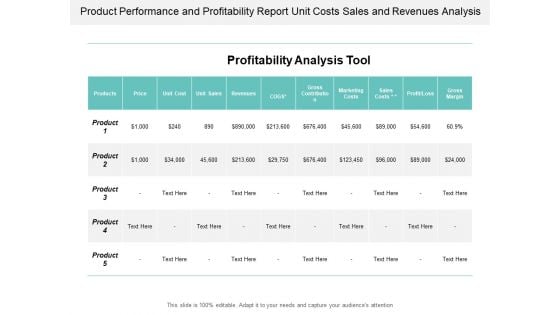
Product Performance And Profitability Report Unit Costs Sales And Revenues Analysis Ppt PowerPoint Presentation Model Show
This is a product performance and profitability report unit costs sales and revenues analysis ppt powerpoint presentation model show. This is a five stage process. The stages in this process are business unit profitability, profitable organization, corporate unit profitability.
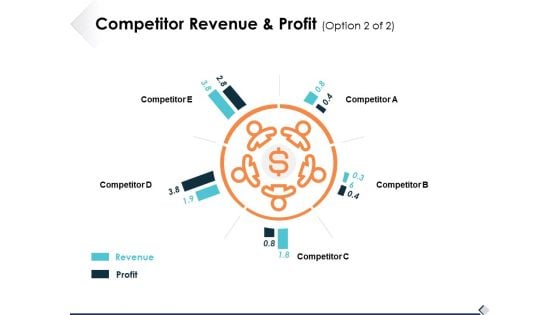
Competitor Revenue And Profit Option 2 Of 2 Ppt PowerPoint Presentation Show Design Templates
This is a competitor revenue and profit option 2 of 2 ppt powerpoint presentation show design templates. This is a five stage process. The stages in this process are business, management, strategy, analysis, marketing.
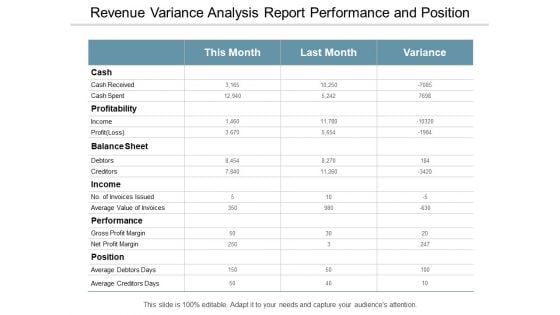
Revenue Variance Analysis Report Performance And Position Ppt PowerPoint Presentation Sample
This is a revenue variance analysis report performance and position ppt powerpoint presentation sample. This is a three stage process. The stages in this process are accounting review, accounting report, accounting statement.
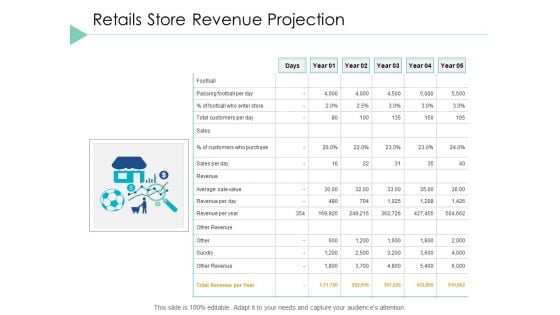
Retails Store Revenue Projection Business Ppt PowerPoint Presentation File Graphics Download
This is a retails store revenue projection business ppt powerpoint presentation file graphics download. This is a four stage process. The stages in this process are comparison, planning, marketing, finance, strategy.
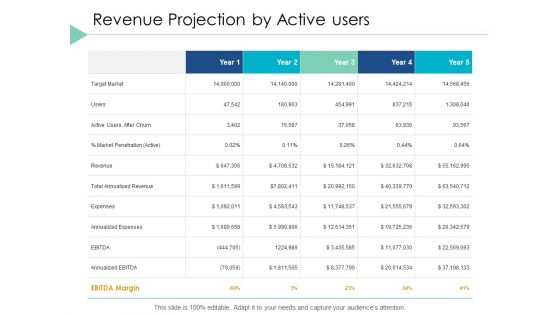
Revenue Projection By Active Users Strategy Ppt PowerPoint Presentation Infographic Template Outline
This is a revenue projection by active users strategy ppt powerpoint presentation infographic template outline. This is a three stage process. The stages in this process are comparison, planning, marketing, finance, strategy.
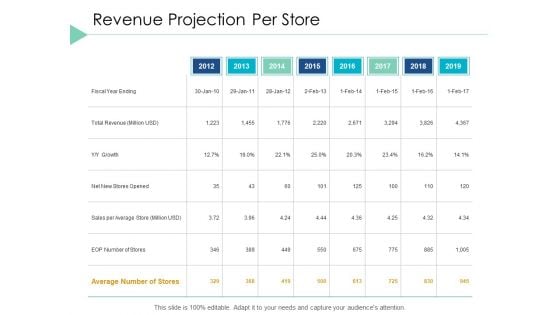
Revenue Projection Per Store Planning Ppt PowerPoint Presentation Slides Background Designs
This is a revenue projection per store planning ppt powerpoint presentation slides background designs. This is a four stage process. The stages in this process are comparison, planning, marketing, finance, strategy.
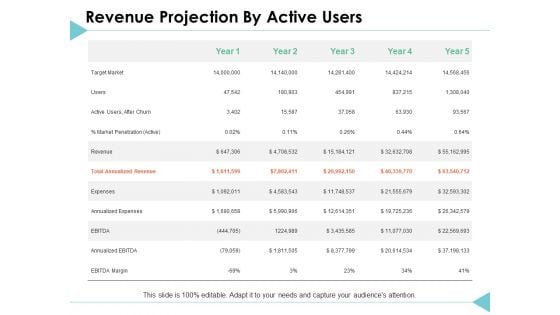
Revenue Projection By Active Users Strategy Ppt PowerPoint Presentation Infographic Template Slideshow
This is a revenue projection by active users strategy ppt powerpoint presentation infographic template slideshow. This is a three stage process. The stages in this process are comparison, planning, marketing, finance, strategy.
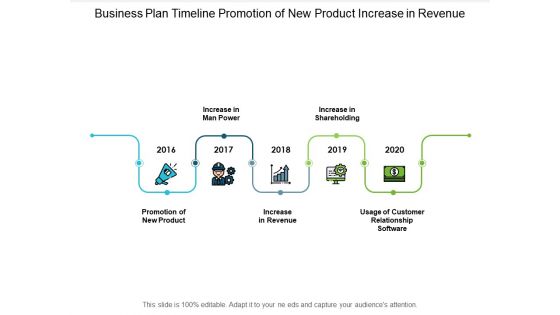
Business Plan Timeline Promotion Of New Product Increase In Revenue Ppt Powerpoint Presentation Styles Influencers
This is a business plan timeline promotion of new product increase in revenue ppt powerpoint presentation styles influencers. This is a five stage process. The stages in this process are block timeline, block roadmap, block linear process.
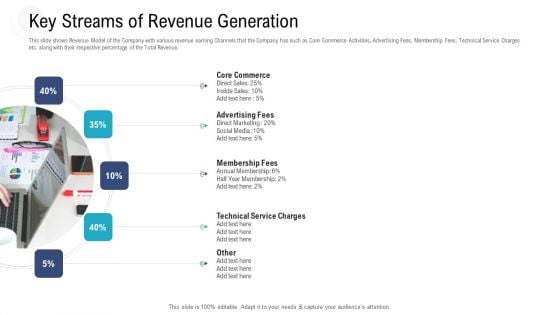
Investor Pitch Deck To Procure Federal Debt From Banks Key Streams Of Revenue Generation Sample PDF
This slide shows Revenue Model of the Company with various revenue earning Channels that the Company has such as Core Commerce Activities, Advertising Fees, Membership Fees, Technical Service Charges etc. along with their respective percentage of the Total Revenue. Presenting investor pitch deck to procure federal debt from banks key streams of revenue generation sample pdf to provide visual cues and insights. Share and navigate important information on one stage that need your due attention. This template can be used to pitch topics like core commerce, advertising fees, direct marketing, social media, technical service charges. In addtion, this PPT design contains high resolution images, graphics, etc, that are easily editable and available for immediate download.
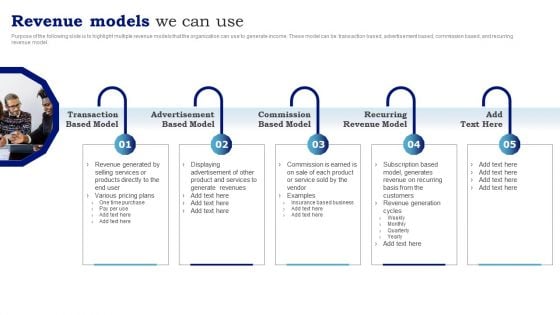
Blueprint To Enhance Organizational Operations Revenue Models We Can Use Demonstration PDF
Purpose of the following slide is to highlight multiple revenue models that the organization can use to generate income. These model can be transaction based, advertisement based, commission based, and recurring revenue model. Do you have an important presentation coming up Are you looking for something that will make your presentation stand out from the rest Look no further than Blueprint To Enhance Organizational Operations Revenue Models We Can Use Demonstration PDF. With our professional designs, you can trust that your presentation will pop and make delivering it a smooth process. And with Slidegeeks, you can trust that your presentation will be unique and memorable. So why wait Grab Blueprint To Enhance Organizational Operations Revenue Models We Can Use Demonstration PDF today and make your presentation stand out from the rest.
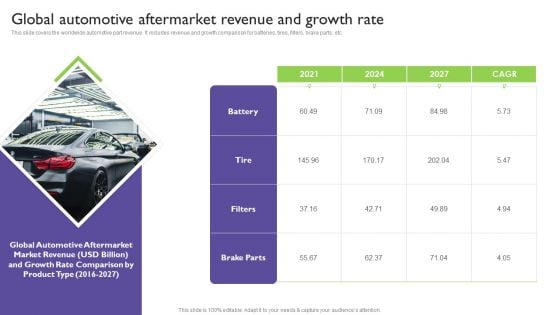
Global Automotive Industry Analysis Global Automotive Aftermarket Revenue And Growth Rate Clipart PDF
This slide covers the worldwide automotive part revenue. It includes revenue and growth comparison for batteries, tires, filters, brake parts, etc. Do you have to make sure that everyone on your team knows about any specific topic I yes, then you should give Global Automotive Industry Analysis Global Automotive Aftermarket Revenue And Growth Rate Clipart PDF a try. Our experts have put a lot of knowledge and effort into creating this impeccable Global Automotive Industry Analysis Global Automotive Aftermarket Revenue And Growth Rate Clipart PDF. You can use this template for your upcoming presentations, as the slides are perfect to represent even the tiniest detail. You can download these templates from the Slidegeeks website and these are easy to edit. So grab these today.
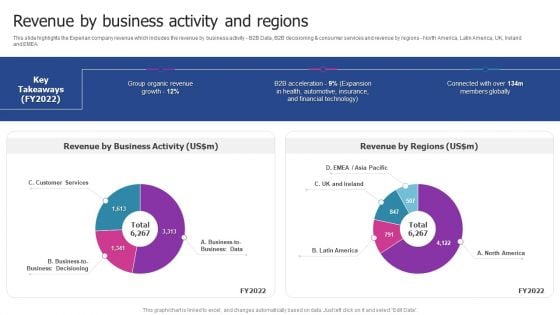
Experian Company Outline Revenue By Business Activity And Regions Mockup PDF
This slide highlights the Experian company revenue which includes the revenue by business activity B2B Data, B2B decisioning and consumer services and revenue by regions North America, Latin America, UK, Ireland and EMEA. This Experian Company Outline Revenue By Business Activity And Regions Mockup PDF from Slidegeeks makes it easy to present information on your topic with precision. It provides customization options, so you can make changes to the colors, design, graphics, or any other component to create a unique layout. It is also available for immediate download, so you can begin using it right away. Slidegeeks has done good research to ensure that you have everything you need to make your presentation stand out. Make a name out there for a brilliant performance.
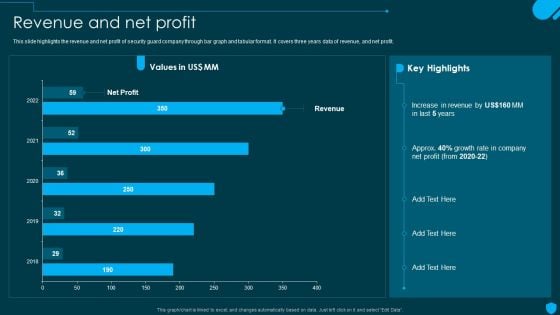
Security And Human Resource Services Business Profile Revenue And Net Profit Designs PDF
This slide highlights the revenue and net profit of security guard company through bar graph and tabular format. It covers three years data of revenue, and net profit. Explore a selection of the finest Security And Human Resource Services Business Profile Revenue And Net Profit Designs PDF here. With a plethora of professionally designed and pre-made slide templates, you can quickly and easily find the right one for your upcoming presentation. You can use our Security And Human Resource Services Business Profile Revenue And Net Profit Designs PDF to effectively convey your message to a wider audience. Slidegeeks has done a lot of research before preparing these presentation templates. The content can be personalized and the slides are highly editable. Grab templates today from Slidegeeks.
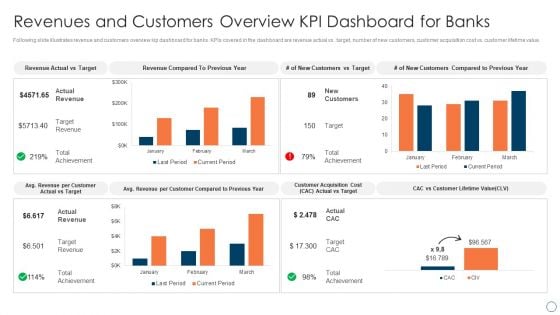
BPM Tools Application To Increase Revenues And Customers Overview KPI Dashboard For Banks Clipart PDF
Following slide illustrates revenue and customers overview kip dashboard for banks. KPIs covered in the dashboard are revenue actual vs. target, number of new customers, customer acquisition cost vs. customer lifetime value. Get a simple yet stunning designed BPM Tools Application To Increase Revenues And Customers Overview KPI Dashboard For Banks Clipart PDF. It is the best one to establish the tone in your meetings. It is an excellent way to make your presentations highly effective. So, download this PPT today from Slidegeeks and see the positive impacts. Our easy-to-edit BPM Tools Application To Increase Revenues And Customers Overview KPI Dashboard For Banks Clipart PDF can be your go-to option for all upcoming conferences and meetings. So, what are you waiting for Grab this template today.
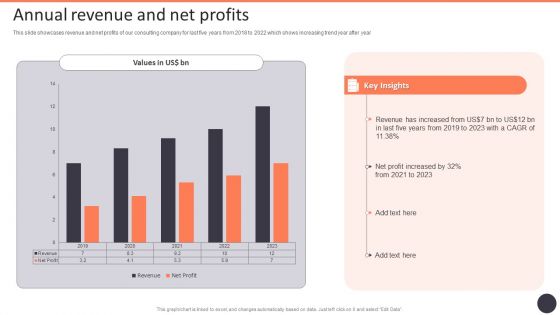
Business Strategy Consulting Solutions Company Outline Annual Revenue And Net Profits Clipart PDF
This slide showcases revenue and net profits of our consulting company for last five years from 2018 to 2022 which shows increasing trend year after year. Presenting this PowerPoint presentation, titled Business Strategy Consulting Solutions Company Outline Annual Revenue And Net Profits Clipart PDF with topics curated by our researchers after extensive research. This editable presentation is available for immediate download and provides attractive features when used. Download now and captivate your audience. Presenting this Business Strategy Consulting Solutions Company Outline Annual Revenue And Net Profits Clipart PDF. Our researchers have carefully researched and created these slides with all aspects taken into consideration. This is a completely customizable Business Strategy Consulting Solutions Company Outline Annual Revenue And Net Profits Clipart PDF that is available for immediate downloading. Download now and make an impact on your audience. Highlight the attractive features available with our PPTs.
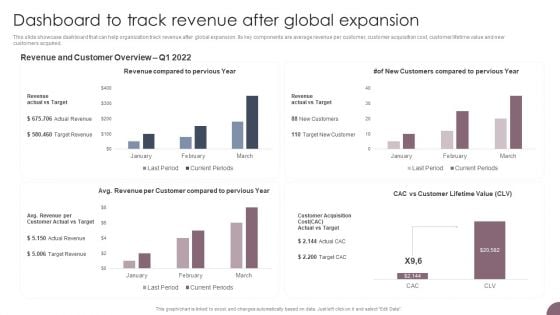
International Business Extension Dashboard To Track Revenue After Global Expansion Introduction PDF
This slide showcase dashboard that can help organization track revenue after global expansion. Its key components are average revenue per customer, customer acquisition cost, customer lifetime value and new customers acquired. Crafting an eye-catching presentation has never been more straightforward. Let your presentation shine with this tasteful yet straightforward International Business Extension Dashboard To Track Revenue After Global Expansion Introduction PDF template. It offers a minimalistic and classy look that is great for making a statement. The colors have been employed intelligently to add a bit of playfulness while still remaining professional. Construct the ideal International Business Extension Dashboard To Track Revenue After Global Expansion Introduction PDF that effortlessly grabs the attention of your audience Begin now and be certain to wow your customers.
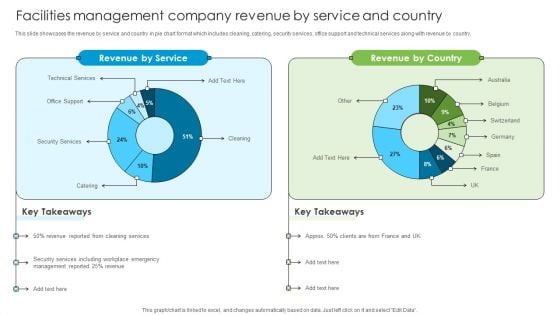
Facilities Management Company Revenue By Service And Country Developing Tactical Fm Services Brochure PDF
This slide showcases the revenue by service and country in pie chart format which includes cleaning, catering, security services, office support and technical services along with revenue by country.Get a simple yet stunning designed Facilities Management Company Revenue By Service And Country Developing Tactical Fm Services Brochure PDF. It is the best one to establish the tone in your meetings. It is an excellent way to make your presentations highly effective. So, download this PPT today from Slidegeeks and see the positive impacts. Our easy-to-edit Facilities Management Company Revenue By Service And Country Developing Tactical Fm Services Brochure PDF can be your go-to option for all upcoming conferences and meetings. So, what are you waiting for Grab this template today.
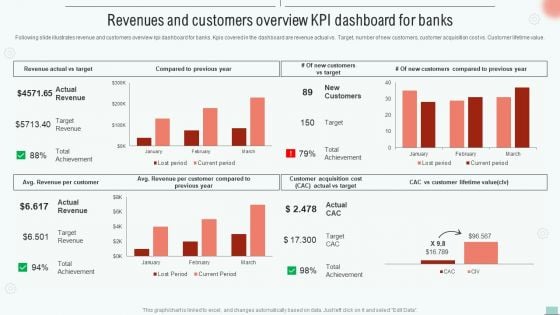
Implementing BPM Tool To Enhance Operational Efficiency Revenues And Customers Overview Kpi Dashboard Rules PDF
Following slide illustrates revenue and customers overview kpi dashboard for banks. Kpis covered in the dashboard are revenue actual vs. Target, number of new customers, customer acquisition cost vs. Customer lifetime value.This Implementing BPM Tool To Enhance Operational Efficiency Revenues And Customers Overview Kpi Dashboard Rules PDF is perfect for any presentation, be it in front of clients or colleagues. It is a versatile and stylish solution for organizing your meetings. The Implementing BPM Tool To Enhance Operational Efficiency Revenues And Customers Overview Kpi Dashboard Rules PDF features a modern design for your presentation meetings. The adjustable and customizable slides provide unlimited possibilities for acing up your presentation. Slidegeeks has done all the homework before launching the product for you. So, do not wait, grab the presentation templates today.
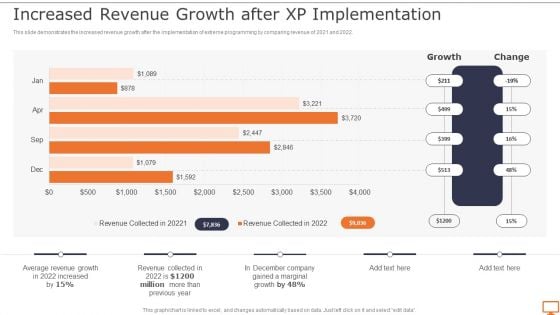
Deploying XP Practices To Enhance Operational Efficiency Increased Revenue Growth After Portrait PDF
This slide demonstrates the increased revenue growth after the implementation of extreme programming by comparing revenue of 2021 and 2022. Here you can discover an assortment of the finest PowerPoint and Google Slides templates. With these templates, you can create presentations for a variety of purposes while simultaneously providing your audience with an eye-catching visual experience. Download Deploying XP Practices To Enhance Operational Efficiency Increased Revenue Growth After Portrait PDF to deliver an impeccable presentation. These templates will make your job of preparing presentations much quicker, yet still, maintain a high level of quality. Slidegeeks has experienced researchers who prepare these templates and write high-quality content for you. Later on, you can personalize the content by editing the Deploying XP Practices To Enhance Operational Efficiency Increased Revenue Growth After Portrait PDF.
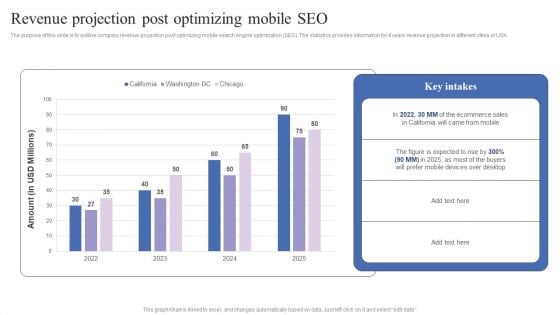
Revenue Projection Post Optimizing Mobile Seo Mobile Search Engine Optimization Guide Mockup PDF
The purpose of this slide is to outline company revenue projection post optimizing mobile search engine optimization SEO. The statistics provides information for 4 years revenue projection in different cities of USA. This Revenue Projection Post Optimizing Mobile Seo Mobile Search Engine Optimization Guide Mockup PDF is perfect for any presentation, be it in front of clients or colleagues. It is a versatile and stylish solution for organizing your meetings. The Revenue Projection Post Optimizing Mobile Seo Mobile Search Engine Optimization Guide Mockup PDF features a modern design for your presentation meetings. The adjustable and customizable slides provide unlimited possibilities for acing up your presentation. Slidegeeks has done all the homework before launching the product for you. So, do not wait, grab the presentation templates today.
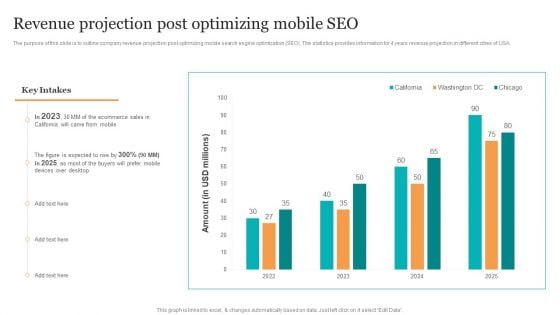
Revenue Projection Post Optimizing Mobile Seo Search Engine Optimization Services To Minimize Clipart PDF
The purpose of this slide is to outline company revenue projection post optimizing mobile search engine optimization SEO. The statistics provides information for 4 years revenue projection in different cities of USA. Formulating a presentation can take up a lot of effort and time, so the content and message should always be the primary focus. The visuals of the PowerPoint can enhance the presenters message, so our Revenue Projection Post Optimizing Mobile Seo Search Engine Optimization Services To Minimize Clipart PDF was created to help save time. Instead of worrying about the design, the presenter can concentrate on the message while our designers work on creating the ideal templates for whatever situation is needed. Slidegeeks has experts for everything from amazing designs to valuable content, we have put everything into Revenue Projection Post Optimizing Mobile Seo Search Engine Optimization Services To Minimize Clipart PDF.
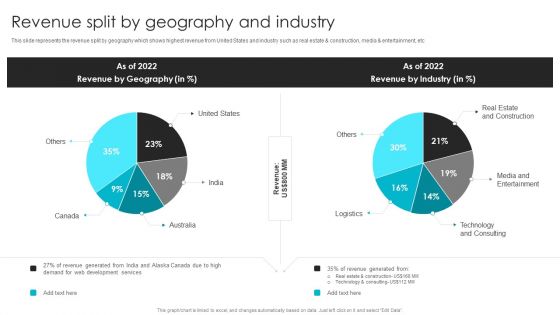
Web Design Company Overview Revenue Split By Geography And Industry Infographics PDF
This slide represents the revenue split by geography which shows highest revenue from United States and industry such as real estate and construction, media and entertainment, etc. Get a simple yet stunning designed Web Design Company Overview Revenue Split By Geography And Industry Infographics PDF. It is the best one to establish the tone in your meetings. It is an excellent way to make your presentations highly effective. So, download this PPT today from Slidegeeks and see the positive impacts. Our easy to edit Web Design Company Overview Revenue Split By Geography And Industry Infographics PDF can be your go to option for all upcoming conferences and meetings. So, what are you waiting for Grab this template today.
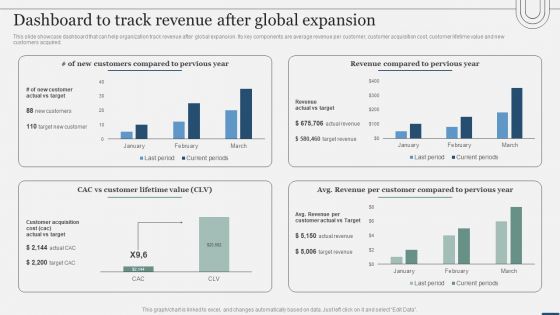
Assessing International Market Dashboard To Track Revenue After Global Expansion Template PDF
This slide showcase dashboard that can help organization track revenue after global expansion. Its key components are average revenue per customer, customer acquisition cost, customer lifetime value and new customers acquired. Crafting an eye-catching presentation has never been more straightforward. Let your presentation shine with this tasteful yet straightforward Assessing International Market Dashboard To Track Revenue After Global Expansion Template PDF template. It offers a minimalistic and classy look that is great for making a statement. The colors have been employed intelligently to add a bit of playfulness while still remaining professional. Construct the ideal Assessing International Market Dashboard To Track Revenue After Global Expansion Template PDF that effortlessly grabs the attention of your audience Begin now and be certain to wow your customers.
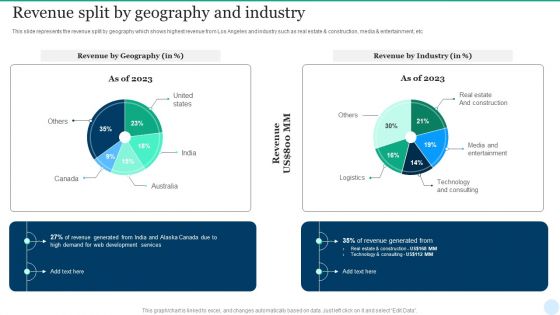
Web Interface Development Services Company Summary Revenue Split By Geography And Industry Brochure PDF
This slide represents the revenue split by geography which shows highest revenue from Los Angeles and industry such as real estate and construction, media and entertainment, etc. Are you searching for a Web Interface Development Services Company Summary Revenue Split By Geography And Industry Brochure PDF that is uncluttered, straightforward, and original Its easy to edit, and you can change the colors to suit your personal or business branding. For a presentation that expresses how much effort youve put in, this template is ideal With all of its features, including tables, diagrams, statistics, and lists, its perfect for a business plan presentation. Make your ideas more appealing with these professional slides. Download Web Interface Development Services Company Summary Revenue Split By Geography And Industry Brochure PDF from Slidegeeks today.
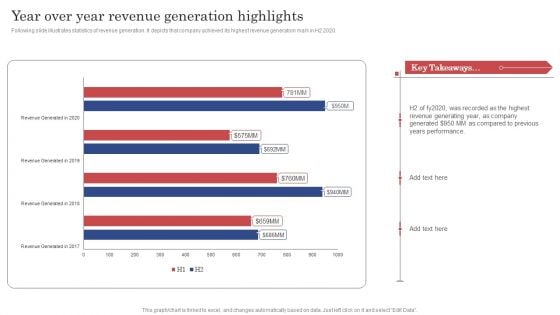
Construction Project Cost Benefit Analysis Report Year Over Year Revenue Generation Highlights Infographics PDF
Following slide illustrates statistics of revenue generation. It depicts that company achieved its highest revenue generation mark in H2 2020. Here you can discover an assortment of the finest PowerPoint and Google Slides templates. With these templates, you can create presentations for a variety of purposes while simultaneously providing your audience with an eye catching visual experience. Download Construction Project Cost Benefit Analysis Report Year Over Year Revenue Generation Highlights Infographics PDF to deliver an impeccable presentation. These templates will make your job of preparing presentations much quicker, yet still, maintain a high level of quality. Slidegeeks has experienced researchers who prepare these templates and write high quality content for you. Later on, you can personalize the content by editing the Construction Project Cost Benefit Analysis Report Year Over Year Revenue Generation Highlights Infographics PDF.
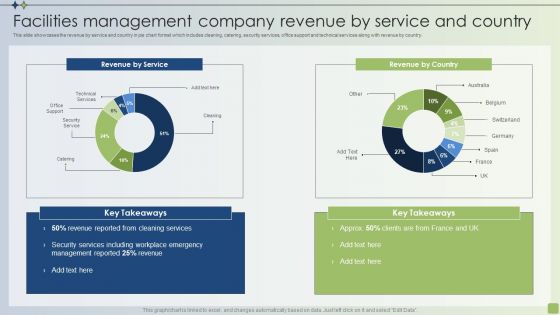
Strategic FM Services Facilities Management Company Revenue By Service And Country Topics PDF
This slide showcases the revenue by service and country in pie chart format which includes cleaning, catering, security services, office support and technical services along with revenue by country. Crafting an eye catching presentation has never been more straightforward. Let your presentation shine with this tasteful yet straightforward Strategic FM Services Facilities Management Company Revenue By Service And Country Topics PDF template. It offers a minimalistic and classy look that is great for making a statement. The colors have been employed intelligently to add a bit of playfulness while still remaining professional. Construct the ideal Strategic FM Services Facilities Management Company Revenue By Service And Country Topics PDF that effortlessly grabs the attention of your audience Begin now and be certain to wow your customers.
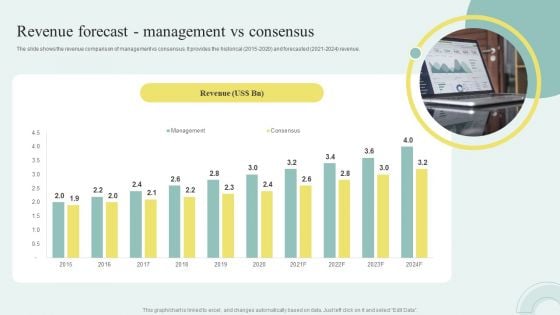
Sell Side M And A Pitchbook With Deal Overview Revenue Forecast Management Vs Consensus Template PDF
The slide shows the revenue comparison of management vs consensus. It provides the historical 2015 2020 and forecasted 2021 2024 revenue. Are you searching for a Sell Side M And A Pitchbook With Deal Overview Revenue Forecast Management Vs Consensus Template PDF that is uncluttered, straightforward, and original Its easy to edit, and you can change the colors to suit your personal or business branding. For a presentation that expresses how much effort you have put in, this template is ideal With all of its features, including tables, diagrams, statistics, and lists, its perfect for a business plan presentation. Make your ideas more appealing with these professional slides. Download Sell Side M And A Pitchbook With Deal Overview Revenue Forecast Management Vs Consensus Template PDF from Slidegeeks today.
Global Automotive Aftermarket Revenue Global Automotive Manufacturing Market Analysis Icons PDF
This slide covers the worldwide automotive part revenue. It includes revenue and growth comparison for batteries, tires, filters, brake parts, etc. Here you can discover an assortment of the finest PowerPoint and Google Slides templates. With these templates, you can create presentations for a variety of purposes while simultaneously providing your audience with an eye-catching visual experience. Download Global Automotive Aftermarket Revenue Global Automotive Manufacturing Market Analysis Icons PDF to deliver an impeccable presentation. These templates will make your job of preparing presentations much quicker, yet still, maintain a high level of quality. Slidegeeks has experienced researchers who prepare these templates and write high-quality content for you. Later on, you can personalize the content by editing the Global Automotive Aftermarket Revenue Global Automotive Manufacturing Market Analysis Icons PDF.
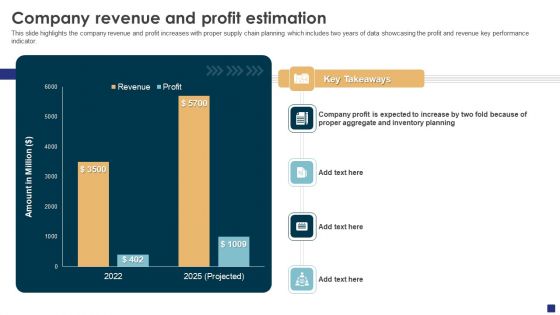
Comprehensive Guide To Ecommerce Company Revenue And Profit Estimation Topics PDF
This slide highlights the company revenue and profit increases with proper supply chain planning which includes two years of data showcasing the profit and revenue key performance indicator. Get a simple yet stunning designed Comprehensive Guide To Ecommerce Company Revenue And Profit Estimation Topics PDF. It is the best one to establish the tone in your meetings. It is an excellent way to make your presentations highly effective. So, download this PPT today from Slidegeeks and see the positive impacts. Our easy-to-edit Comprehensive Guide To Ecommerce Company Revenue And Profit Estimation Topics PDF can be your go-to option for all upcoming conferences and meetings. So, what are you waiting for Grab this template today.
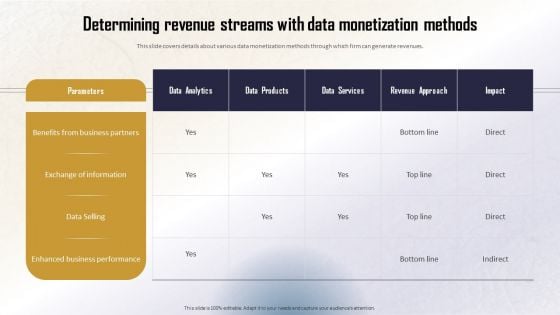
Identifying Direct And Indirect Determining Revenue Streams With Data Monetization Clipart PDF
This slide covers details about various data monetization methods through which firm can generate revenues. Presenting this PowerPoint presentation, titled Identifying Direct And Indirect Determining Revenue Streams With Data Monetization Clipart PDF, with topics curated by our researchers after extensive research. This editable presentation is available for immediate download and provides attractive features when used. Download now and captivate your audience. Presenting this Identifying Direct And Indirect Determining Revenue Streams With Data Monetization Clipart PDF. Our researchers have carefully researched and created these slides with all aspects taken into consideration. This is a completely customizable Identifying Direct And Indirect Determining Revenue Streams With Data Monetization Clipart PDF that is available for immediate downloading. Download now and make an impact on your audience. Highlight the attractive features available with our PPTs.
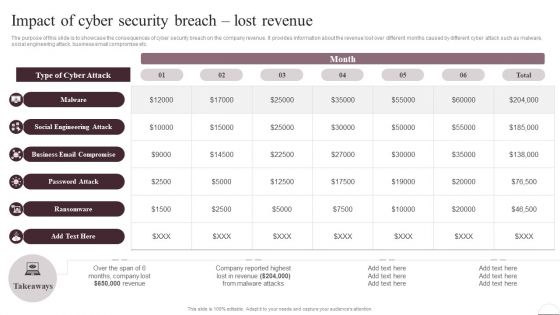
Prevention Of Information Impact Of Cyber Security Breach Lost Revenue Slides PDF
The purpose of this slide is to showcase the consequences of cyber security breach on the company revenue. It provides information about the revenue lost over different months caused by different cyber attack such as malware, social engineering attack, business email compromise etc. Crafting an eye-catching presentation has never been more straightforward. Let your presentation shine with this tasteful yet straightforward Prevention Of Information Impact Of Cyber Security Breach Lost Revenue Slides PDF template. It offers a minimalistic and classy look that is great for making a statement. The colors have been employed intelligently to add a bit of playfulness while still remaining professional. Construct the ideal Prevention Of Information Impact Of Cyber Security Breach Lost Revenue Slides PDF that effortlessly grabs the attention of your audience Begin now and be certain to wow your customers
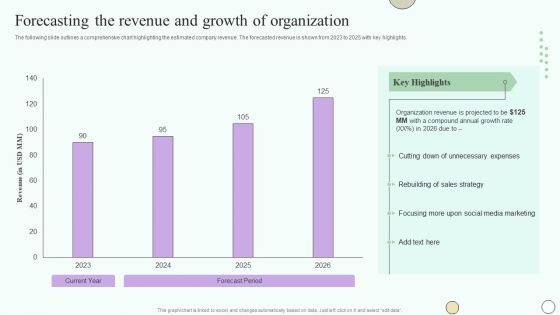
Estimating Business Overall Forecasting The Revenue And Growth Of Organization Topics PDF
The following slide outlines a comprehensive chart highlighting the estimated company revenue. The forecasted revenue is shown from 2023 to 2025 with key highlights. Whether you have daily or monthly meetings, a brilliant presentation is necessary. Estimating Business Overall Forecasting The Revenue And Growth Of Organization Topics PDFcan be your best option for delivering a presentation. Represent everything in detail using Estimating Business Overall Forecasting The Revenue And Growth Of Organization Topics PDF and make yourself stand out in meetings. The template is versatile and follows a structure that will cater to your requirements. All the templates prepared by Slidegeeks are easy to download and edit. Our research experts have taken care of the corporate themes as well. So, give it a try and see the results.
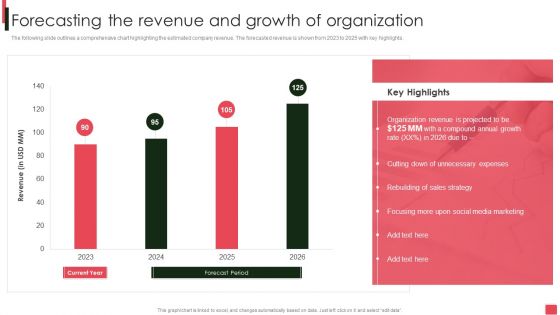
Overview Of Organizational Forecasting The Revenue And Growth Of Organization Template PDF
The following slide outlines a comprehensive chart highlighting the estimated company revenue. The forecasted revenue is shown from 2023 to 2025 with key highlights. Whether you have daily or monthly meetings, a brilliant presentation is necessary. Overview Of Organizational Forecasting The Revenue And Growth Of Organization Template PDF can be your best option for delivering a presentation. Represent everything in detail using Overview Of Organizational Forecasting The Revenue And Growth Of Organization Template PDF and make yourself stand out in meetings. The template is versatile and follows a structure that will cater to your requirements. All the templates prepared by Slidegeeks are easy to download and edit. Our research experts have taken care of the corporate themes as well. So, give it a try and see the results.
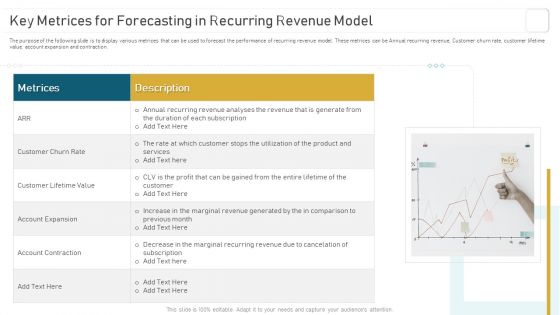
Deploying And Managing Recurring Key Metrices For Forecasting In Recurring Revenue Professional PDF
The purpose of the following slide is to display various metrices that can be used to forecast the performance of recurring revenue model. These metrices can be Annual recurring revenue, Customer churn rate, customer lifetime value, account expansion and contraction. Whether you have daily or monthly meetings, a brilliant presentation is necessary. Deploying And Managing Recurring Key Metrices For Forecasting In Recurring Revenue Professional PDF can be your best option for delivering a presentation. Represent everything in detail using Deploying And Managing Recurring Key Metrices For Forecasting In Recurring Revenue Professional PDF and make yourself stand out in meetings. The template is versatile and follows a structure that will cater to your requirements. All the templates prepared by Slidegeeks are easy to download and edit. Our research experts have taken care of the corporate themes as well. So, give it a try and see the results.
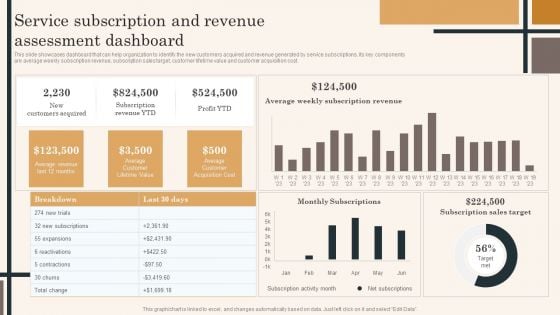
Edtech Service Launch And Promotion Plan Service Subscription And Revenue Assessment Dashboard Topics PDF
This slide showcases dashboard that can help organization to identify the new customers acquired and revenue generated by service subscriptions. Its key components are average weekly subscription revenue, subscription sales target, customer lifetime value and customer acquisition cost. Whether you have daily or monthly meetings, a brilliant presentation is necessary. Edtech Service Launch And Promotion Plan Service Subscription And Revenue Assessment Dashboard Topics PDF can be your best option for delivering a presentation. Represent everything in detail using Edtech Service Launch And Promotion Plan Service Subscription And Revenue Assessment Dashboard Topics PDF and make yourself stand out in meetings. The template is versatile and follows a structure that will cater to your requirements. All the templates prepared by Slidegeeks are easy to download and edit. Our research experts have taken care of the corporate themes as well. So, give it a try and see the results.


 Continue with Email

 Home
Home


