graph

Line Chart Ppt PowerPoint Presentation Gallery Example Introduction
This is a line chart ppt powerpoint presentation portfolio shapes. This is a two stage process. The stages in this process are product, financial years, line chart.
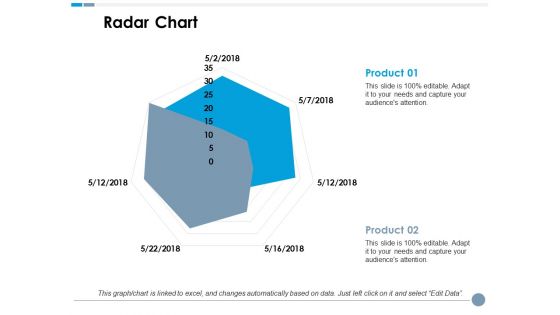
Radar Chart Ppt PowerPoint Presentation Summary Layouts
This is a radar chart ppt powerpoint presentation summary layouts. This is a two stage process. The stages in this process are business, radar chart, marketing, finance, strategy.
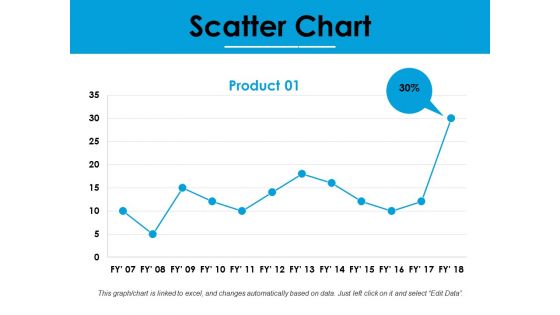
Scatter Chart Ppt PowerPoint Presentation Styles Information
This is a scatter chart ppt powerpoint presentation styles information. This is a one stage process. The stages in this process are business, marketing, finance, scatter chart, percentage.
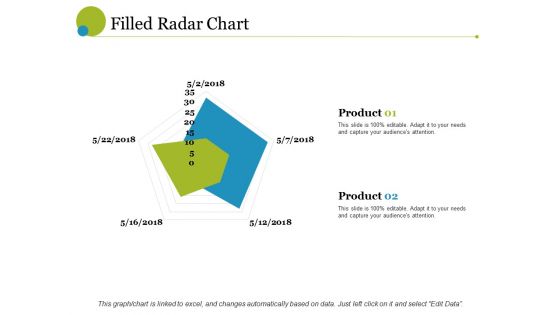
filled radar chart ppt powerpoint presentation ideas brochure
This is a filled radar chart ppt powerpoint presentation ideas brochure. This is a two stage process. The stages in this process are radar chart, finance, analysis, business, marketing, strategy.
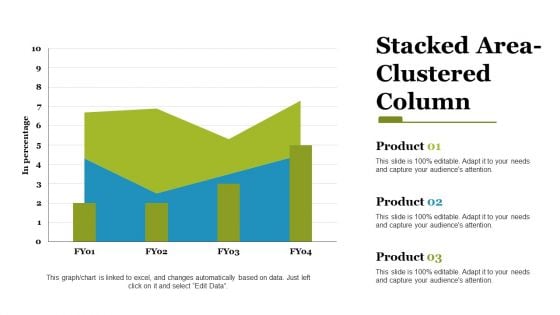
stacked area clustered column ppt powerpoint presentation styles files
This is a stacked area clustered column ppt powerpoint presentation styles files. This is a three stage process. The stages in this process are stacked area, clustered column, finance, marketing, strategy, business.
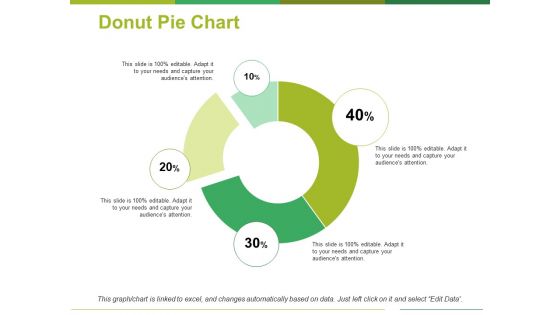
Donut Pie Chart Ppt PowerPoint Presentation Outline Structure
This is a donut pie chart ppt powerpoint presentation outline structure. This is a four stage process. The stages in this process are percentage, finance, donut, business, marketing.
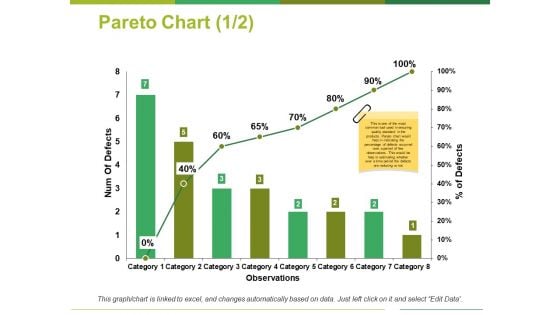
Pareto Chart Template 1 Ppt PowerPoint Presentation Outline Show
This is a pareto chart template 1 ppt powerpoint presentation outline show. This is a eight stage process. The stages in this process are num of defects, percentage of defects, observations, category.
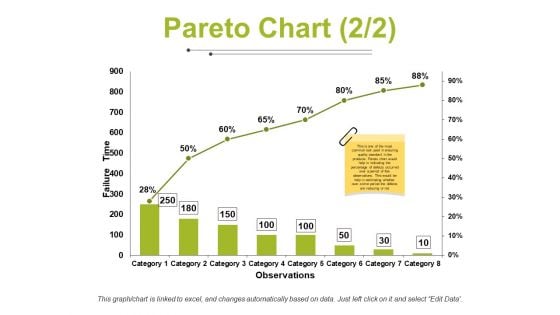
Pareto Chart Template 2 Ppt PowerPoint Presentation Gallery Microsoft
This is a pareto chart template 2 ppt powerpoint presentation gallery microsoft. This is a eight stage process. The stages in this process are failure time, observations, category.
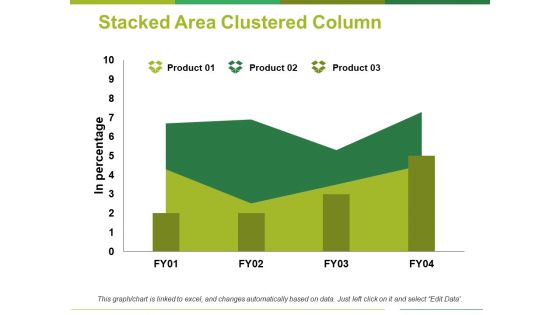
Stacked Area Clustered Column Ppt PowerPoint Presentation Professional Clipart
This is a stacked area clustered column ppt powerpoint presentation professional clipart. This is a three stage process. The stages in this process are product, in percentage, area chart.
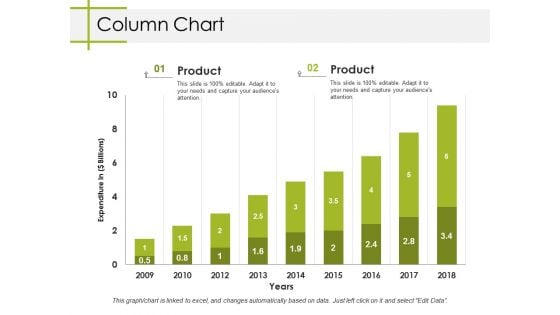
Column Chart Ppt PowerPoint Presentation Styles Clipart
This is a column chart ppt powerpoint presentation styles clipart. This is a two stage process. The stages in this process are column chart, finance, marketing, analysis, business.

Column Chart Ppt PowerPoint Presentation Show Brochure
This is a column chart ppt powerpoint presentation show brochure. This is a two stage process. The stages in this process are column chart, finance, marketing, strategy, business.
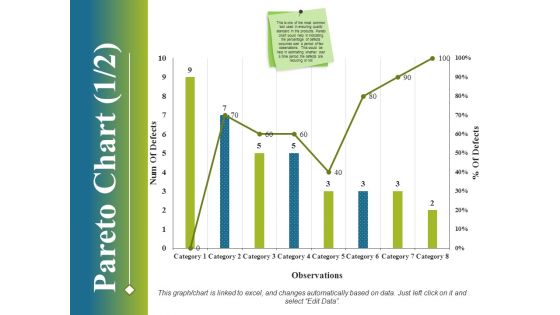
Pareto Chart Template 1 Ppt PowerPoint Presentation File Ideas
This is a pareto chart template 1 ppt powerpoint presentation file ideas. This is a eight stage process. The stages in this process are business, finance, marketing, strategy, analysis.
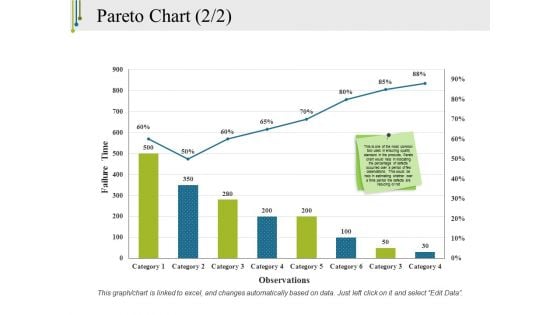
Pareto Chart Template 2 Ppt PowerPoint Presentation Outline Model
This is a pareto chart template 2 ppt powerpoint presentation outline model. This is a eight stage process. The stages in this process are pareto chart, finance, marketing, strategy, analysis.
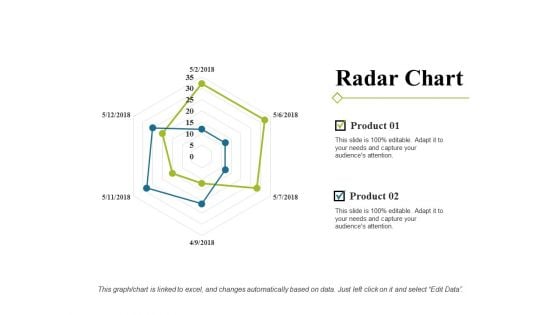
Radar Chart Ppt PowerPoint Presentation Portfolio Show
This is a radar chart ppt powerpoint presentation portfolio show. This is a two stage process. The stages in this process are radar chart, finance, marketing, strategy, analysis.
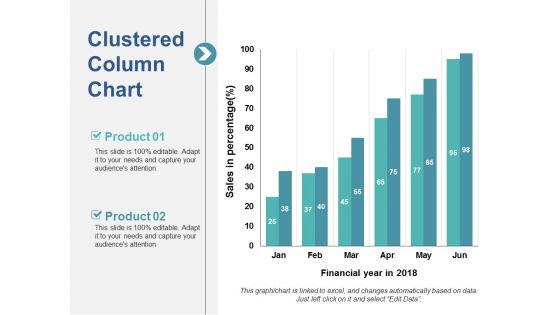
Clustered Column Chart Ppt PowerPoint Presentation Slides Smartart
This is a clustered column chart ppt powerpoint presentation slides smartart. This is a two stage process. The stages in this process are bar, marketing, strategy, planning, finance.
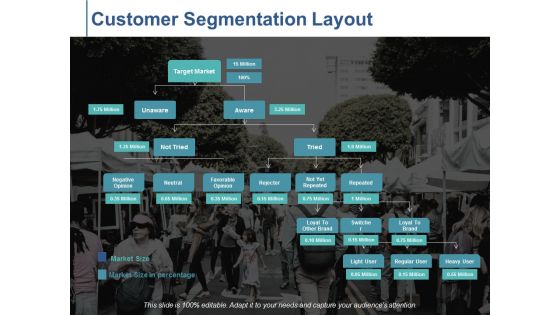
Customer Segmentation Layout Ppt PowerPoint Presentation Model Gallery
This is a customer segmentation layout ppt powerpoint presentation model gallery. This is a six stage process. The stages in this process are target market, unaware, negative opinion, neutral.
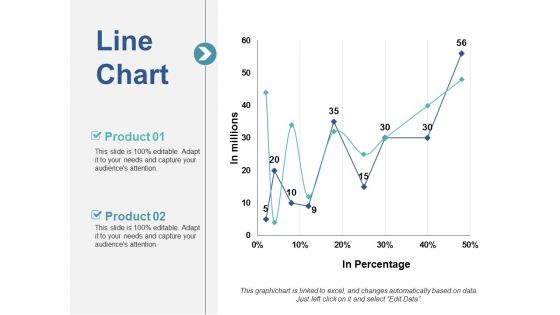
Line Chart Ppt PowerPoint Presentation Slides Clipart Images
This is a line chart ppt powerpoint presentation slides clipart images. This is a two stage process. The stages in this process are line chart, marketing, strategy, planning, finance.
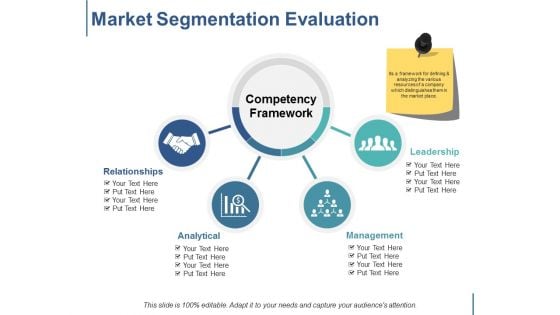
Market Segmentation Evaluation Ppt PowerPoint Presentation Ideas Elements
This is a market segmentation evaluation ppt powerpoint presentation ideas elements. This is a two stage process. The stages in this process are bar, marketing, strategy, planning, finance.
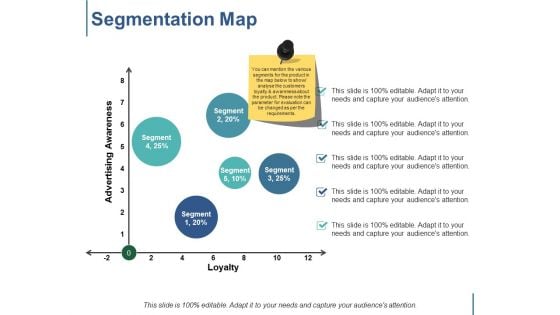
Segmentation Map Ppt PowerPoint Presentation Show Images
This is a segmentation map ppt powerpoint presentation show images. This is a five stage process. The stages in this process are segment, advertising awareness, loyalty.
Pie Chart Ppt PowerPoint Presentation Icon Outline
This is a pie chart ppt powerpoint presentation icon outline. This is a four stage process. The stages in this process are pie, process, percentage, product, business.
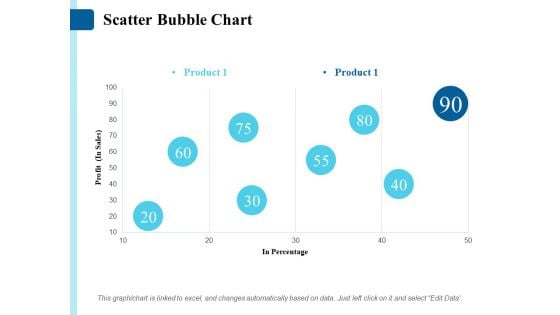
Scatter Bubble Chart Ppt PowerPoint Presentation Summary Slides
This is a scatter bubble chart ppt powerpoint presentation summary slides. This is a one stage process. The stages in this process are product, profit, in percentage.
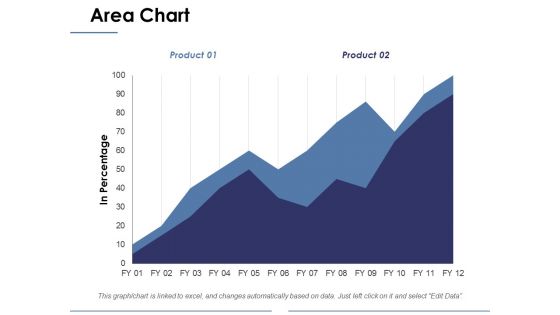
Area Chart Ppt PowerPoint Presentation Layouts Background Designs
This is a area chart ppt powerpoint presentation layouts background designs. This is a two stage process. The stages in this process are business, marketing, in percentage, area chart, finance.
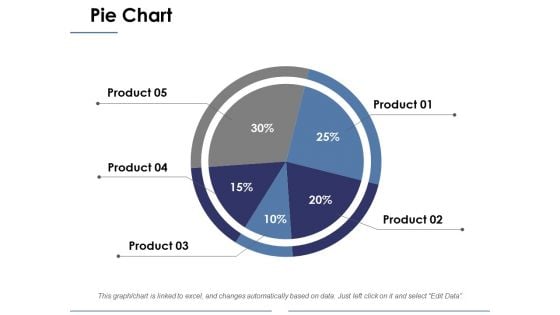
Pie Chart Ppt PowerPoint Presentation Infographics Shapes
This is a pie chart ppt powerpoint presentation infographics shapes. This is a five stage process. The stages in this process are business, pie chart, marketing, percentage, strategy.
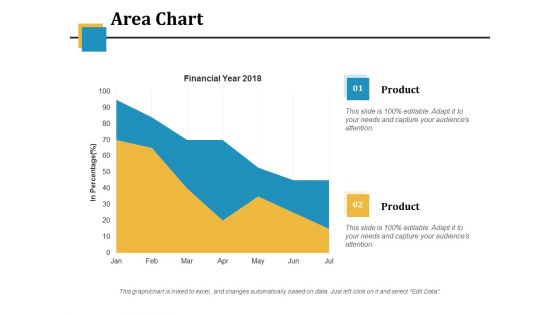
Area Chart Ppt PowerPoint Presentation Model Inspiration
This is a area chart ppt powerpoint presentation model inspiration. This is a two stage process. The stages in this process are financial year, in percentage, area chart, business, marketing.
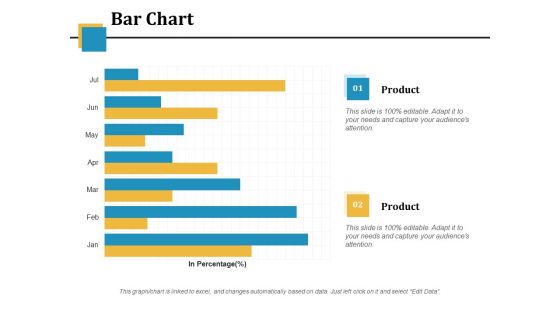
Bar Chart Ppt PowerPoint Presentation Infographic Template Picture
This is a bar chart ppt powerpoint presentation infographic template picture. This is a two stage process. The stages in this process are financial, in percentage, business, marketing, bar chart.
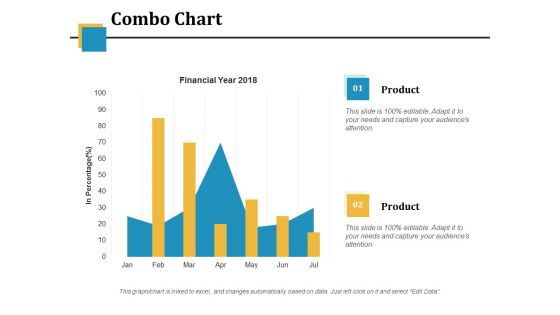
Combo Chart Ppt PowerPoint Presentation Model Vector
This is a combo chart ppt powerpoint presentation model vector. This is a two stage process. The stages in this process are financial year, in percentage, business, marketing, combo chart.
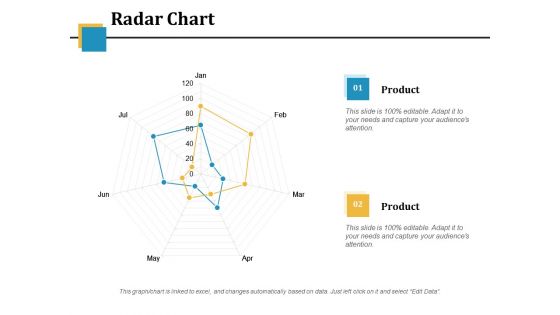
Radar Chart Ppt PowerPoint Presentation Summary Microsoft
This is a radar chart ppt powerpoint presentation summary microsoft. This is a two stage process. The stages in this process are business, radar chart, marketing, finance, strategy.
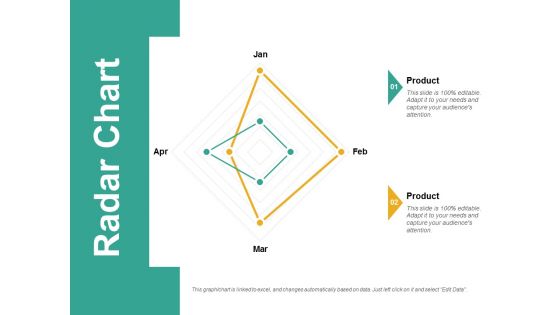
Radar Chart Ppt PowerPoint Presentation Visual Aids Professional
This is a radar chart ppt powerpoint presentation visual aids professional. This is a two stage process. The stages in this process are radar chart, finance, marketing, strategy, business.
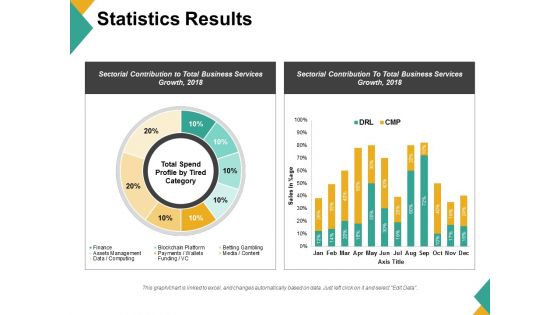
Statistics Results Ppt PowerPoint Presentation Gallery Graphics Pictures
This is a statistics results ppt powerpoint presentation gallery graphics pictures. This is a two stage process. The stages in this process are business, finance, marketing, strategy, analysis.

Area Chart Ppt PowerPoint Presentation Styles Design Templates
This is a area chart ppt powerpoint presentation styles design templates. This is a two stage process. The stages in this process are area chart, analysis, business, marketing, strategy.
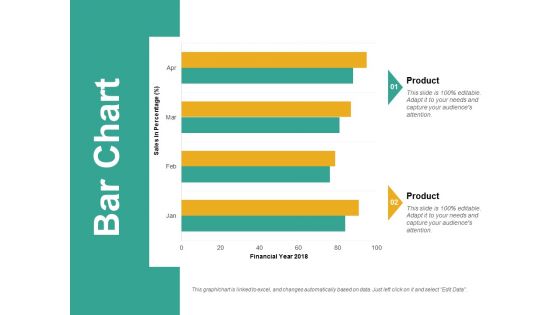
Bar Chart Ppt PowerPoint Presentation Slides Model
This is a bar chart ppt powerpoint presentation slides model. This is a two stage process. The stages in this process are bar chart, analysis, business, marketing, strategy, finance.

Combo Chart Ppt PowerPoint Presentation Inspiration Slide Download
This is a combo chart ppt powerpoint presentation inspiration slide download. This is a two stage process. The stages in this process are Combo chart, finance, marketing, strategy, analysis.
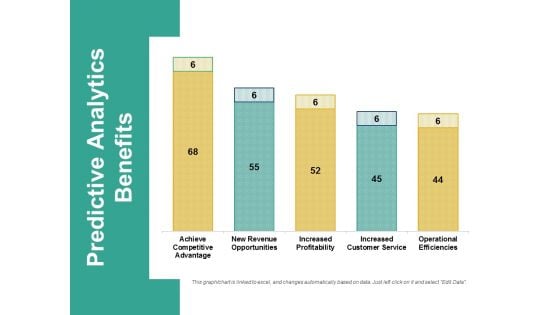
Predictive Analytics Benefits Ppt PowerPoint Presentation Professional Samples
This is a predictive analytics benefits ppt powerpoint presentation professional samples. This is a five stage process. The stages in this process are business, finance, marketing, strategy, analysis.
Bubble Chart Ppt PowerPoint Presentation Icon Gridlines
This is a bubble chart ppt powerpoint presentation icon gridlines. This is a two stage process. The stages in this process are bubble chart, finance, marketing, strategy, analysis.
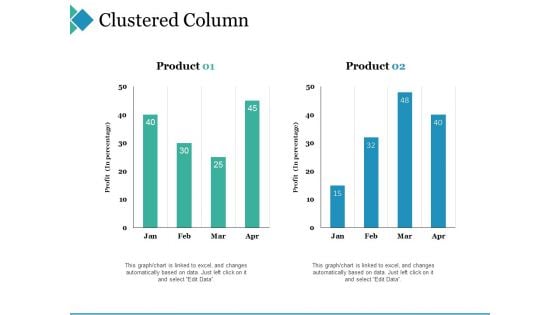
Clustered Column Ppt PowerPoint Presentation Gallery Microsoft
This is a clustered column ppt powerpoint presentation gallery microsoft. This is a two stage process. The stages in this process are clustered column, finance, marketing, strategy, analysis.
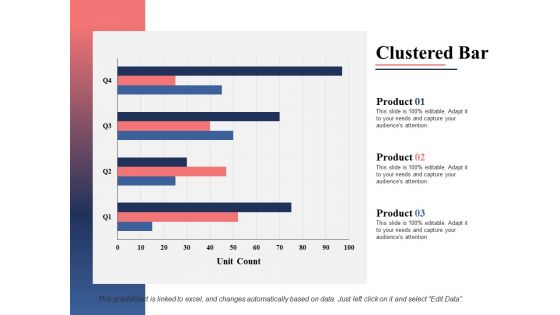
Clustered Bar Ppt PowerPoint Presentation Professional Guidelines
This is a clustered bar ppt powerpoint presentation professional guidelines. This is a three stage process. The stages in this process are clustered bar, finance, marketing, strategy, analysis.
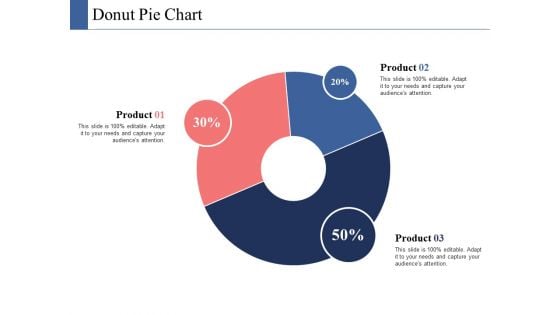
Donut Pie Chart Ppt PowerPoint Presentation Infographics Ideas
This is a donut pie chart ppt powerpoint presentation infographics ideas. This is a three stage process. The stages in this process are donut pie chart, finance, marketing, strategy, analysis.
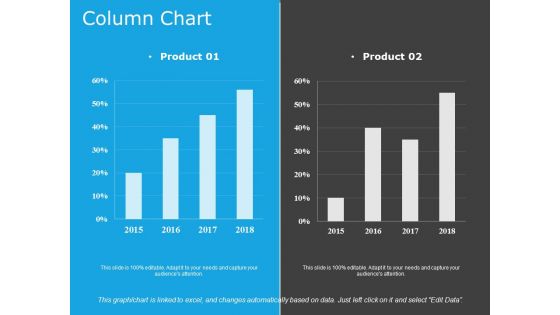
Column Chart Template 1 Ppt PowerPoint Presentation Portfolio Format
This is a column chart template 1 ppt powerpoint presentation portfolio format. This is a two stage process. The stages in this process are column chart, finance, marketing, strategy, business.
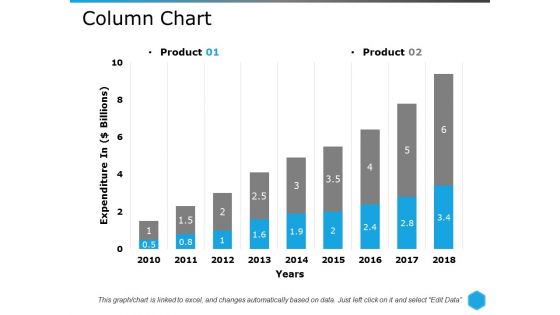
Column Chart Template 2 Ppt PowerPoint Presentation Infographic Template Example Introduction
This is a column chart template 2 ppt powerpoint presentation infographic template example introduction. This is a two stage process. The stages in this process are column chart, finance, analysis, marketing, strategy.
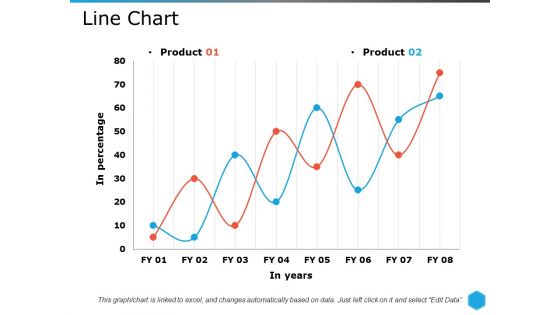
Line Chart Ppt PowerPoint Presentation Pictures Themes
This is a line chart ppt powerpoint presentation pictures themes. This is a two stage process. The stages in this process are line chart, growth, strategy, marketing, strategy, business.
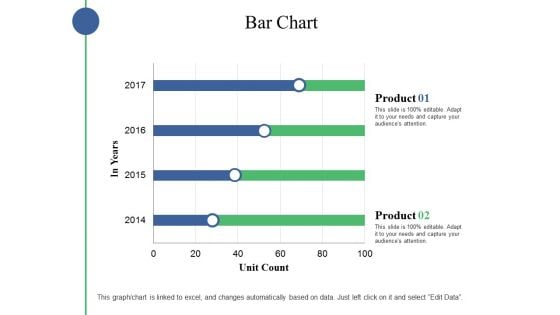
Bar Chart Ppt PowerPoint Presentation File Templates
This is a bar chart ppt powerpoint presentation file templates. This is a four stage process. The stages in this process are business, marketing, strategy, finance, planning.
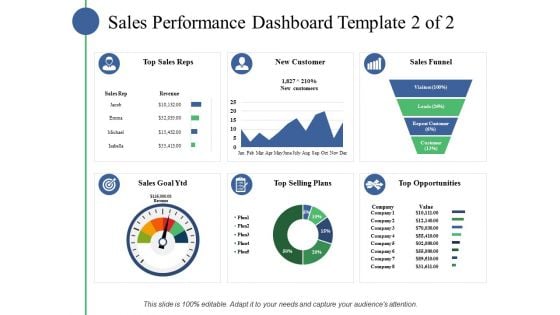
Sales Performance Dashboard Template Ppt PowerPoint Presentation Slides Example File
This is a sales performance dashboard template ppt powerpoint presentation slides example file. This is a eight stage process. The stages in this process are business, marketing, strategy, finance, planning.
Sales Performance Dashboard Ppt PowerPoint Presentation Professional Icons
This is a sales performance dashboard template ppt powerpoint presentation slides example file. This is a six stage process. The stages in this process are business, marketing, strategy, finance, planning.
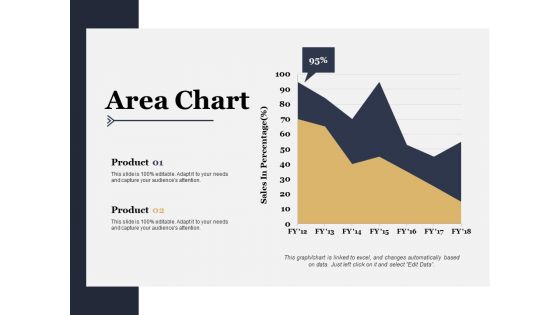
Area Chart Ppt PowerPoint Presentation Styles Professional
This is a area chart ppt powerpoint presentation styles professional. This is a two stage process. The stages in this process are sales in percentage, product, area chart.
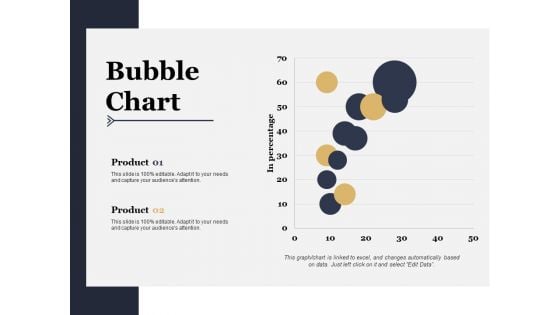
Bubble Chart Ppt PowerPoint Presentation Outline Demonstration
This is a bubble chart ppt powerpoint presentation outline demonstration. This is a two stage process. The stages in this process are bubble chart, product, in percentage.
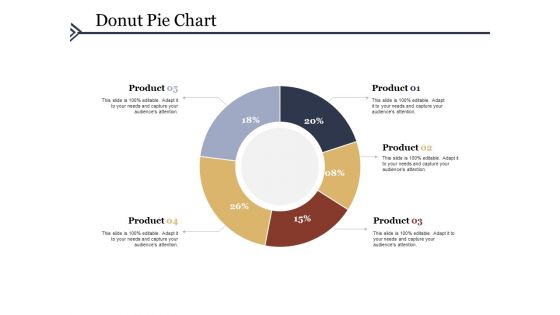
Donut Pie Chart Ppt PowerPoint Presentation Outline Smartart
This is a donut pie chart ppt powerpoint presentation outline smartart. This is a five stage process. The stages in this process are percentage, finance, donut, business, product.
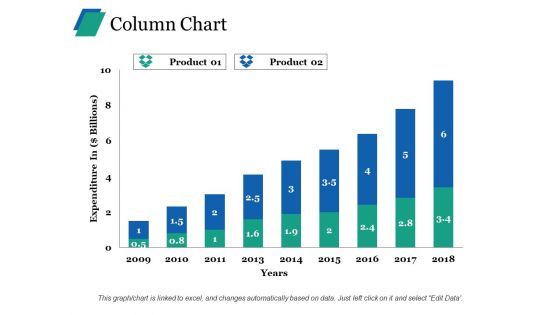
Column Chart Ppt PowerPoint Presentation Ideas Clipart
This is a column chart ppt powerpoint presentation ideas clipart. This is a two stage process. The stages in this process are product, expenditure in, years.
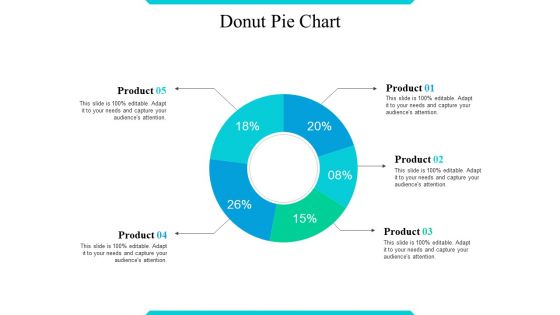
Donut Pie Chart Ppt PowerPoint Presentation Outline Display
This is a donut pie chart ppt powerpoint presentation outline display. This is a five stage process. The stages in this process are percentage, finance, donut, business, product.
Donut Pie Chart Ppt PowerPoint Presentation Slides Icon
This is a donut pie chart ppt powerpoint presentation slides icon. This is a five stage process. The stages in this process are donut, business, marketing, startegy, planning.

Stacked Bar Ppt PowerPoint Presentation Layouts Brochure
This is a stacked bar ppt powerpoint presentation layouts brochure. This is a four stage process. The stages in this process are business, marketing, strategy, planning, finance.
Area Chart Ppt PowerPoint Presentation Icon Deck
This is a area chart ppt powerpoint presentation icon deck. This is a two stage process. The stages in this process are area chart, finance, marketing, strategy, business.
Bubble Chart Ppt PowerPoint Presentation Outline Icon
This is a bubble chart ppt powerpoint presentation outline icon. This is a two stage process. The stages in this process are bubble chart, finance, marketing, strategy, business.
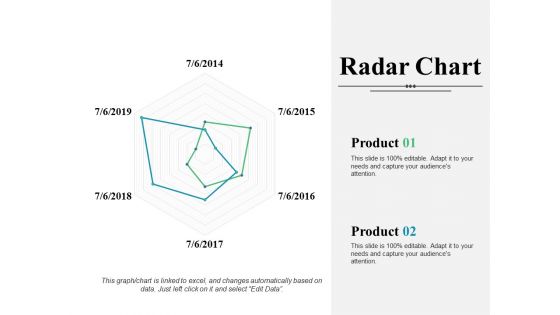
Radar Chart Ppt PowerPoint Presentation Infographic Template Introduction
This is a radar chart ppt powerpoint presentation infographic template introduction. This is a two stage process. The stages in this process are radar chart, finance, marketing, strategy, analysis, business.
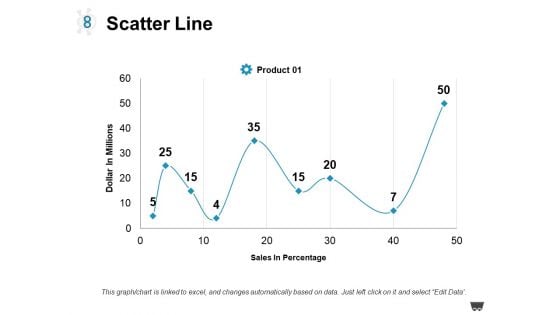
Scatter Line Ppt PowerPoint Presentation Styles Graphics Pictures
This is a scatter line ppt powerpoint presentation styles graphics pictures. This is a one stage process. The stages in this process are product, dollar in millions, sales in percentage.
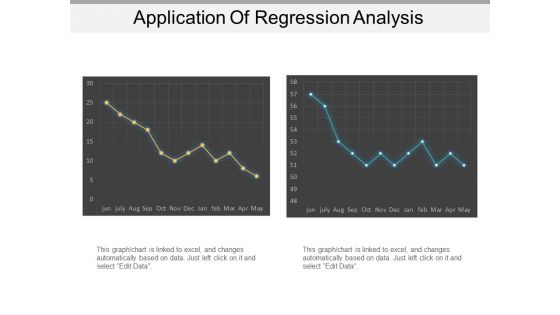
Application Of Regression Analysis Ppt PowerPoint Presentation Show Good
This is a application of regression analysis ppt powerpoint presentation show good. This is a two stage process. The stages in this process are linear periodization, linear growth, linear progression.
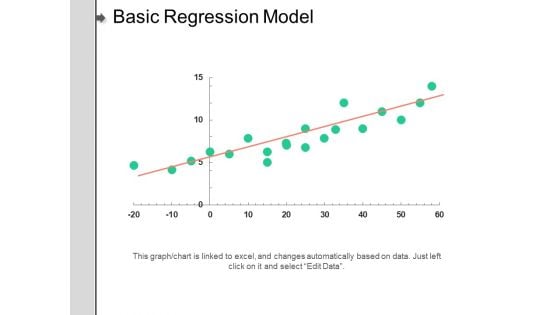
Basic Regression Model Ppt PowerPoint Presentation Pictures Layout Ideas
This is a basic regression model ppt powerpoint presentation pictures layout ideas. This is a one stage process. The stages in this process are linear periodization, linear growth, linear progression.
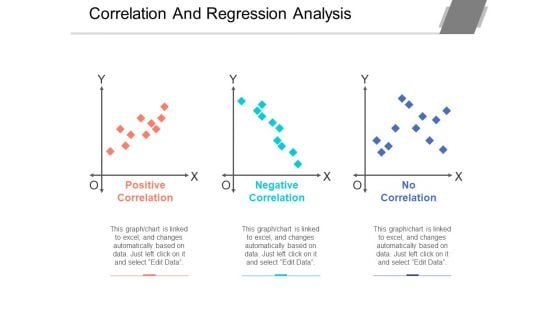
Correlation And Regression Analysis Ppt PowerPoint Presentation Styles Structure
This is a correlation and regression analysis ppt powerpoint presentation styles structure. This is a three stage process. The stages in this process are linear periodization, linear growth, linear progression.
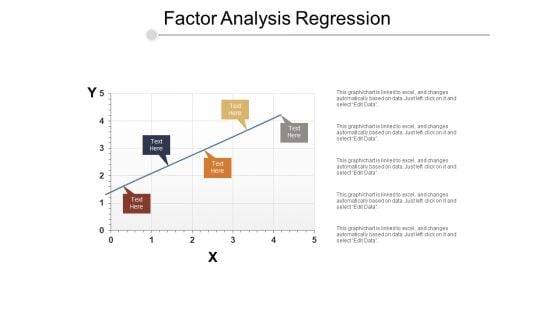
Factor Analysis Regression Ppt PowerPoint Presentation Styles Gallery
This is a factor analysis regression ppt powerpoint presentation styles gallery. This is a five stage process. The stages in this process are linear periodization, linear growth, linear progression.

Regression Line Chart Ppt PowerPoint Presentation Visual Aids Summary
This is a regression line chart ppt powerpoint presentation visual aids summary. This is a two stage process. The stages in this process are linear periodization, linear growth, linear progression.
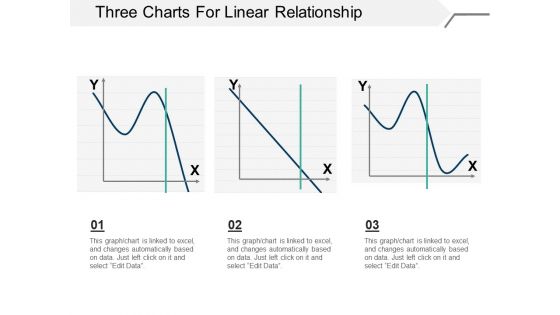
Three Charts For Linear Relationship Ppt PowerPoint Presentation Model Example
This is a three charts for linear relationship ppt powerpoint presentation model example. This is a three stage process. The stages in this process are linear periodization, linear growth, linear progression.


 Continue with Email

 Home
Home


