growth plan

Career Path Development Ppt Powerpoint Presentation Infographic Template Tips
This is a career path development ppt powerpoint presentation infographic template tips. This is a three stage process. The stages in this process are increase, improvement, enhancement.
Scatter Line Chart Ppt PowerPoint Presentation Icon Files
This is a scatter line chart ppt powerpoint presentation icon files. This is a one stage process. The stages in this process are dollar in millions, product, sales in percentage.
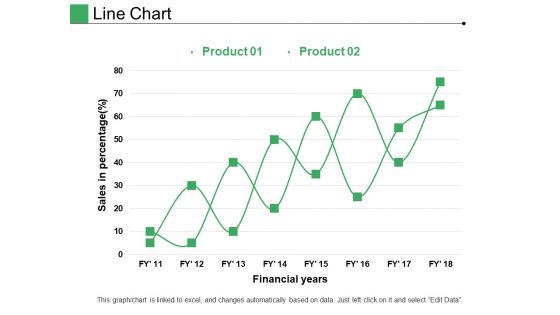
Line Chart Ppt PowerPoint Presentation Pictures Layout
This is a line chart ppt powerpoint presentation pictures layout. This is a two stage process. The stages in this process are product, financial years, sales in percentage.
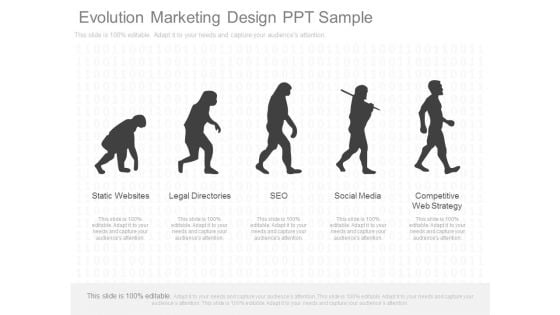
Evolution Marketing Design Ppt Sample
This is an evolution marketing design ppt sample. This is a five stage process. The stages in this process are static websites, legal directories, seo, social media, competitive web strategy.
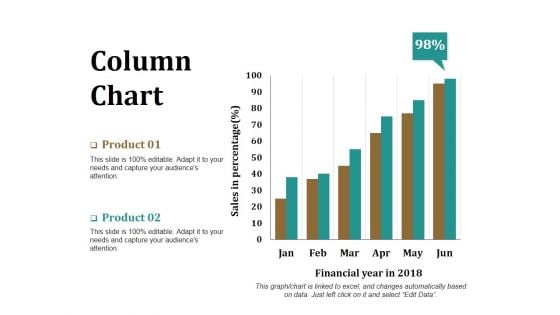
Column Chart Ppt PowerPoint Presentation Model Graphics Download
This is a column chart ppt powerpoint presentation model graphics download. This is a two stage process. The stages in this process are product, financial year, sales in percentage, bar graph, success.
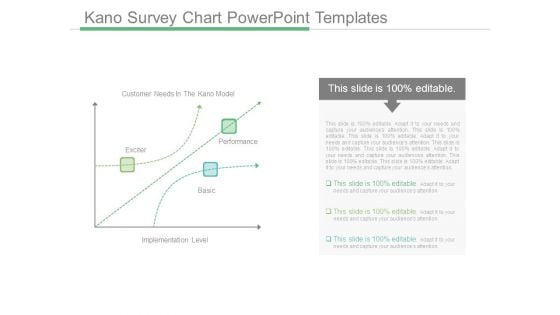
Kano Survey Chart Powerpoint Templates
This is a kano survey chart powerpoint templates. This is a three stage process. The stages in this process are customer needs in the kano model, exciter, performance, basic, implementation level.
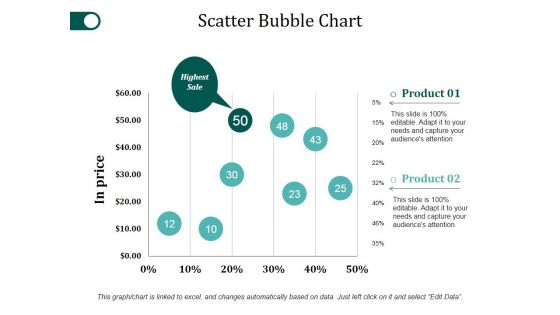
Scatter Bubble Chart Ppt PowerPoint Presentation Styles Objects
This is a scatter bubble chart ppt powerpoint presentation styles objects. This is a two stage process. The stages in this process are product, in price, highest sale, percentage, finance.
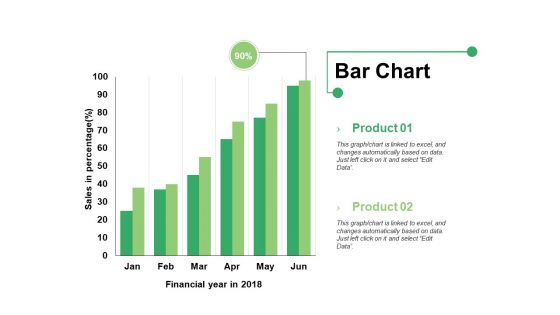
Bar Chart Ppt PowerPoint Presentation Infographics Format Ideas
This is a bar chart ppt powerpoint presentation infographics format ideas. This is a two stage process. The stages in this process are bar graph, product, financial year, sales in percentage.
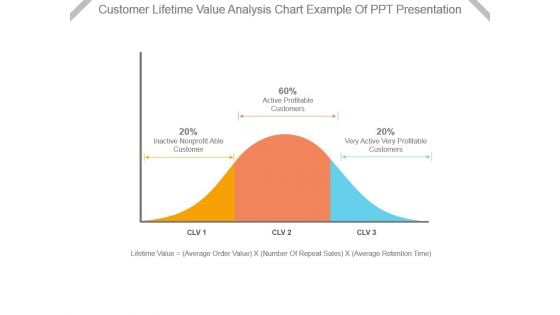
Customer Lifetime Value Analysis Chart Example Of Ppt Presentation
This is a customer lifetime value analysis chart example of ppt presentation. This is a three stage process. The stages in this process are inactive nonprofit able customer, active profitable customers, very active very profitable customers, lifetime value, average order value, number of repeat sales, average retention time.
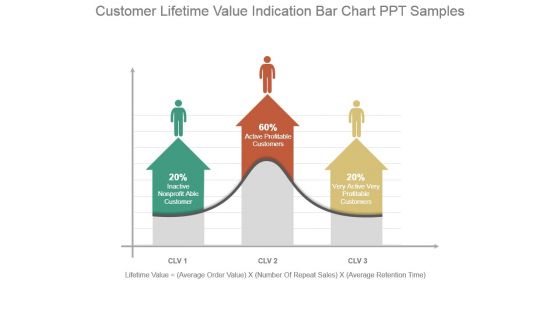
Customer Lifetime Value Indication Bar Chart Ppt Samples
This is a customer lifetime value indication bar chart ppt samples. This is a three stage process. The stages in this process are inactive nonprofit able customer, active profitable customers, very active very profitable customers, lifetime value, average order value, number of repeat sales, average retention time.
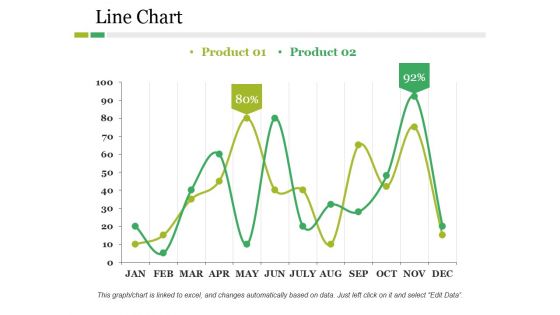
Line Chart Ppt PowerPoint Presentation Pictures Structure
This is a line chart ppt powerpoint presentation pictures structure. This is a two stage process. The stages in this process are product, business, line chart, finance, percentage.
Line Chart Ppt PowerPoint Presentation Icon Example
This is a line chart ppt powerpoint presentation icon example. This is a two stage process. The stages in this process are products, profit, line chart, business, marketing.
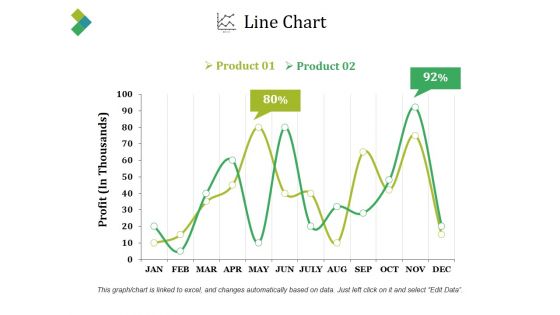
Line Chart Ppt PowerPoint Presentation Slides
This is a line chart ppt powerpoint presentation slides. This is a two stage process. The stages in this process are product, profit, percentage, finance, line chart.
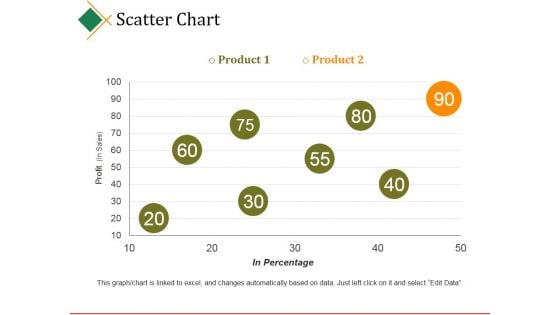
Scatter Chart Ppt PowerPoint Presentation Model
This is a scatter chart ppt powerpoint presentation model. This is a two stage process. The stages in this process are business, product, profit, in percentage, business.
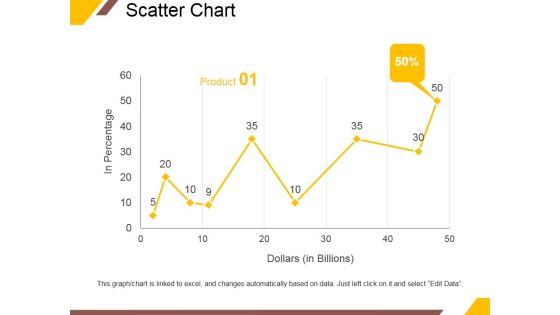
Scatter Chart Ppt PowerPoint Presentation Gallery Vector
This is a scatter chart ppt powerpoint presentation gallery vector. This is a nine stage process. The stages in this process are in percentage, dollars, product, percentage, finance.
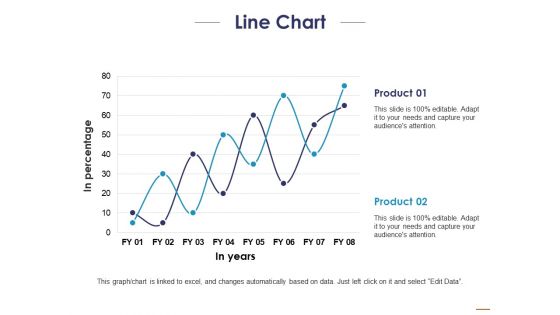
Line Chart Ppt PowerPoint Presentation Layouts Templates
This is a line chart ppt powerpoint presentation layouts templates. This is a two stage process. The stages in this process are product, in percentage, in years.
Bubble Chart Ppt PowerPoint Presentation Pictures Icons
This is a bubble chart ppt powerpoint presentation pictures icons. This is a two stage process. The stages in this process are product, profit, bubble chart.
Area Chart Ppt PowerPoint Presentation Icon Show
This is a area chart ppt powerpoint presentation icon show. This is a two stage process. The stages in this process are product, financial year, in percentage, area chart.
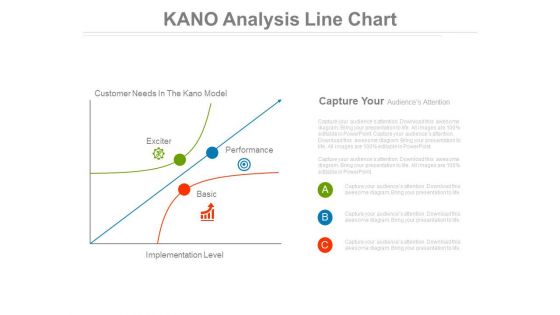
Kano Analysis Line Chart Ppt Slides
This is a kano analysis line chart ppt slides. This is a three stage process. The stages in this process are marketing, business.\n\n
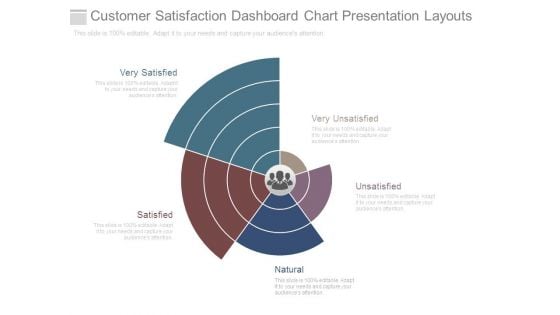
Customer Satisfaction Dashboard Chart Presentation Layouts
This is a customer satisfaction dashboard chart presentation layouts. This is a five stage process. The stages in this process are very satisfied, satisfied, unsatisfied, natural, very unsatisfied.
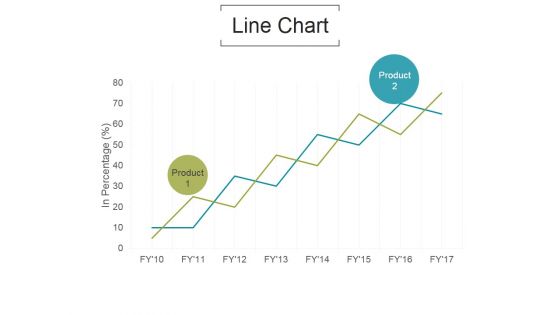
Line Chart Ppt PowerPoint Presentation Model
This is a line chart ppt powerpoint presentation model. This is a two stage process. The stages in this process are in percentage, product, business.
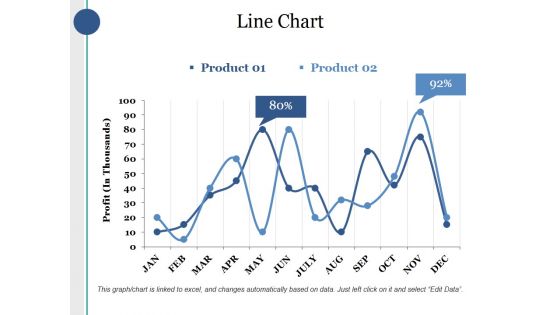
Line Chart Ppt PowerPoint Presentation Layouts Sample
This is a line chart ppt powerpoint presentation layouts sample. This is a two stage process. The stages in this process are product, profit, percentage, finance, business.
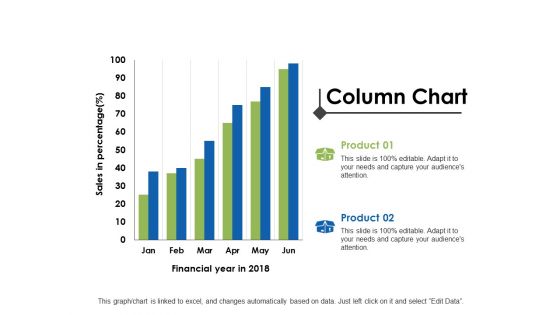
Column Chart Ppt PowerPoint Presentation Layouts Rules
This is a column chart ppt powerpoint presentation layouts rules. This is a two stage process. The stages in this process are analysis, finance, marketing, management, investment.
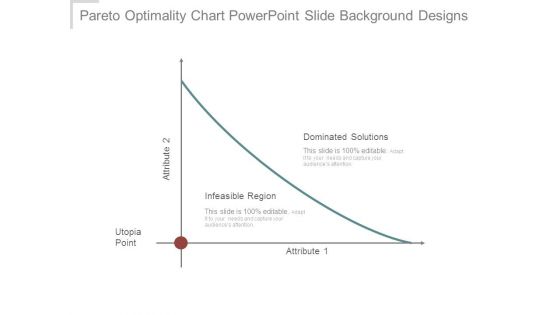
Pareto Optimality Chart Powerpoint Slide Background Designs
This is a pareto optimality chart powerpoint slide background designs. This is a one stage process. The stages in this process are dominated solutions, infeasible region, utopia point, attribute.
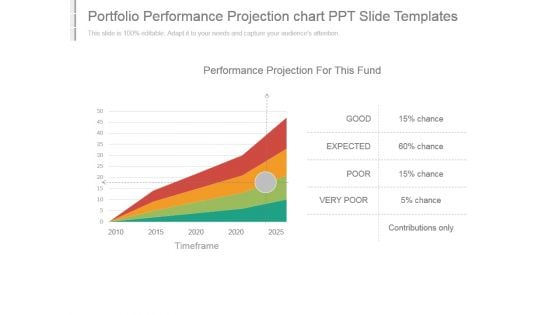
Portfolio Performance Projection Chart Ppt Slide Templates
This is a portfolio performance projection chart ppt slide templates. This is a four stage process. The stages in this process are performance projection for this fund, good, expected, poor, very poor, contributions only, timeframe.
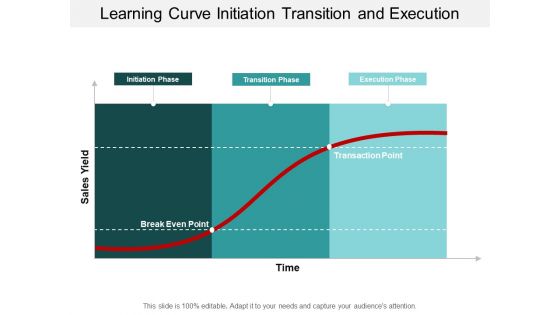
Learning Curve Initiation Transition And Execution Ppt PowerPoint Presentation Inspiration Design Templates
This is a learning curve initiation transition and execution ppt powerpoint presentation inspiration design templates. This is a three stage process. The stages in this process are experience curve, learning curve.
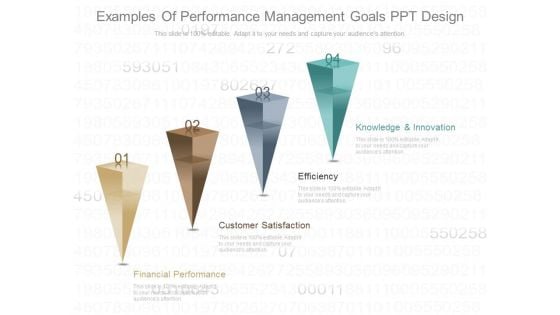
Examples Of Performance Management Goals Ppt Design
This is an examples of performance management goals ppt design. This is a four stage process. The stages in this process are financial performance, customer satisfaction, efficiency, knowledge and innovation.

Rogers Technology Adoption Curve Ppt PowerPoint Presentation Summary Background
This is a rogers technology adoption curve ppt powerpoint presentation summary background. This is a five stage process. The stages in this process are innovators, early adopters, early majority, late majority, laggards.
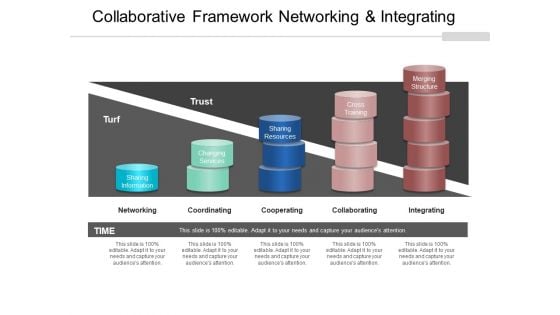
Collaborative Framework Networking And Integrating Ppt PowerPoint Presentation Model Slide
This is a collaborative framework networking and integrating ppt powerpoint presentation model slide. This is a five stage process. The stages in this process are circular, continuity, continuum.
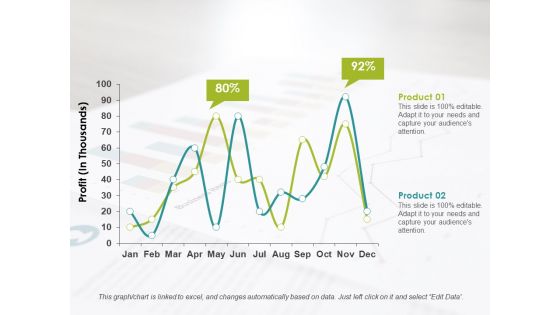
Line Chart Ppt PowerPoint Presentation Infographics Format Ideas
This is a line chart ppt powerpoint presentation infographics format ideas. This is a two stage process. The stages in this process are product, profit, business.
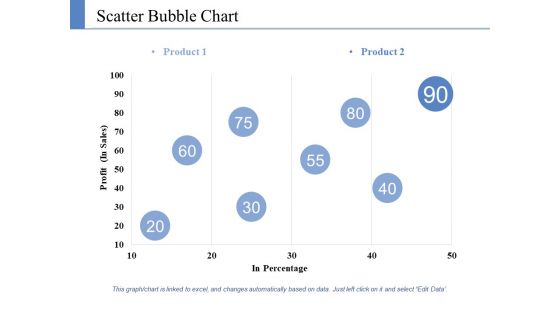
Scatter Bubble Chart Ppt PowerPoint Presentation Styles Information
This is a scatter bubble chart ppt powerpoint presentation styles information. This is a two stage process. The stages in this process are product, profit, in percentage.
Scatter Bubble Chart Ppt PowerPoint Presentation Icon Elements
This is a scatter bubble chart ppt powerpoint presentation icon elements. This is a six stage process. The stages in this process are highest profit, profit, financial year, product.
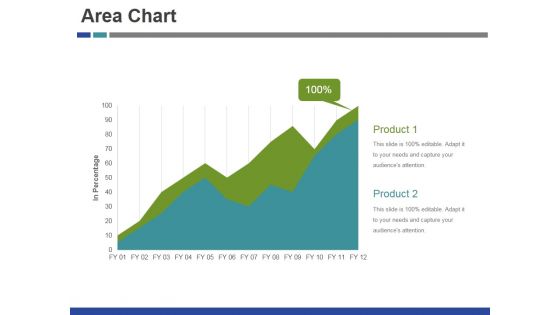
Area Chart Ppt PowerPoint Presentation Infographic Template Show
This is a area chart ppt powerpoint presentation infographic template show. This is a two stage process. The stages in this process are product, marketing, management, business, success.
Bar Chart Ppt PowerPoint Presentation Icon Infographic Template
This is a bar chart ppt powerpoint presentation icon infographic template. This is a nine stage process. The stages in this process are product, marketing, management, business, success.
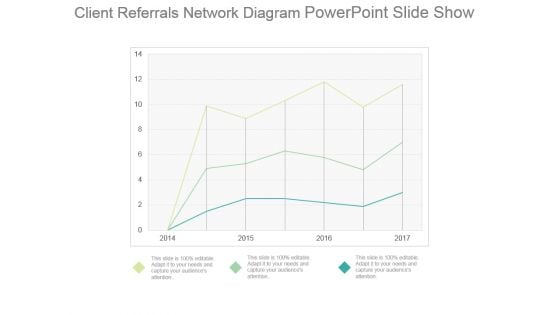
Client Referrals Network Diagram Powerpoint Slide Show
This is a client referrals network diagram powerpoint slide show. This is a three stage process. The stages in this process are business, marketing, strategy, management, analysis.
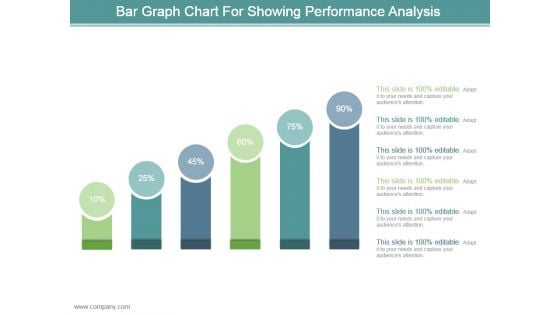
Bar Graph Chart For Showing Performance Analysis Ppt Design
This is a bar graph chart for showing performance analysis ppt design. This is a six stage process. The stages in this process are business, marketing, process, success, presentation.
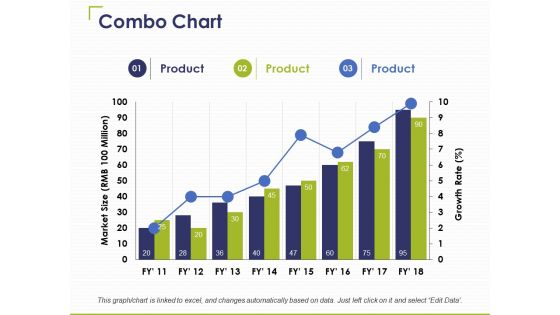
Combo Chart Ppt PowerPoint Presentation Infographics Graphics Pictures
This is a combo chart ppt powerpoint presentation infographics graphics pictures. This is a three stage process. The stages in this process are product, business, marketing, combo chart.
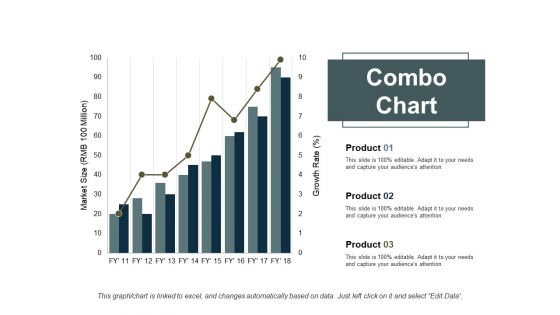
Combo Chart Finance Ppt PowerPoint Presentation Slides Backgrounds
This is a combo chart finance ppt powerpoint presentation slides backgrounds. This is a three stage process. The stages in this process are combo chart, finance, marketing, analysis, business.
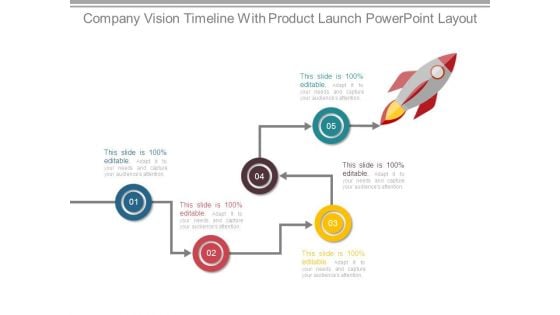
Company Vision Timeline With Product Launch Powerpoint Layout
This is a company vision timeline with product launch powerpoint layout. This is a five stage process. The stages in this process are business, marketing, strategy, process, management, icons, arrow.
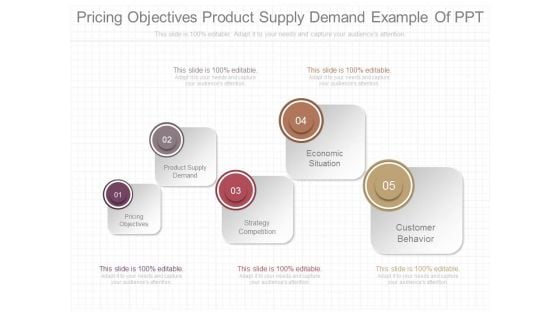
Pricing Objectives Product Supply Demand Example Of Ppt
This is a pricing objectives product supply demand example of ppt. This is a five stage process. The stages in this process are pricing objectives, product supply demand, strategy competition, economic situation, customer behavior.
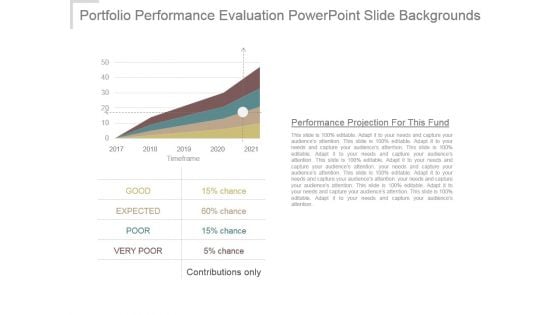
Portfolio Performance Evaluation Powerpoint Slide Backgrounds
This is a portfolio performance evaluation powerpoint slide backgrounds. This is a four stage process. The stages in this process are performance projection for this fund, timeframe, good, expected, poor, very poor, contributions only, chance.
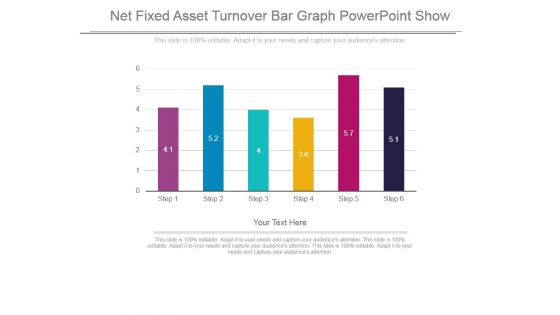
Net Fixed Asset Turnover Bar Graph Powerpoint Show
This is a net fixed asset turnover bar graph powerpoint show. This is a six stage process. The stages in this process are bar graph, presentation, strategy, business, management.

Our Mission Ppt PowerPoint Presentation Infographic Template Backgrounds
This is a our mission ppt powerpoint presentation infographic template backgrounds. This is a one stage process. The stages in this process are our mission, icons, strategy, launch, achievement.
Histogram Showing Business Trends Vector Icon Ppt PowerPoint Presentation Styles Portrait Cpb
This is a histogram showing business trends vector icon ppt powerpoint presentation styles portrait cpb. This is a three stage process. The stages in this process are bar chart icon, bar graph icon, data chart icon.
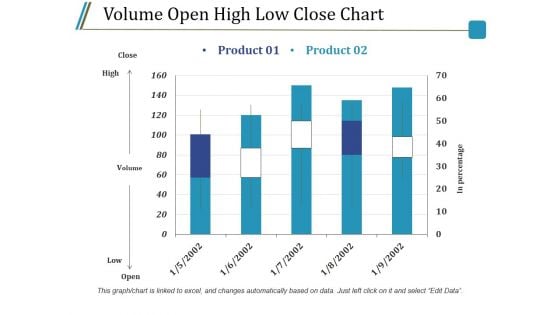
Volume Open High Low Close Chart Ppt PowerPoint Presentation Infographics Guide
This is a volume open high low close chart ppt powerpoint presentation infographics guide. This is a two stage process. The stages in this process are close, high, volume, low, open, product.
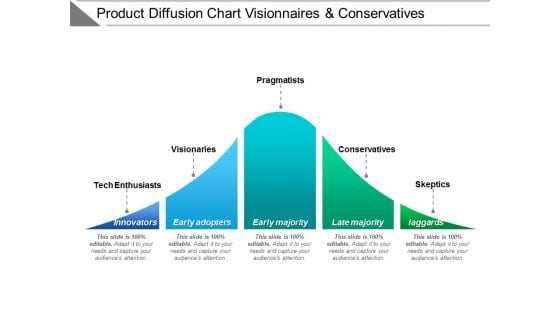
Product Diffusion Chart Visionaries And Conservatives Ppt PowerPoint Presentation Model Clipart
This is a product diffusion chart visionaries and conservatives ppt powerpoint presentation model clipart. This is a five stage process. The stages in this process are adoption curve, crossing the chasm, hype cycle.
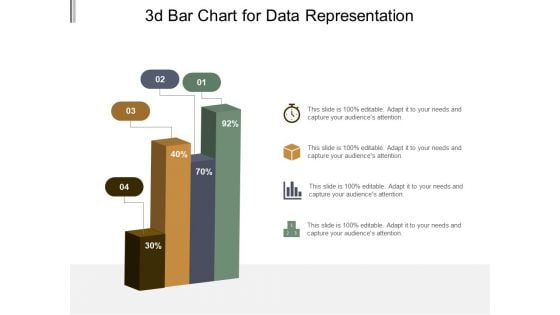
3D Bar Chart For Data Representation Ppt PowerPoint Presentation Model Graphic Tips
This is a 3d bar chart for data representation ppt powerpoint presentation model graphic tips. This is a four stage process. The stages in this process are art, colouring, paint brush.
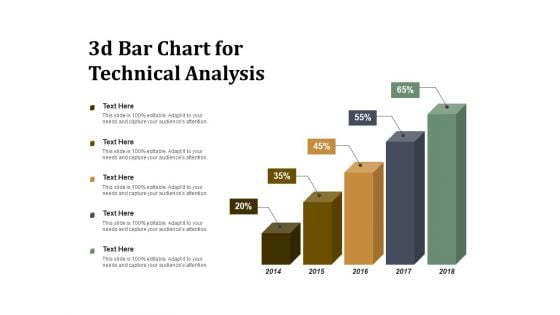
3D Bar Chart For Technical Analysis Ppt PowerPoint Presentation Summary Visuals
This is a 3d bar chart for technical analysis ppt powerpoint presentation summary visuals. This is a five stage process. The stages in this process are art, colouring, paint brush.
3D Bar Chart To Display Data Ppt PowerPoint Presentation Icon Design Inspiration
This is a 3d bar chart to display data ppt powerpoint presentation icon design inspiration. This is a four stage process. The stages in this process are art, colouring, paint brush.
3D Chart For Graphical Display Of Data Ppt PowerPoint Presentation Styles Icon
This is a 3d chart for graphical display of data ppt powerpoint presentation styles icon. This is a four stage process. The stages in this process are art, colouring, paint brush.

Effectiveness Of Teamwork Team With Gears And Bar Chart Ppt Powerpoint Presentation Ideas Information
This is a effectiveness of teamwork team with gears and bar chart ppt powerpoint presentation ideas information. This is a four stage process. The stages in this process are team performance, member performance, group performance.
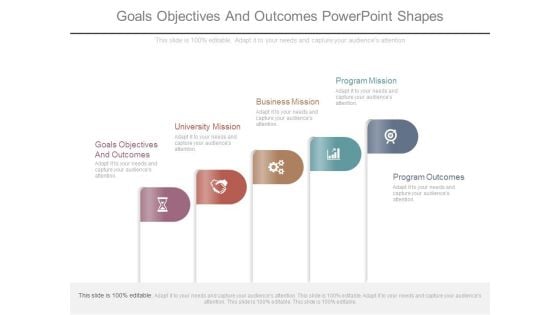
Goals Objectives And Outcomes Powerpoint Shapes
This is a goals objectives and outcomes powerpoint shapes. This is a five stage process. The stages in this process are goals objectives and outcomes, university mission, business mission, program mission, program outcomes.

Structure And Leadership Powerpoint Slide Deck
This is a structure and leadership powerpoint slide deck. This is a six stage process. The stages in this process are structure and leadership, review and evaluation, business functional, measure and scorecards, gilding politics, program and investment.
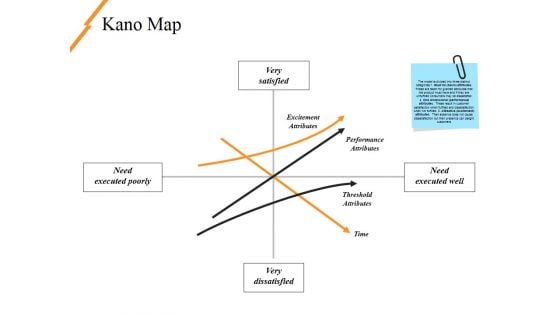
Kano Map Ppt PowerPoint Presentation Pictures Background Designs
This is a kano map ppt powerpoint presentation pictures background designs. This is a four stage process. The stages in this process are excitement attributes, performance attributes, threshold attributes, time, need executed well.
Green Arrows On Bars Vector Icon Ppt PowerPoint Presentation Infographic Template Templates Cpb
This is a green arrows on bars vector icon ppt powerpoint presentation infographic template templates cpb. This is a three stage process. The stages in this process are bar chart icon, bar graph icon, data chart icon.
Growing Arrow On Bar Graph Vector Icon Ppt PowerPoint Presentation Designs Cpb
This is a growing arrow on bar graph vector icon ppt powerpoint presentation designs cpb . This is a three stage process. The stages in this process are bar chart icon, bar graph icon, data chart icon.
Histogram Financial Analysis Vector Icon Ppt PowerPoint Presentation Layouts File Formats Cpb
This is a histogram financial analysis vector icon ppt powerpoint presentation layouts file formats cpb. This is a three stage process. The stages in this process are bar chart icon, bar graph icon, data chart icon.
Histogram Icon Showing Economic Fluctuations Ppt PowerPoint Presentation Slides Samples Cpb
This is a histogram icon showing economic fluctuations ppt powerpoint presentation slides samples cpb. This is a three stage process. The stages in this process are bar chart icon, bar graph icon, data chart icon.
Histogram With Dollar For Financial Success Vector Icon Ppt PowerPoint Presentation Portfolio Example File Cpb
This is a histogram with dollar for financial success vector icon ppt powerpoint presentation portfolio example file cpb. This is a three stage process. The stages in this process are bar chart icon, bar graph icon, data chart icon.
Histogram With Gear Vector Icon Ppt PowerPoint Presentation Professional Slides Cpb
This is a histogram with gear vector icon ppt powerpoint presentation professional slides cpb. This is a three stage process. The stages in this process are bar chart icon, bar graph icon, data chart icon.


 Continue with Email

 Home
Home


