growth plan
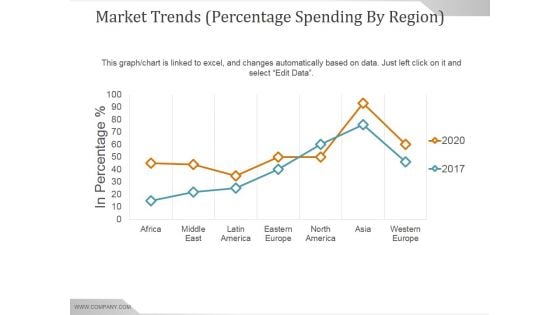
Market Trends Percentage Spending By Region Ppt PowerPoint Presentation Sample
This is a market trends percentage spending by region ppt powerpoint presentation sample. This is a seven stage process. The stages in this process are africa, middle east, latin america, eastern europe, north america, asia, western europe.
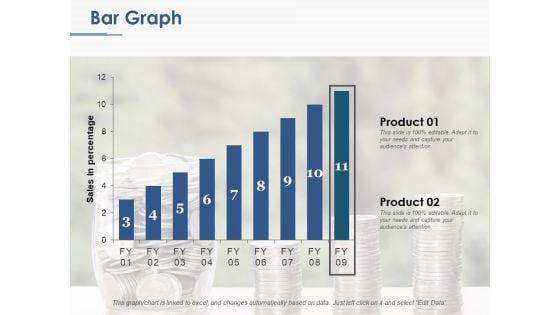
Bar Graph Ppt PowerPoint Presentation Ideas Display
This is a bar graph ppt powerpoint presentation ideas display. This is a two stage process. The stages in this process are product, sales in percentage, bar graph.
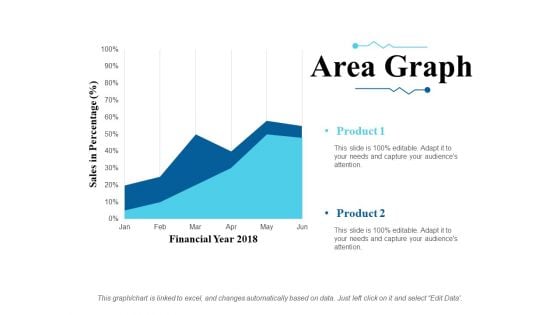
Area Graph Ppt PowerPoint Presentation Slides Ideas
This is a area graph ppt powerpoint presentation slides ideas. This is a two stage process. The stages in this process are sales in percentage, financial year, product.
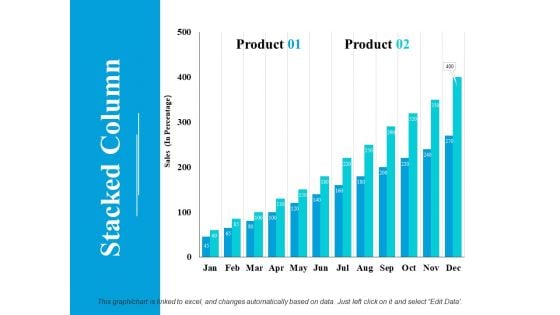
Stacked Column Ppt PowerPoint Presentation Model Inspiration
This is a stacked column ppt powerpoint presentation model inspiration. This is a two stage process. The stages in this process are product, sales, stacked column.
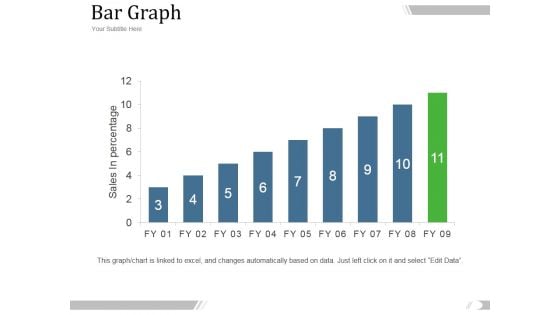
Bar Graph Ppt PowerPoint Presentation Introduction
This is a bar graph ppt powerpoint presentation introduction. This is a eleven stage process. The stages in this process are management, marketing, business, fy, graph, sales in percentage.
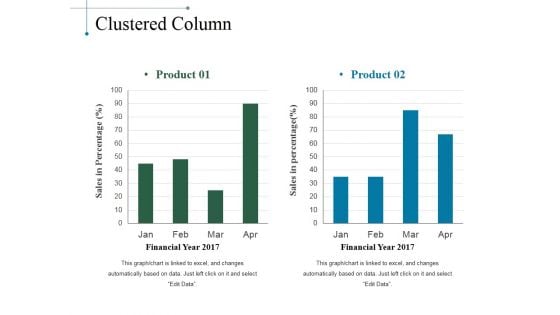
Clustered Column Ppt PowerPoint Presentation Slides Smartart
This is a clustered column ppt powerpoint presentation slides smartart. This is a two stage process. The stages in this process are product, sales in percentage, financial year, bar graph.
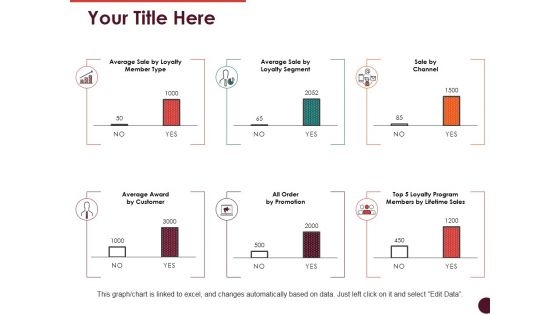
Your Title Here Ppt PowerPoint Presentation Show Good
This is a your title here ppt powerpoint presentation show good. This is a six stage process. The stages in this process are sale by channel, average award by customer, all order by promotion.
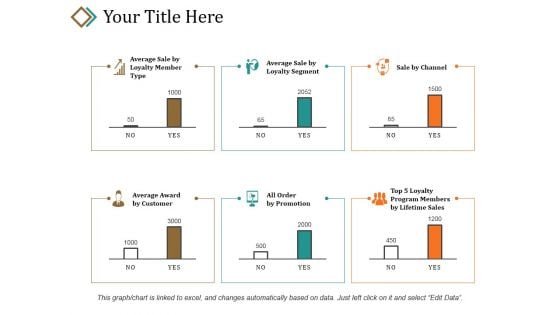
Your Title Here Ppt PowerPoint Presentation Layouts Introduction
This is a your title here ppt powerpoint presentation layouts introduction. This is a six stage process. The stages in this process are sale by channel, average award by customer, all order by promotion.
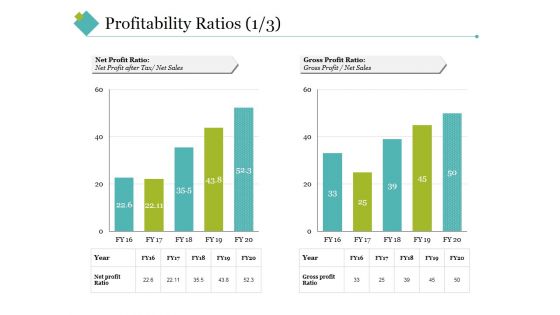
Profitability Ratios Template 2 Ppt PowerPoint Presentation Styles Example Topics
This is a profitability ratios template 2 ppt powerpoint presentation styles example topics. This is a two stage process. The stages in this process are net profit ratio, gross profit ratio, net sales, gross profit, year.
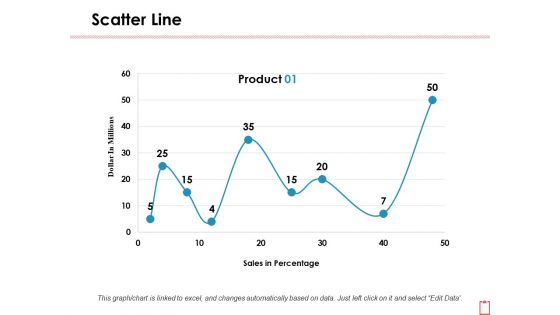
Scatter Line Ppt PowerPoint Presentation Infographics Background Images
This is a scatter line ppt powerpoint presentation infographics background images. This is a one stage process. The stages in this process are dollar in millions, product, sales in percentage.

Market Trends Current Number Ppt PowerPoint Presentation Inspiration
This is a market trends current number ppt powerpoint presentation inspiration. This is a seven stage process. The stages in this process are latin america, canada, japan, asia pacific, us, rest of world.
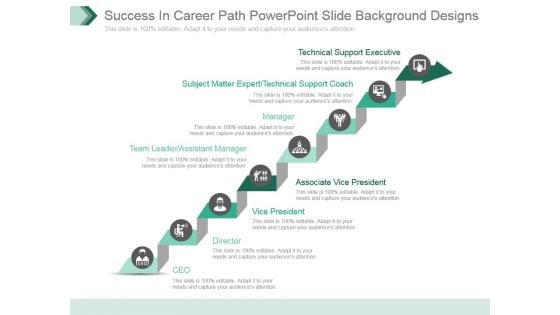
Success In Career Path Powerpoint Slide Background Designs
This is a success in career path powerpoint slide background designs. This is a eight stage process. The stages in this process are technical support executive, subject matter expert technical support coach, manager, team leader assistant manager, associate vice president, vice president, director, ceo.
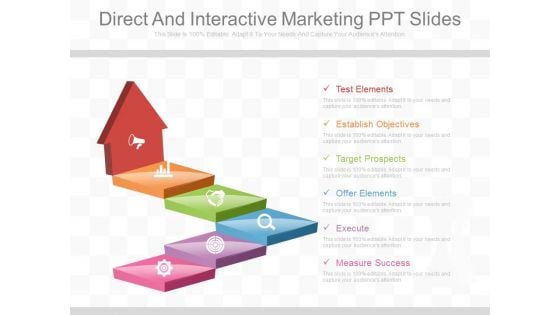
Direct And Interactive Marketing Ppt Slides
This is a direct and interactive marketing ppt slides. This is a six stage process. The stages in this process are test elements, establish objectives, target prospects, offer elements, execute, measure success.
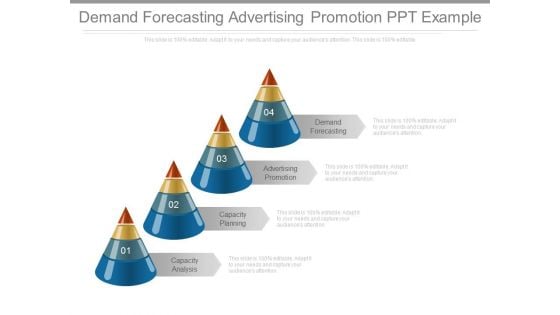
Demand Forecasting Advertising Promotion Ppt Example
This is a demand forecasting advertising promotion ppt example. This is a four stage process. The stages in this process circle chart marketing, business, success.
Nine Steps With Business Icons Powerpoint Templates
This business slide has been designed with nine steps with business icons. You may download this diagram to display stratgey steps for business success. Chart the course you intend to take with this slide
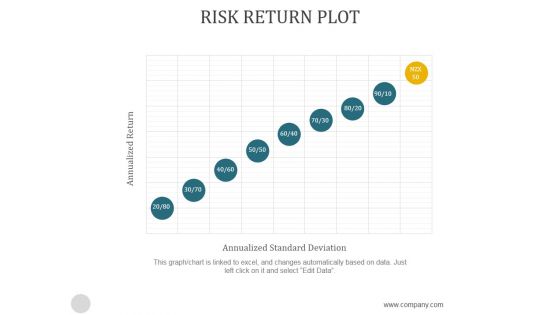
Risk Return Plot Ppt PowerPoint Presentation Background Image
This is a risk return plot ppt powerpoint presentation background image. This is a one stage process. The stages in this process are annualized return, annualized standard deviation.
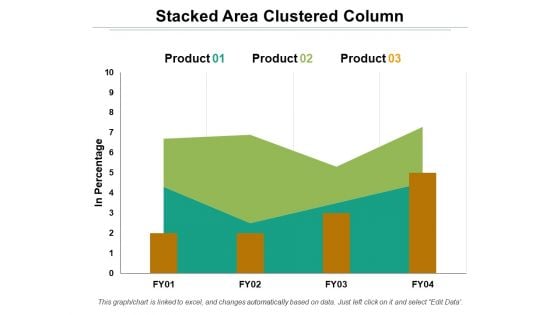
Stacked Area Clustered Column Ppt PowerPoint Presentation Layouts Templates
This is a stacked area clustered column ppt powerpoint presentation layouts templates. This is a three stage process. The stages in this process are product, in percentage, area chart.
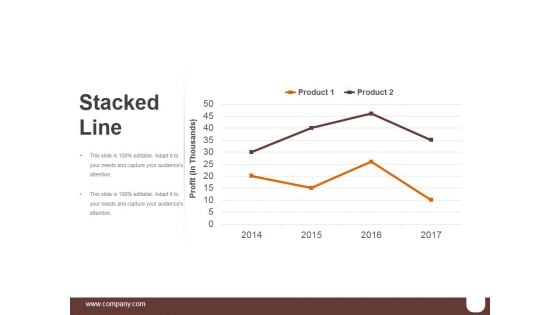
Stacked Line Ppt PowerPoint Presentation Background Images
This is a stacked line ppt powerpoint presentation background images. This is a two stage process. The stages in this process are business, marketing, graph, success, line.
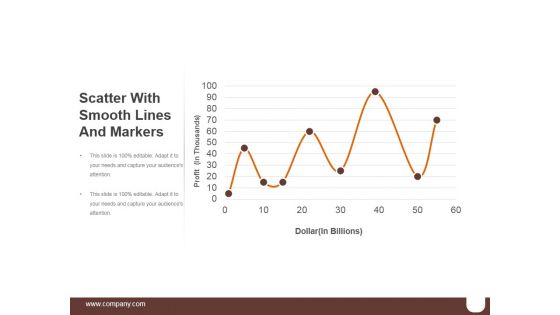
Scatter With Smooth Lines And Markers Ppt PowerPoint Presentation Ideas
This is a scatter with smooth lines and markers ppt powerpoint presentation ideas. This is a seven stage process. The stages in this process are business, marketing, percentage, success, finance.
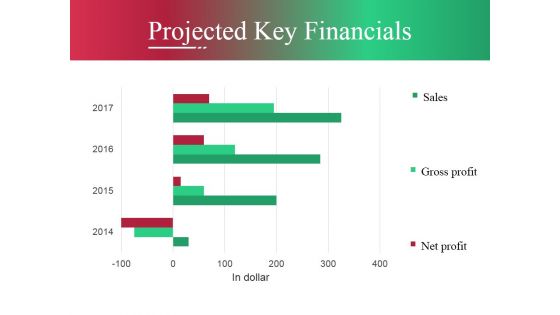
Projected Key Financials Ppt PowerPoint Presentation Pictures Master Slide
This is a projected key financials ppt powerpoint presentation pictures master slide. This is a three stage process. The stages in this process are business, marketing, line, graph, success.
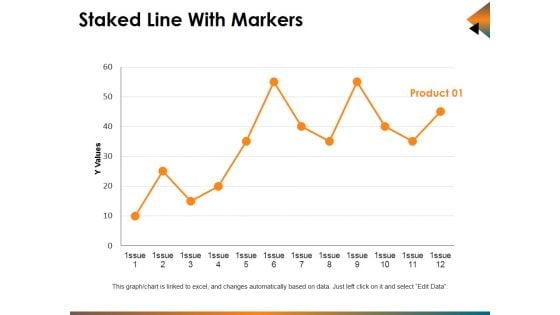
Staked Line With Markers Ppt PowerPoint Presentation Infographics Show
This is a staked line with markers ppt powerpoint presentation infographics show. This is a one stage process. The stages in this process are business, marketing, finance, line, analysis.
Stacked Line With Markers Ppt PowerPoint Presentation Icon Format
This is a stacked line with markers ppt powerpoint presentation icon format. This is a three stage process. The stages in this process are business, marketing, finance, line, graph.
Customer Lifetime Value Clv Ppt PowerPoint Presentation Icon Professional
This is a customer lifetime value clv ppt powerpoint presentation icon professional. This is a three stage process. The stages in this process are inactive nonprofit able, customer, active profitable customers, very active very profitable customers.
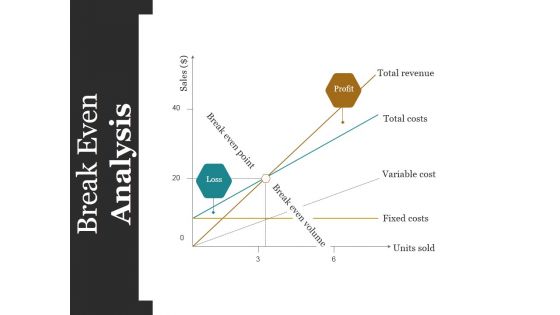
Break Even Analysis Ppt PowerPoint Presentation Inspiration Layouts
This is a break even analysis ppt powerpoint presentation inspiration layouts. This is a three stage process. The stages in this process are total revenue, total costs, variable cost, fixed costs, units sold.
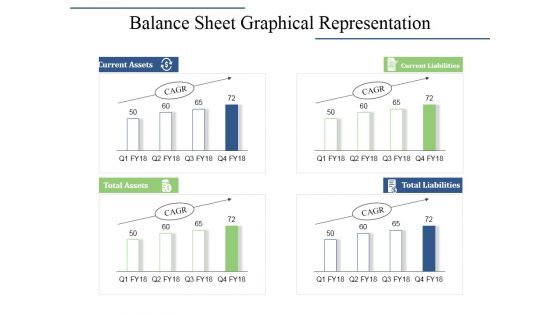
Balance Sheet Graphical Representation Ppt PowerPoint Presentation Inspiration Design Inspiration
This is a balance sheet graphical representation ppt powerpoint presentation inspiration design inspiration. This is a four stage process. The stages in this process are current assets, current liabilities, total assets, total liabilities.
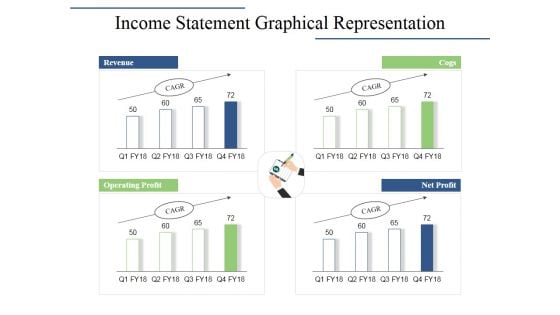
Income Statement Graphical Representation Ppt PowerPoint Presentation Infographics Layouts
This is a income statement graphical representation ppt powerpoint presentation infographics layouts. This is a four stage process. The stages in this process are revenue, cogs, operating profit, net profit.
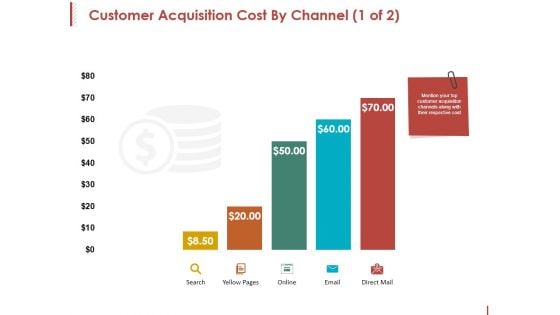
Customer Acquisition Cost By Channel Template 1 Ppt PowerPoint Presentation File Aids
This is a customer acquisition cost by channel template 1 ppt powerpoint presentation file aids. This is a five stage process. The stages in this process are search, yellow pages, online, email, direct mail.
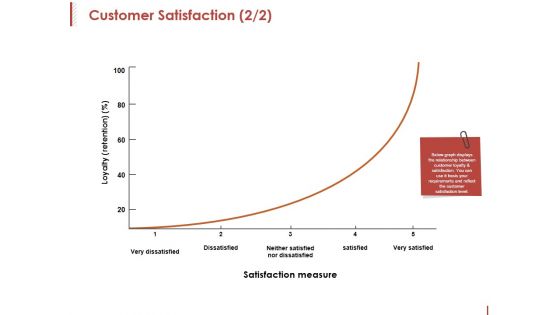
Customer Satisfaction Template 2 Ppt PowerPoint Presentation Slides Ideas
This is a customer satisfaction template 2 ppt powerpoint presentation slides ideas. This is a one stage process. The stages in this process are loyalty, satisfaction measure, dissatisfied, satisfied, very satisfied.
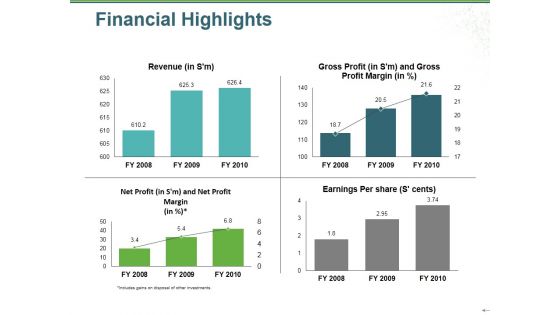
Financial Highlights Ppt PowerPoint Presentation Gallery Graphics Example
This is a financial highlights ppt powerpoint presentation gallery graphics example. This is a four stage process. The stages in this process are revenue, gross profit, net profit, earnings per share, bar graph.
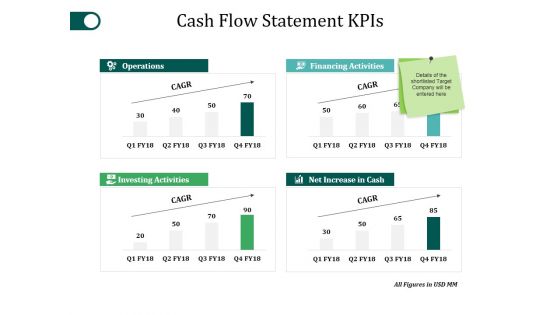
Cash Flow Statement Kpis Template 2 Ppt PowerPoint Presentation Summary Guidelines
This is a cash flow statement kpis template 2 ppt powerpoint presentation summary guidelines. This is a four stage process. The stages in this process are operations, investing activities, net increase in cash, financing activities.
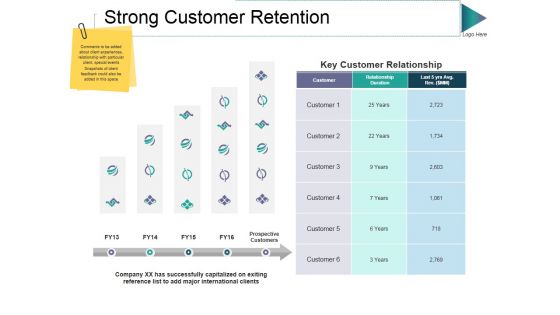
Strong Customer Retention Ppt PowerPoint Presentation Show Guide
This is a strong customer retention ppt powerpoint presentation show guide. This is a two stage process. The stages in this process are prospective customers, relationship duration, key customer relationship, prospective customers, customer.
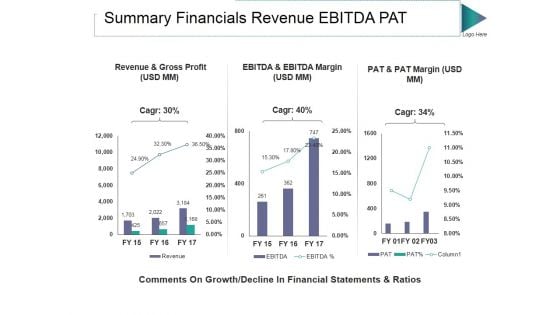
Summary Financials Revenue Ebitda Pat Ppt PowerPoint Presentation Visuals
This is a summary financials revenue ebitda pat ppt powerpoint presentation visuals. This is a three stage process. The stages in this process are revenue and gross profit, pat and pat margin, ebitda and ebitda margin.
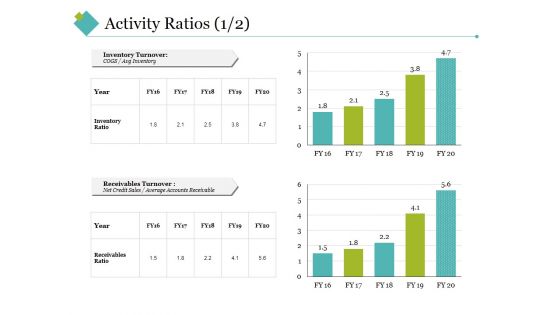
Activity Ratios Template 2 Ppt PowerPoint Presentation Show Images
This is a activity ratios template 2 ppt powerpoint presentation show images. This is a two stage process. The stages in this process are inventory turnover, receivables turnover, inventory ratio, receivables ratio, year.
Income Statement Overview Ppt PowerPoint Presentation Infographic Template Icon
This is a income statement overview ppt powerpoint presentation infographic template icon. This is a five stage process. The stages in this process are revenue, profit margin, operating profit margin.
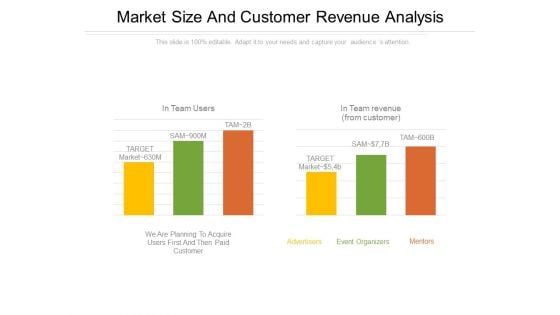
Market Size And Customer Revenue Analysis PowerPoint Presentation Examples
This is a market size and customer revenue analysis powerpoint presentation examples. This is a two stage process. The stages in this process are advertisers, mentors, event organizers, target, in team users.
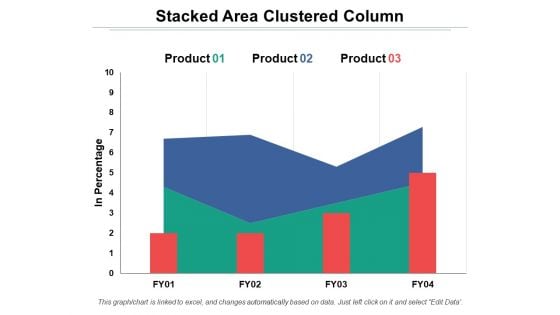
Stacked Area Clustered Column Ppt PowerPoint Presentation Professional Influencers
This is a stacked area clustered column ppt powerpoint presentation professional influencers. This is a three stage process. The stages in this process are stacked area clustered column, percentage, product, year.
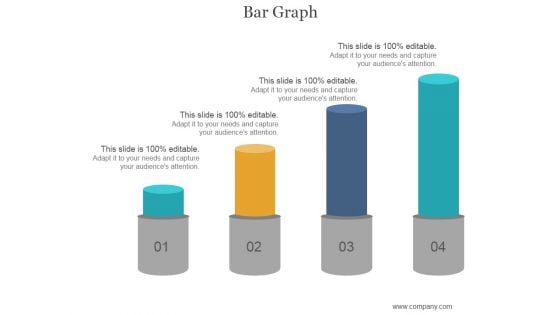
Bar Graph Ppt PowerPoint Presentation Slides
This is a bar graph ppt powerpoint presentation slides. This is a four stage process. The stages in this process are bar graph, business, management, marketing, success.
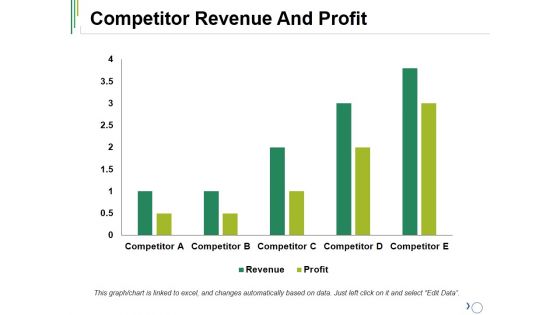
Competitor Revenue And Profit Ppt PowerPoint Presentation Layouts Vector
This is a competitor revenue and profit ppt powerpoint presentation layouts vector. This is a five stage process. The stages in this process are competitor, profit, revenue, bar graph, success.
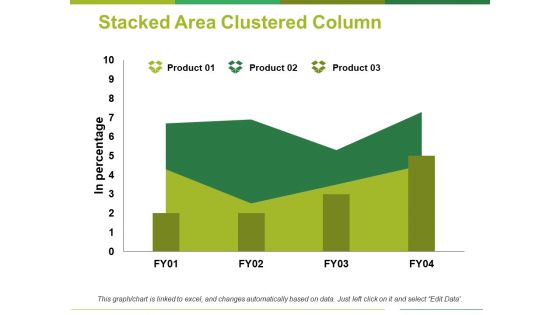
Stacked Area Clustered Column Ppt PowerPoint Presentation Professional Clipart
This is a stacked area clustered column ppt powerpoint presentation professional clipart. This is a three stage process. The stages in this process are product, in percentage, area chart.
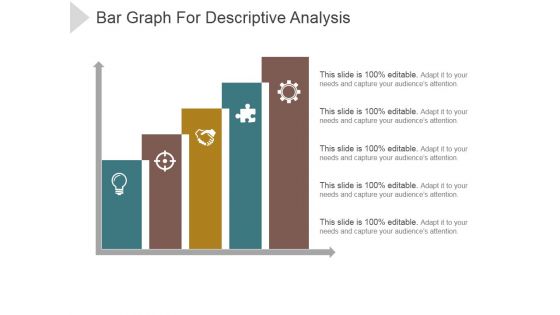
Bar Graph For Descriptive Analysis Ppt PowerPoint Presentation Shapes
This is a bar graph for descriptive analysis ppt powerpoint presentation shapes. This is a five stage process. The stages in this process are icons, business, marketing, management, process.
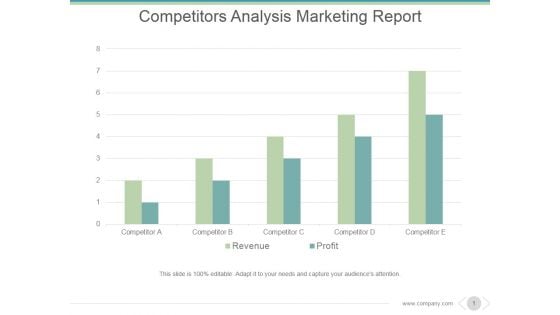
Competitors Analysis Marketing Report Ppt PowerPoint Presentation Tips
This is a competitors analysis marketing report ppt powerpoint presentation tips. This is a five stage process. The stages in this process are competitor, revenue, profit.
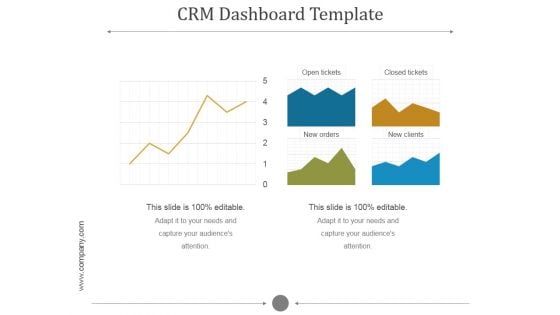
Crm Dashboard Template Ppt PowerPoint Presentation Designs
This is a crm dashboard template ppt powerpoint presentation designs. This is a five stage process. The stages in this process are open tickets, closed tickets, new orders, new clients.
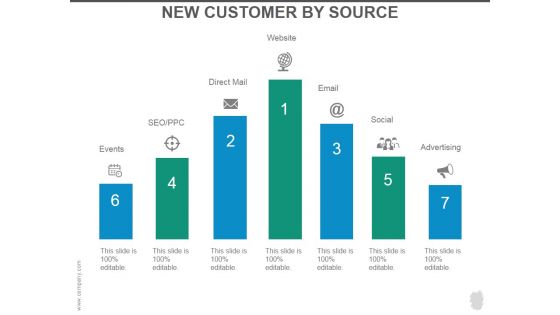
New Customer By Source Ppt PowerPoint Presentation Summary
This is a new customer by source ppt powerpoint presentation summary. This is a seven stage process. The stages in this process are events, direct mail, website, email, social.
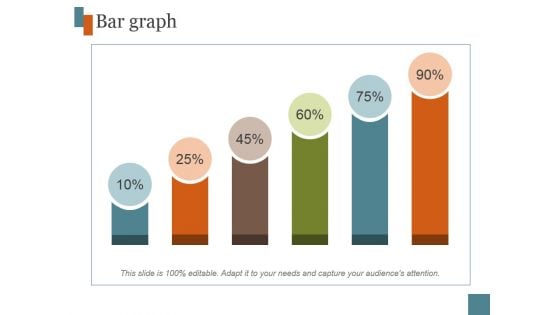
Bar Graph Ppt PowerPoint Presentation Template
This is a bar graph ppt powerpoint presentation template. This is a six stage process. The stages in this process are graph, business, marketing, finance.
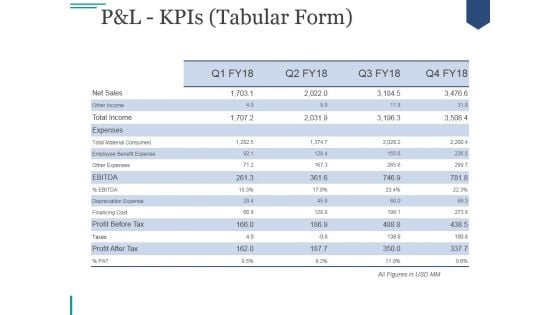
Pandl Kpis Tabular Form Ppt PowerPoint Presentation Visual Aids
This is a pandl kpis tabular form ppt powerpoint presentation visual aids. This is a four stage process. The stages in this process are revenue, cogs, operating profit, net profit.
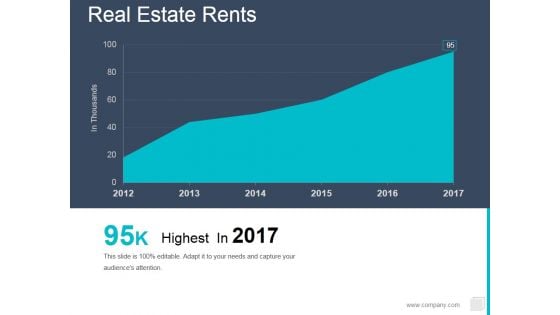
Real Estate Rents Ppt PowerPoint Presentation Inspiration Graphics Pictures
This is a real estate rents ppt powerpoint presentation inspiration graphics pictures. This is a six stage process. The stages in this process are management, graph, business.
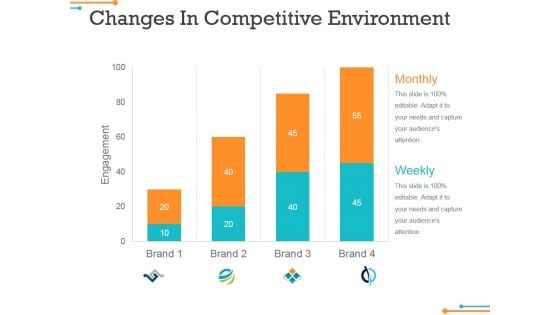
Changes In Competitive Environment Template 2 Ppt Powerpoint Presentation Gallery Guide
This is a changes in competitive environment template 2 ppt powerpoint presentation gallery guide. This is a four stage process. The stages in this process are monthly, weekly, brand, engagement.
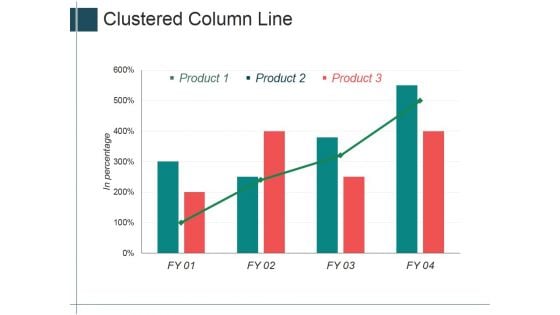
Clustered Column Line Ppt Powerpoint Presentation Ideas Inspiration
This is a clustered column line ppt powerpoint presentation ideas inspiration. This is a four stage process. The stages in this process are product, in percentage, graph, management, business.

Current State Analysis Financial Comparison Ppt Powerpoint Presentation File Graphic Tips
This is a current state analysis financial comparison ppt powerpoint presentation file graphic tips. This is a five stage process. The stages in this process are revenue, profits, cash balance.
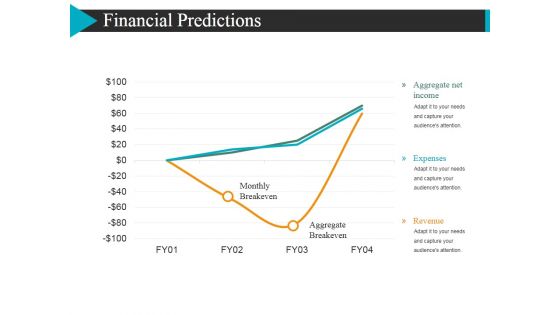
Financial Predictions Template 1 Ppt Powerpoint Presentation Portfolio Example Introduction
This is a financial predictions template 1 ppt powerpoint presentation portfolio example introduction. This is a three stage process. The stages in this process are monthly break even, aggregate net income, expenses.
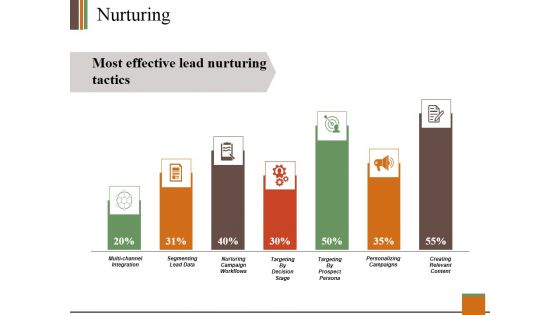
Nurturing Ppt PowerPoint Presentation Show Smartart
This is a nurturing ppt powerpoint presentation show smartart. This is a seven stage process. The stages in this process are segmenting lead data, personalizing campaigns, multi channel integration.
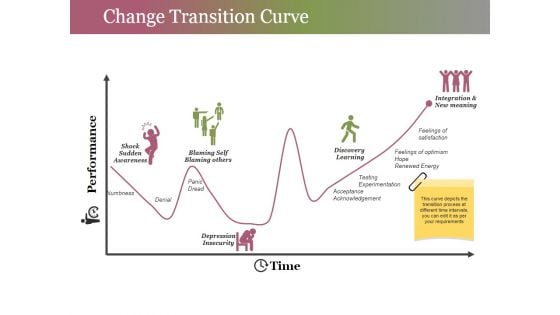
Change Transition Curve Ppt PowerPoint Presentation Gallery Graphics
This is a change transition curve ppt powerpoint presentation gallery graphics. This is a one stage process. The stages in this process are numbness, denial, panic, dread, time, performance.
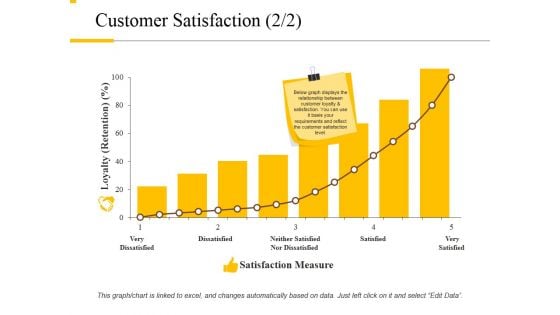
Customer Satisfaction Template 2 Ppt PowerPoint Presentation Professional Pictures
This is a customer satisfaction template 2 ppt powerpoint presentation professional pictures. This is a eight stage process. The stages in this process are loyalty, dissatisfied, satisfied, satisfaction measure, very satisfied.
Stacked Line With Markers Ppt PowerPoint Presentation Icon Themes
This is a stacked line with markers ppt powerpoint presentation icon themes. This is a one stage process. The stages in this process are product, in million, tasks, line graph, success.
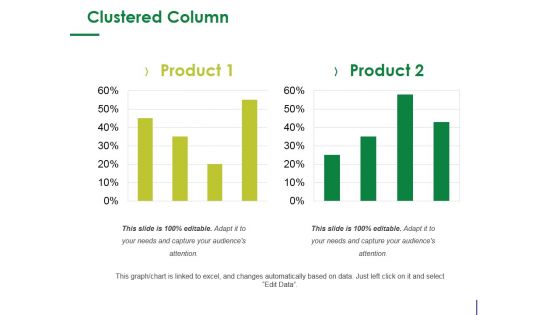
Clustered Column Ppt PowerPoint Presentation Ideas Show
This is a clustered column ppt powerpoint presentation ideas show. This is a two stage process. The stages in this process are product, percentage, finance, business, bar graph.
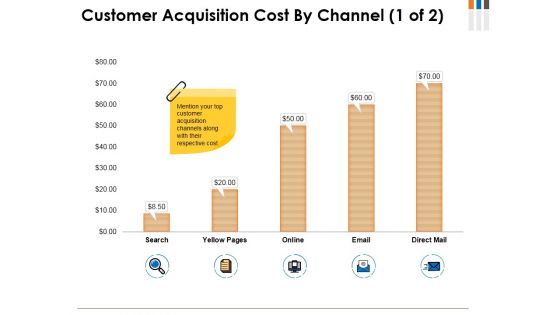
Customer Acquisition Cost By Channel Template 1 Ppt PowerPoint Presentation Model Inspiration
This is a customer acquisition cost by channel template 1 ppt powerpoint presentation model inspiration. This is a five stage process. The stages in this process are search, yellow pages, online, email, direct mail.
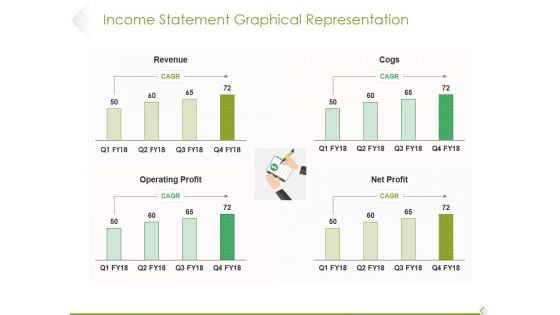
Income Statement Graphical Representation Ppt PowerPoint Presentation Infographic Template Influencers
This is a income statement graphical representation ppt powerpoint presentation infographic template influencers. This is a four stage process. The stages in this process are revenue, cogs, operating profit, profit.
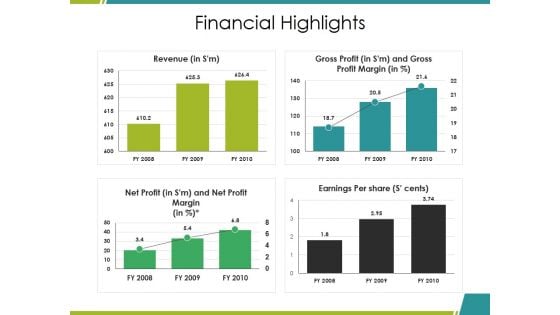
Financial Highlights Ppt PowerPoint Presentation Ideas Graphics Download
This is a financial highlights ppt powerpoint presentation ideas graphics download. This is a four stage process. The stages in this process are revenue, gross profit, net profit, earnings per share, bar graph.
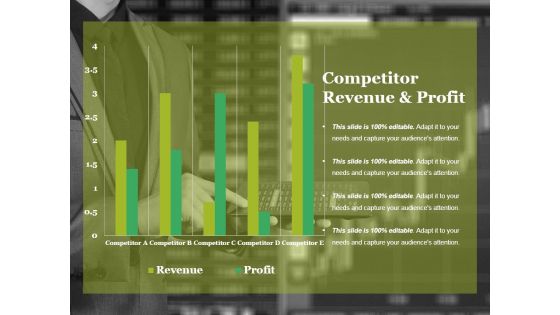
Competitor Revenue And Profit Ppt PowerPoint Presentation Model Templates
This is a competitor revenue and profit ppt powerpoint presentation model templates. This is a five stage process. The stages in this process are revenue, profit, competitor, bar graph, business.
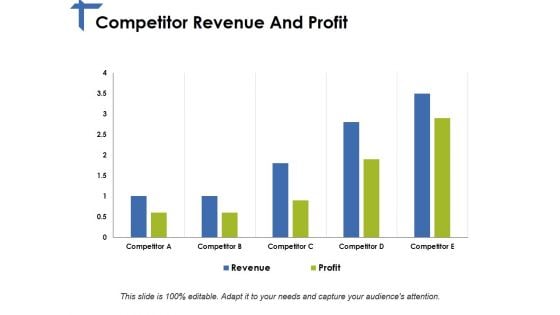
Competitor Revenue And Profit Ppt PowerPoint Presentation Pictures Good
This is a competitor revenue and profit ppt powerpoint presentation pictures good. This is a five stage process. The stages in this process are competitor, revenue, profit.


 Continue with Email

 Home
Home


