icons
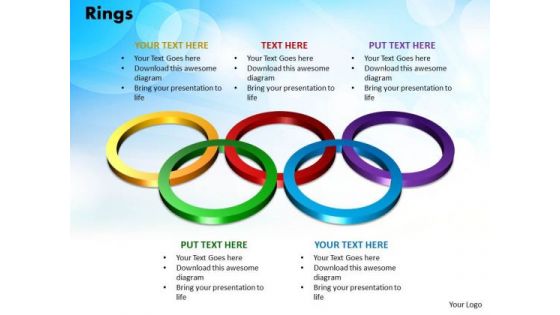
PowerPoint Process Rings Marketing Ppt Template
PowerPoint Process Rings Marketing PPT Template-This PowerPoint Diagram shows Olympic flag containing five interconnected rings on a white background. The five rings symbolize the five significant continents (Africa, the Americas, Asia, Australia and Europe) and are interconnected to symbolize the friendship to be gained from these international competitions.-PowerPoint Process Rings Marketing PPT Template Put your attributes on display with our PowerPoint Process Rings Marketing Ppt Template. They make any exhibition an excellent one.
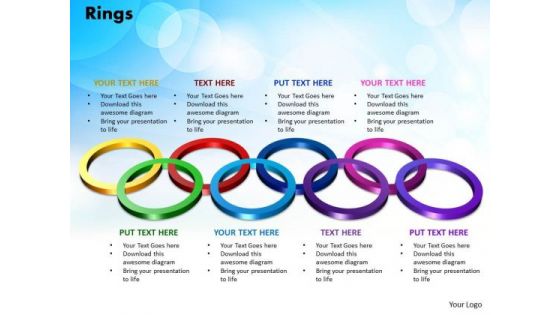
PowerPoint Slides Rings Process Ppt Template
PowerPoint Slides Rings Process PPT Template-Inspired by the indelible Olympic logo this graphic exemplifies the benefits of teamwork. Different people with differing ideas and priorities perform together to score. Hence this diagram has the unique ability to drive home your ideas and show how they mesh to guarantee success.-PowerPoint Slides Rings Process PPT Template Create a facilitative environment with our PowerPoint Slides Rings Process Ppt Template. Encourage definite action by your audience.
PowerPoint Template Pedestal Platform Graphic Ppt Slides
PowerPoint Template pedestal platform Graphic PPT Slides-The knowledge and understanding about how to respond to different situations is distributed across multiple people. Convey this messgae with this pedestal diagram..-PowerPoint Template pedestal platform Graphic PPT Slides-3d, Award, Best, Ceremony, Challenge, Champion, Chance, Competition, Concept, contest, Dais, Different, Final, Finish, First, Level, Light, Opportunity, Pedestal, Places, Platforms, Podium, Popular, Red, Reward, Sport, Success, Target, Victory, White, Win, Winners Complete your presentation with our PowerPoint Template Pedestal Platform Graphic Ppt Slides. Just download, type and present.
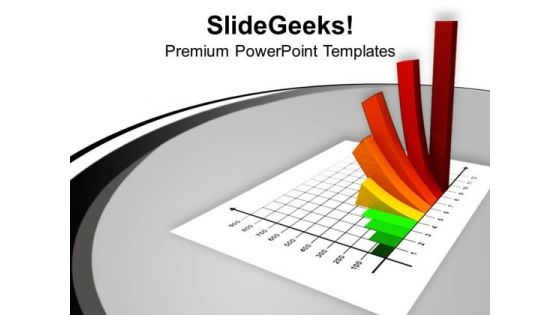
3d Chart Illustration Growth Business PowerPoint Templates Ppt Backgrounds For Slides 1112
We present our 3D Chart Illustration Growth Business PowerPoint Templates PPT Backgrounds For Slides 1112.Download our Business PowerPoint Templates because you have had a great year or so business wise. It is time to celebrate the efforts of your team. Download our Success PowerPoint Templates because they will Amplify your basic corporate concept and forefront the benefits of overlapping processes to arrive at common goals. Use our Marketing PowerPoint Templates because this Layout helps you to expand your plans to overcome obstacles and reassure the team that they shall continue to roll along merrily. Download our Finance PowerPoint Templates because you envisage some areas of difficulty in the near future. The overall financial situation could be a source of worry. Download and present our Shapes PowerPoint Templates because you can Set out the goals and your plan of action for teamwork.Use these PowerPoint slides for presentations relating to Bar chart illustraton growth, business, success, marketing, finance, shapes. The prominent colors used in the PowerPoint template are Yellow, Orange, Red. People tell us our 3D Chart Illustration Growth Business PowerPoint Templates PPT Backgrounds For Slides 1112 will help you be quick off the draw. Just enter your specific text and see your points hit home. Presenters tell us our growth PowerPoint templates and PPT Slides are Vintage. PowerPoint presentation experts tell us our 3D Chart Illustration Growth Business PowerPoint Templates PPT Backgrounds For Slides 1112 are Attractive. Customers tell us our shapes PowerPoint templates and PPT Slides are topically designed to provide an attractive backdrop to any subject. Customers tell us our 3D Chart Illustration Growth Business PowerPoint Templates PPT Backgrounds For Slides 1112 are Spiffy. Customers tell us our success PowerPoint templates and PPT Slides provide great value for your money. Be assured of finding the best projection to highlight your words. Extend an invitation with our 3d Chart Illustration Growth Business PowerPoint Templates Ppt Backgrounds For Slides 1112. Allow the audience into your thoughts.

Business Chart Coming Out Of Box Marketing PowerPoint Templates Ppt Backgrounds For Slides 1212
We present our Business Chart Coming Out Of Box Marketing PowerPoint Templates PPT Backgrounds For Slides 1212.Use our Marketing PowerPoint Templates because customer satisfaction is a mantra of the marketplace. Building a loyal client base is an essential element of your business. Use our Business PowerPoint Templates because this layout helps you to bring some important aspects of your business process to the notice of all concerned. Streamline the flow of information across the board. Download our Finance PowerPoint Templates because this helps you to comprehend your plan to get the entire act together. Download our Success PowerPoint Templates because the success of your venture depends on the performance of every team member. Download our Boxes PowerPoint Templates because you can Show them how to churn out fresh ideas.Use these PowerPoint slides for presentations relating to Business charts coming out of a box, Boxes, business, finance, marketing, success. The prominent colors used in the PowerPoint template are Red, Green, Blue. Customers tell us our Business Chart Coming Out Of Box Marketing PowerPoint Templates PPT Backgrounds For Slides 1212 are Perfect. Presenters tell us our Boxes PowerPoint templates and PPT Slides are Whimsical. Presenters tell us our Business Chart Coming Out Of Box Marketing PowerPoint Templates PPT Backgrounds For Slides 1212 are incredible easy to use. The feedback we get is that our of PowerPoint templates and PPT Slides are Tasteful. Use our Business Chart Coming Out Of Box Marketing PowerPoint Templates PPT Backgrounds For Slides 1212 are Breathtaking. You can be sure our box PowerPoint templates and PPT Slides effectively help you save your valuable time. Our Business Chart Coming Out Of Box Marketing PowerPoint Templates Ppt Backgrounds For Slides 1212 are like a deep breath. They ensure your ideas endure.
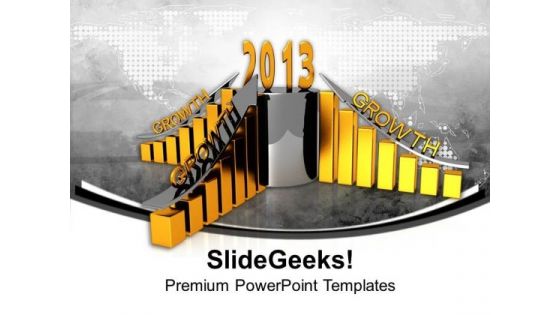
Bar Graphs 2013 Growth Flow Chart PowerPoint Templates Ppt Backgrounds For Slides 1212
We present our Bar Graphs 2013 Growth Flow Chart PowerPoint Templates PPT Backgrounds For Slides 1212.Download and present our Arrows PowerPoint Templates because it helps to inject your values into your group and see them bond to achieve success. Present our Process and flows PowerPoint Templates because this slide depicts the occasion for gifting and giving. Download and present our Marketing PowerPoint Templates because infrastructure growth is an obvious requirement of today.inform your group on how exactly this potential is tailor made for you. Present our Success PowerPoint Templates because iT outlines the entire thought process for the benefit of others. Tell it to the world with your characteristic aplomb. Download and present our Business PowerPoint Templates because this template helps you to grab the attention of your listeners.Use these PowerPoint slides for presentations relating to Year 2013 growth bar graphs chart, process and flows, arrows, marketing, business, success. The prominent colors used in the PowerPoint template are Yellow, Gray, Black. Professionals tell us our Bar Graphs 2013 Growth Flow Chart PowerPoint Templates PPT Backgrounds For Slides 1212 are specially created by a professional team with vast experience. They diligently strive to come up with the right vehicle for your brilliant Ideas. We assure you our bar PowerPoint templates and PPT Slides provide you with a vast range of viable options. Select the appropriate ones and just fill in your text. PowerPoint presentation experts tell us our Bar Graphs 2013 Growth Flow Chart PowerPoint Templates PPT Backgrounds For Slides 1212 are Elevated. Presenters tell us our process PowerPoint templates and PPT Slides are Pleasant. The feedback we get is that our Bar Graphs 2013 Growth Flow Chart PowerPoint Templates PPT Backgrounds For Slides 1212 are Endearing. You can be sure our bar PowerPoint templates and PPT Slides are Royal. Be a change agent with our Bar Graphs 2013 Growth Flow Chart PowerPoint Templates Ppt Backgrounds For Slides 1212. They will make you look good.
Colorful Pie Chart Business Sales PowerPoint Templates Ppt Backgrounds For Slides 0113
We present our Colorful Pie Chart Business Sales PowerPoint Templates PPT Backgrounds For Slides 0113.Download our Marketing PowerPoint Templates because Our PowerPoint Templates and Slides will bullet point your ideas. See them fall into place one by one. Download and present our Finance PowerPoint Templates because Our PowerPoint Templates and Slides will help you be quick off the draw. Just enter your specific text and see your points hit home. Download our Success PowerPoint Templates because You canTake a leap off the starting blocks with our PowerPoint Templates and Slides. They will put you ahead of the competition in quick time. Download and present our Competiton PowerPoint Templates because Our PowerPoint Templates and Slides are designed to help you succeed. They have all the ingredients you need. Download our Business PowerPoint Templates because Our PowerPoint Templates and Slides are effectively colour coded to prioritise your plans They automatically highlight the sequence of events you desire.Use these PowerPoint slides for presentations relating to Pie chart, finance, competition, marketing, business, success. The prominent colors used in the PowerPoint template are Red, Blue, Green. Customers tell us our Colorful Pie Chart Business Sales PowerPoint Templates PPT Backgrounds For Slides 0113 will help them to explain complicated concepts. PowerPoint presentation experts tell us our success PowerPoint templates and PPT Slides are designed by a team of presentation professionals. You can be sure our Colorful Pie Chart Business Sales PowerPoint Templates PPT Backgrounds For Slides 0113 are designed by professionals Customers tell us our PowerPoint templates and PPT Slides are readymade to fit into any presentation structure. Professionals tell us our Colorful Pie Chart Business Sales PowerPoint Templates PPT Backgrounds For Slides 0113 have awesome images to get your point across. You can be sure our business PowerPoint templates and PPT Slides are readymade to fit into any presentation structure. Get it right each and every time. Our Colorful Pie Chart Business Sales PowerPoint Templates Ppt Backgrounds For Slides 0113 have a great record of hits.

Losers And Gainers Chart Business PowerPoint Templates Ppt Backgrounds For Slides 0113
We present our Losers And Gainers Chart Business PowerPoint Templates PPT Backgrounds For Slides 0113.Use our Finance PowerPoint Templates because Our PowerPoint Templates and Slides are created with admirable insight. Use them and give your group a sense of your logical mind. Use our Marketing PowerPoint Templates because Our PowerPoint Templates and Slides will let you Clearly mark the path for others to follow. Download and present our Arrows PowerPoint Templates because Our PowerPoint Templates and Slides will bullet point your ideas. See them fall into place one by one. Download and present our Signs PowerPoint Templates because Our PowerPoint Templates and Slides will let Your superior ideas hit the target always and everytime. Use our Business PowerPoint Templates because It will Strengthen your hand with your thoughts. They have all the aces you need to win the day.Use these PowerPoint slides for presentations relating to Stock market Losers and Gainers chart arrows, finance, business, arrows, signs, marketing. The prominent colors used in the PowerPoint template are Yellow, Blue, Black. PowerPoint presentation experts tell us our Losers And Gainers Chart Business PowerPoint Templates PPT Backgrounds For Slides 0113 are designed by professionals PowerPoint presentation experts tell us our business PowerPoint templates and PPT Slides are visually appealing. You can be sure our Losers And Gainers Chart Business PowerPoint Templates PPT Backgrounds For Slides 0113 are effectively colour coded to prioritise your plans They automatically highlight the sequence of events you desire. PowerPoint presentation experts tell us our and PowerPoint templates and PPT Slides help you meet deadlines which are an element of today's workplace. Just browse and pick the slides that appeal to your intuitive senses. Presenters tell us our Losers And Gainers Chart Business PowerPoint Templates PPT Backgrounds For Slides 0113 are second to none. PowerPoint presentation experts tell us our finance PowerPoint templates and PPT Slides are designed to make your presentations professional. Have faith,will succeed. Have our Losers And Gainers Chart Business PowerPoint Templates Ppt Backgrounds For Slides 0113,remove all doubt.
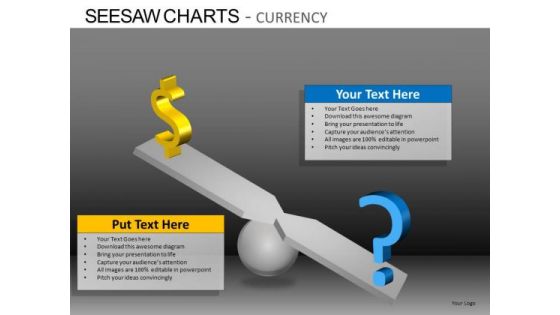
PowerPoint Design Slides Executive Success Seesaw Charts Currency Ppt Ppt Slide
PowerPoint Design Slides Executive Success Seesaw Charts Currency PPT PPT Slide-These high quality powerpoint pre-designed slides and powerpoint templates have been carefully created by our professional team to help you impress your audience. All slides have been created and are 100% editable in powerpoint. Each and every property of any graphic - color, size, orientation, shading, outline etc. can be modified to help you build an effective powerpoint presentation. Any text can be entered at any point in the powerpoint template or slide. Simply DOWNLOAD, TYPE and PRESENT! Achieve strong & sustainable productivity gains with our PowerPoint Design Slides Executive Success Seesaw Charts Currency Ppt Ppt Slide. They will make you look good.

Business Presentation Shows Financial Chart Of Year PowerPoint Templates Ppt Backgrounds For Slides
Our Business Presentation Shows Financial Chart Of Year PowerPoint Templates PPT Backgrounds For Slides help in a duel of wits. They get your ideas to come out on top. Our finance PowerPoint Templates play a dual role. They aid and abet you in your endeavour. Win any duel with our business PowerPoint Templates. Your thoughts will be faster on the draw. Do not let fallacious arguments sway your team. Embed the facts in their minds with our Business Presentation Shows Financial Chart Of Year PowerPoint Templates Ppt Backgrounds For Slides .

Business Presentation Shows Financial Chart PowerPoint Templates Ppt Backgrounds For Slides 0513
Our Business Presentation Shows Financial Chart PowerPoint Templates PPT Backgrounds For Slides help in a duel of wits. They get your ideas to come out on top. Our finance PowerPoint Templates play a dual role. They aid and abet you in your endeavour. Win any duel with our business PowerPoint Templates. Your thoughts will be faster on the draw. Our Business Presentation Shows Financial Chart PowerPoint Templates Ppt Backgrounds For Slides 0513 save time creating a mind blowing presentation. With our money back guarantee you have nothing to lose.
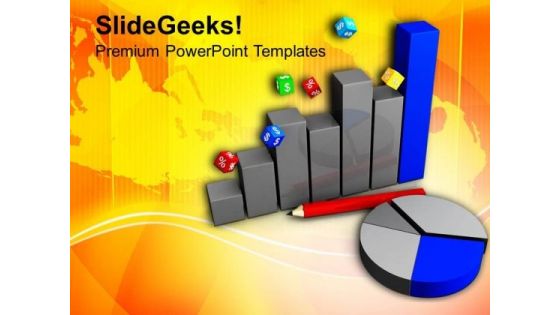
Read The Pie And Bar Chart PowerPoint Templates Ppt Backgrounds For Slides 0713
Your approach is truly down to earth. Our practical Read The Pie And Bar Chart PowerPoint Templates PPT Backgrounds For Slides are apt for you. Draft it out on our Process and Flows PowerPoint Templates. Give the final touches with your ideas. Get a baker's dozen with our Cubes PowerPoint Templates. Recieve that little bit more than expected. Present like a director with our Read The Pie And Bar Chart PowerPoint Templates Ppt Backgrounds For Slides 0713. Make sure your presentation gets the attention it deserves.
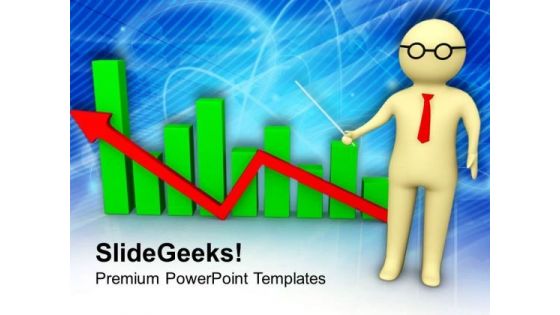
Man With Business Chart PowerPoint Templates Ppt Backgrounds For Slides 0713
Our Man With Business Chart PowerPoint Templates PPT Backgrounds For Slides allow you to do it with ease. Just like picking the low hanging fruit. Boil the ocean with your thoughts. Our Marketing PowerPoint Templates will help create waves. Make some dough with our Arrows PowerPoint Templates. Your assets will rise significantly. Your audience will love what they are looking at. Impress them with our Man With Business Chart PowerPoint Templates Ppt Backgrounds For Slides 0713. You will be at the top of your game.
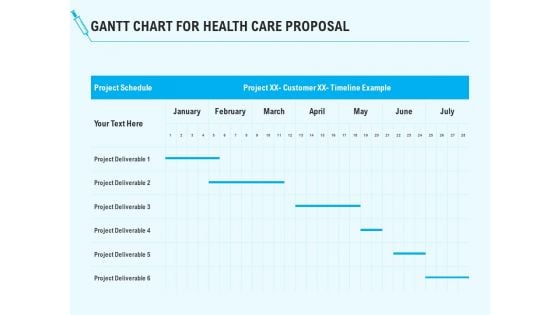
Health Care Gantt Chart For Health Care Proposal Ppt Infographic Template Topics PDF
Elucidate your project plan using our health care gantt chart for health care proposal ppt infographic template topics pdf. Capture the timeframe for every release by outlining crucial details like project beginning and end date, status, and assigned team. Establish coordination with other team members share your product plans, and discuss the project progress with the executives - using this template. Furthermore, this task management chart helps you align your activities efficiently. Utilize the versatile nature of this template to initiate high-level resource planning and implement it flexibly for the benefit of your business. The slide is easy-to-edit so download it and schedule your projects resourcefully.
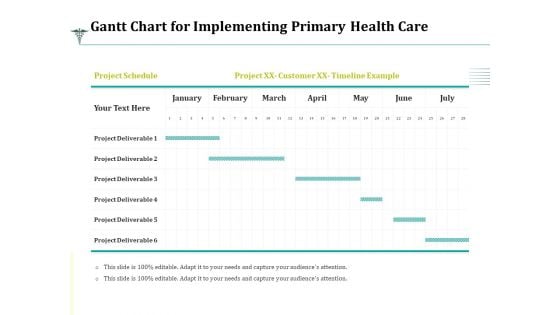
Gantt Chart For Implementing Primary Health Care Ppt Professional Graphics Design PDF
Elucidate your project plan using our gantt chart for implementing primary health care ppt professional graphics design pdf. Capture the timeframe for every release by outlining crucial details like project beginning and end date, status, and assigned team. Establish coordination with other team members share your product plans, and discuss the project progress with the executives - using this template. Furthermore, this task management chart helps you align your activities efficiently. Utilize the versatile nature of this template to initiate high-level resource planning and implement it flexibly for the benefit of your business. The slide is easy-to-edit so download it and schedule your projects resourcefully.
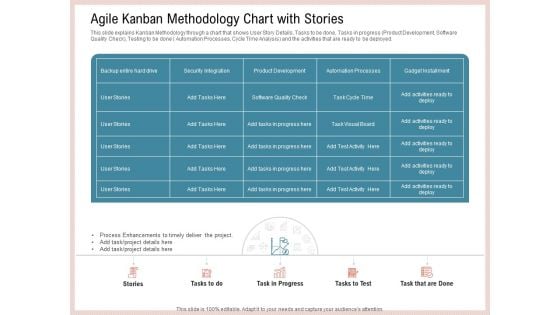
Agile Model Improve Task Team Performance Agile Kanban Methodology Chart With Stories Guidelines PDF
This slide explains Kanban Methodology through a chart that shows User Story Details, Tasks to be done, Tasks in progress Product Development, Software Quality Check, Testing to be done Automation Processes, Cycle Time Analysis and the activities that are ready to be deployed. Deliver an awe inspiring pitch with this creative agile model improve task team performance agile kanban methodology chart with stories guidelines pdf bundle. Topics like security integration, product development, automation processes can be discussed with this completely editable template. It is available for immediate download depending on the needs and requirements of the user.
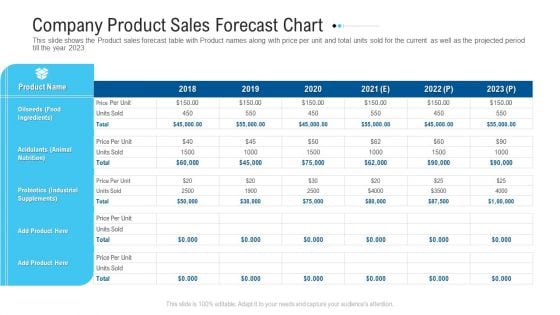
Funding Deck To Raise Grant Funds From Public Organizations Company Product Sales Forecast Chart Demonstration PDF
This slide shows the Product sales forecast table with Product names along with price per unit and total units sold for the current as well as the projected period till the year 2023. Deliver and pitch your topic in the best possible manner with this funding deck to raise grant funds from public organizations company product sales forecast chart demonstration pdf. Use them to share invaluable insights on company product sales forecast chart, 2018 to 2023 and impress your audience. This template can be altered and modified as per your expectations. So, grab it now.
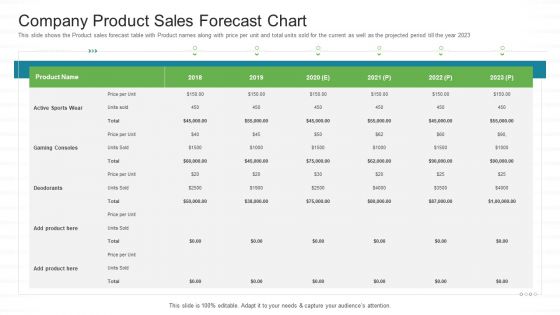
Investor Pitch Stock Market Launch Financial Institutions Company Product Sales Forecast Chart Summary PDF
This slide shows the Product sales forecast table with Product names along with price per unit and total units sold for the current as well as the projected period till the year 2023. Deliver an awe inspiring pitch with this creative investor pitch stock market launch financial institutions company product sales forecast chart summary pdf bundle. Topics like company product sales forecast chart can be discussed with this completely editable template. It is available for immediate download depending on the needs and requirements of the user.
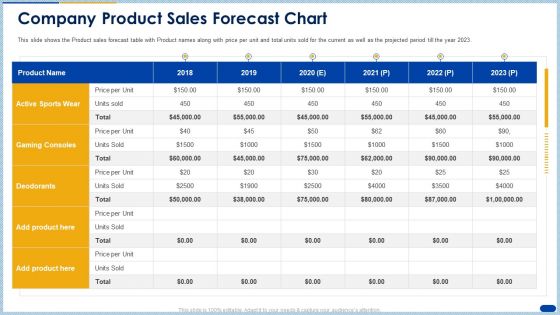
Raising Capital Banking Organizations Post Initial Public Offering Company Product Sales Forecast Chart Professional PDF
This slide shows the Product sales forecast table with Product names along with price per unit and total units sold for the current as well as the projected period till the year 2023. Deliver an awe inspiring pitch with this creative raising capital banking organizations post initial public offering company product sales forecast chart professional pdf bundle. Topics like company product sales forecast chart can be discussed with this completely editable template. It is available for immediate download depending on the needs and requirements of the user.
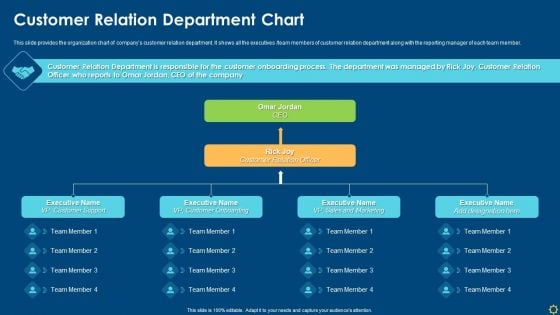
Improving Organizational Process Client Induction Procedure Customer Relation Department Chart Template PDF
This slide provides the organization chart of companys customer relation department. It shows all the executives team members of customer relation department along with the reporting manager of each team member. Presenting improving organizational process client induction procedure customer relation department chart template pdf to provide visual cues and insights. Share and navigate important information on four stages that need your due attention. This template can be used to pitch topics like customer onboarding, customer relation, sales and marketing. In addtion, this PPT design contains high resolution images, graphics, etc, that are easily editable and available for immediate download.

Project Planning Gannt Chart With Tasks And Time Duration Microsoft PDF
This slide shows a Gannt Chart with the activities and tasks related to project planning along with task duration in days, tasks start date, task end date and project task scheduling timeline. Deliver and pitch your topic in the best possible manner with this project planning gannt chart with tasks and time duration microsoft pdf. Use them to share invaluable insights on business, management, resource plans, success factors and impress your audience. This template can be altered and modified as per your expectations. So, grab it now.
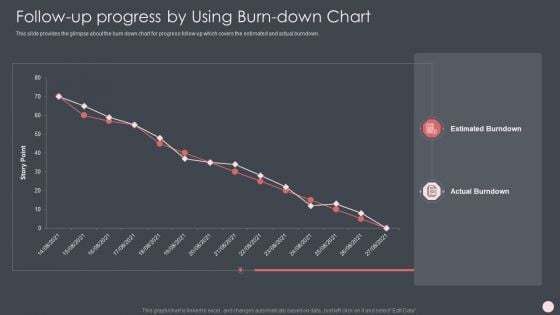
Agile Software Development Process It Follow Up Progress By Using Burn-Down Chart Mockup PDF
This slide provides the glimpse about the next sprint planning and tracking which focuses on task name, owner, estimated time and planned or actual estimation along with a daily calendar. Deliver an awe inspiring pitch with this creative agile software development process it follow up progress by using burn-down chart mockup pdf bundle. Topics like follow up progress by using burn down chart can be discussed with this completely editable template. It is available for immediate download depending on the needs and requirements of the user.
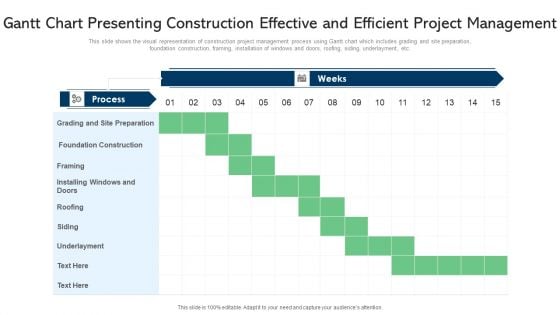
Gantt Chart Presenting Construction Effective And Efficient Project Management Ppt PowerPoint Presentation Gallery Deck PDF
This slide shows the visual representation of construction project management process using Gantt chart which includes grading and site preparation, foundation construction, framing, installation of windows and doors, roofing, siding, underlayment, etc. Showcasing this set of slides titled gantt chart presenting construction effective and efficient project management ppt powerpoint presentation gallery deck pdf. The topics addressed in these templates are process, site preparation, framing. All the content presented in this PPT design is completely editable. Download it and make adjustments in color, background, font etc. as per your unique business setting.
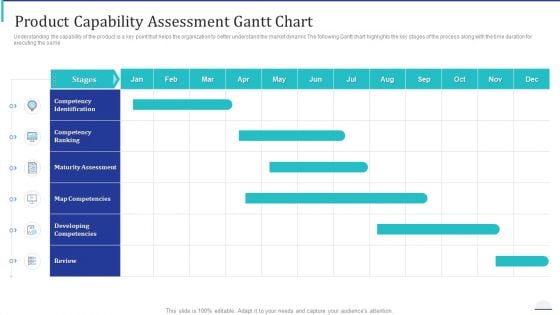
How Make Impactful Product Marketing Message Build Product Differentiation Product Capability Assessment Gantt Chart Designs PDF
Understanding the capability of the product is a key point that helps the organization to better understand the market dynamic The following Gantt chart highlights the key stages of the process along with the time duration for executing the same. Deliver and pitch your topic in the best possible manner with this how make impactful product marketing message build product differentiation product capability assessment gantt chart designs pdf. Use them to share invaluable insights on competency identification, competency ranking, maturity assessment, map competencies, developing competencies and impress your audience. This template can be altered and modified as per your expectations. So, grab it now.
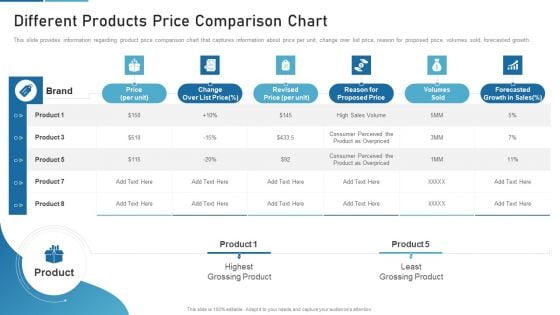
Sales Process Catalogue Template Different Products Price Comparison Chart Designs PDF
This slide provides information regarding product price comparison chart that captures information about price per unit, change over list price, reason for proposed price, volumes sold, forecasted growth. Deliver an awe inspiring pitch with this creative sales process catalogue template different products price comparison chart designs pdf bundle. Topics like revised price, reason for proposed price, volumes sold, price, change over list price, forecasted growth in sales can be discussed with this completely editable template. It is available for immediate download depending on the needs and requirements of the user.
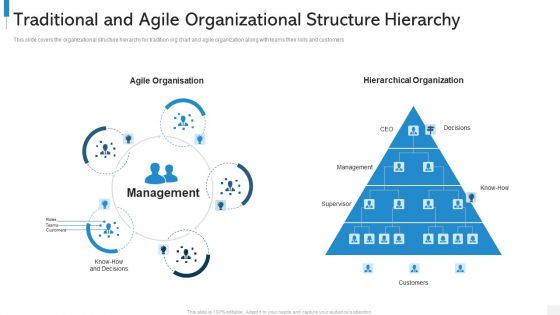
Agile Org Chart It Traditional And Agile Organizational Structure Hierarchy Microsoft PDF
This slide covers the organizational structure hierarchy for tradition org chart and agile organization along with teams their rolls and customers Presenting agile org chart it traditional and agile organizational structure hierarchy microsoft pdf to provide visual cues and insights. Share and navigate important information on five stages that need your due attention. This template can be used to pitch topics like agile organisation, management, hierarchical organization. In addtion, this PPT design contains high resolution images, graphics, etc, that are easily editable and available for immediate download.
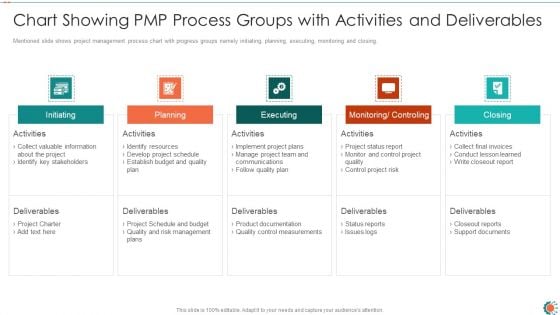
Chart Showing PMP Process Groups With Activities And Deliverables Ppt Pictures Gallery PDF
Mentioned slide shows project management process chart with progress groups namely initiating, planning, executing, monitoring and closing. This is a chart showing pmp process groups with activities and deliverables ppt pictures gallery pdf template with various stages. Focus and dispense information on five stages using this creative set, that comes with editable features. It contains large content boxes to add your information on topics like information, project, stakeholders. You can also showcase facts, figures, and other relevant content using this PPT layout. Grab it now.
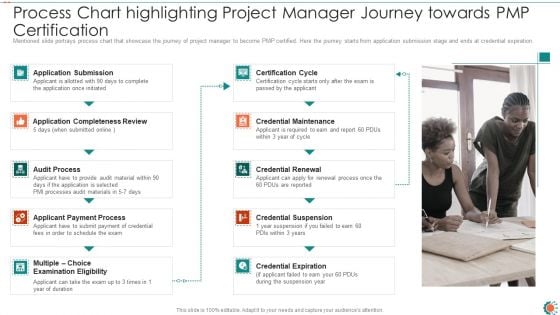
Process Chart Highlighting Project Manager Journey Towards PMP Certification Ppt Portfolio Guidelines PDF
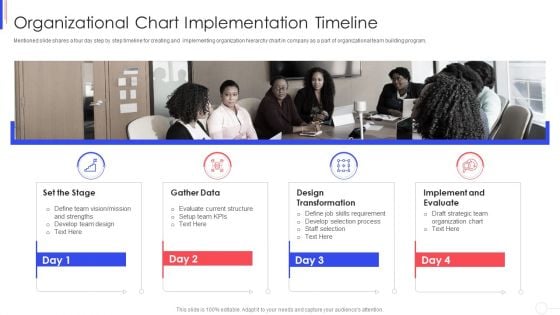
Strategy To Improve Team Proficiency Organizational Chart Implementation Timeline Slides PDF
Mentioned slide shares a four day step by step timeline for creating and implementing organization hierarchy chart in company as a part of organizational team building program. Presenting strategy to improve team proficiency organizational chart implementation timeline slides pdf to provide visual cues and insights. Share and navigate important information on four stages that need your due attention. This template can be used to pitch topics like team, strengths, develop, structure, evaluate. In addtion, this PPT design contains high resolution images, graphics, etc, that are easily editable and available for immediate download.
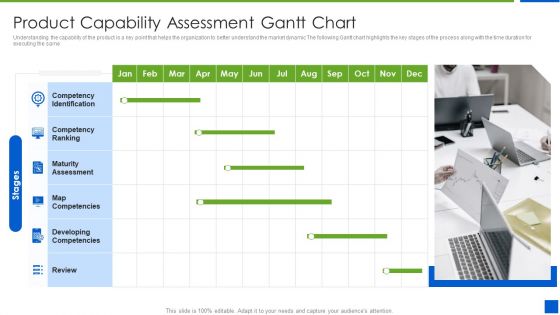
Improving Brand Recognition With Message And Differentiation Strategy Product Capability Assessment Gantt Chart Slides PDF
Understanding the capability of the product is a key point that helps the organization to better understand the market dynamic The following Gantt chart highlights the key stages of the process along with the time duration for executing the same This is a improving brand recognition with message and differentiation strategy product capability assessment gantt chart slides pdf template with various stages. Focus and dispense information on six stages using this creative set, that comes with editable features. It contains large content boxes to add your information on topics like competency, identification, developing, assessment . You can also showcase facts, figures, and other relevant content using this PPT layout. Grab it now.
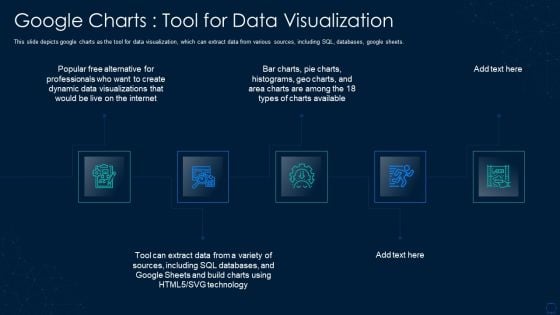
Graphical Representation Of Research IT Google Charts Tool For Data Visualization Introduction PDF
This slide depicts google charts as the tool for data visualization, which can extract data from various sources, including SQL, databases, google sheets. This is a graphical representation of research it google charts tool for data visualization introduction pdf template with various stages. Focus and dispense information on five stages using this creative set, that comes with editable features. It contains large content boxes to add your information on topics like dynamic, databases, sources, technology. You can also showcase facts, figures, and other relevant content using this PPT layout. Grab it now.
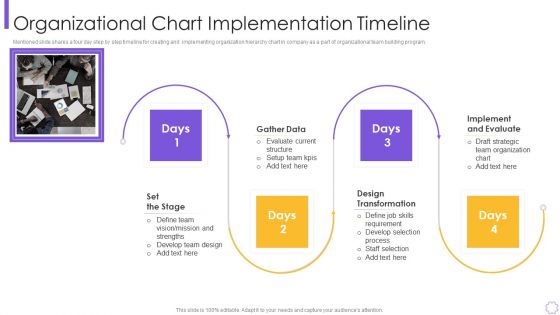
Organizational Program To Improve Team Productivity And Efficiency Organizational Chart Introduction PDF
Mentioned slide shares a four day step by step timeline for creating and implementing organization hierarchy chart in company as a part of organizational team building program.Presenting organizational program to improve team productivity and efficiency organizational chart introduction pdf to provide visual cues and insights. Share and navigate important information on four stages that need your due attention. This template can be used to pitch topics like gather data implement and evaluate, design transformation In addtion, this PPT design contains high resolution images, graphics, etc, that are easily editable and available for immediate download.
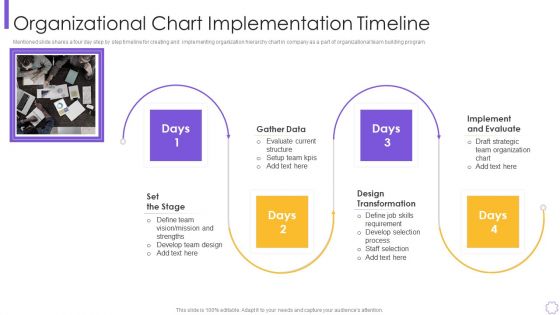
Process Optimization Through Product Life Process Management Techniques Organizational Chart Topics PDF
Mentioned slide shares a four day step by step timeline for creating and implementing organization hierarchy chart in company as a part of organizational team building program.This is a process optimization through product life process management techniques organizational chart topics pdf template with various stages. Focus and dispense information on four stages using this creative set, that comes with editable features. It contains large content boxes to add your information on topics like design transformation, implement and evaluate, gather data You can also showcase facts, figures, and other relevant content using this PPT layout. Grab it now.
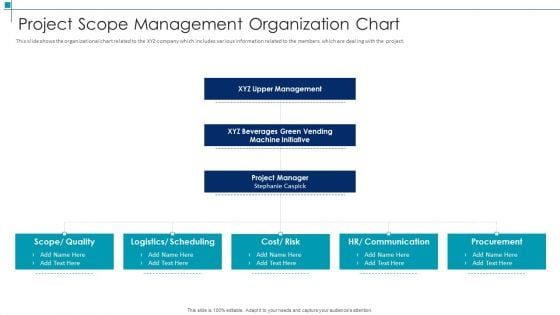
Project Scope Management Deliverables Project Scope Management Organization Chart Formats PDF
This slide shows the organizational chart related to the XYZ company which includes various information related to the members which are dealing with the project. Presenting project scope management deliverables project scope management organization chart formats pdf to provide visual cues and insights. Share and navigate important information on three stages that need your due attention. This template can be used to pitch topics like quality, scheduling, risk, cost, communication. In addtion, this PPT design contains high resolution images, graphics, etc, that are easily editable and available for immediate download.
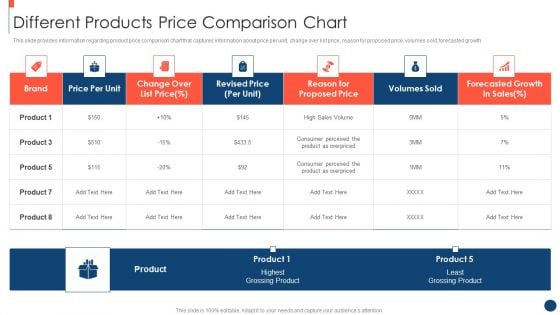
Key Practices To Create Sales Playbook Different Products Price Comparison Chart Designs PDF
This slide provides information regarding product price comparison chart that captures information about price per unit, change over list price, reason for proposed price, volumes sold, forecasted growth. Deliver and pitch your topic in the best possible manner with this key practices to create sales playbook different products price comparison chart designs pdf Use them to share invaluable insights on progress evaluation, updates on program, discussion regarding and impress your audience. This template can be altered and modified as per your expectations. So, grab it now.
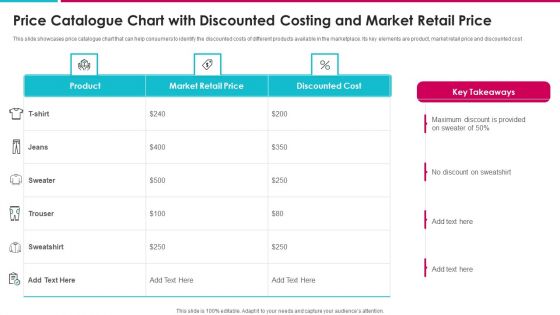
Price Catalogue Chart With Discounted Costing And Market Retail Price Information PDF
This slide showcases price catalogue chart that can help consumers to identify the discounted costs of different products available in the marketplace. Its key elements are product, market retail price and discounted cost Pitch your topic with ease and precision using this price catalogue chart with discounted costing and market retail price information pdf. This layout presents information on product, market retail price, discounted cost . It is also available for immediate download and adjustment. So, changes can be made in the color, design, graphics or any other component to create a unique layout.
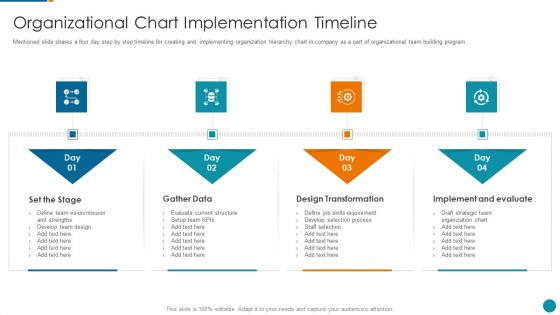
Strategic Procedure To Improve Employee Efficiency Organizational Chart Implementation Timeline Inspiration PDF
Mentioned slide shares a four day step by step timeline for creating and implementing organization hierarchy chart in company as a part of organizational team building program.Presenting strategic procedure to improve employee efficiency organizational chart implementation timeline inspiration pdf to provide visual cues and insights. Share and navigate important information on four stages that need your due attention. This template can be used to pitch topics like design transformation, implement and evaluate, skills requirement In addtion, this PPT design contains high resolution images, graphics, etc, that are easily editable and available for immediate download.
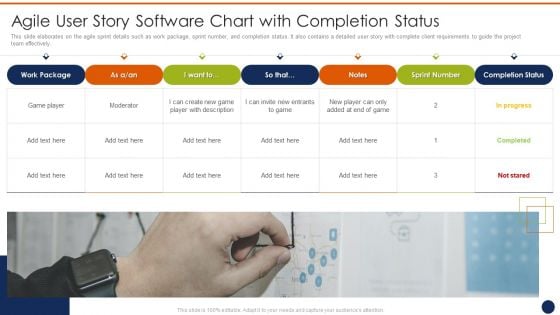
Agile User Story Software Chart With Completion Status Ppt File Example Topics PDF
This slide elaborates on the agile sprint details such as work package, sprint number, and completion status. It also contains a detailed user story with complete client requirements to guide the project team effectively. Presenting agile user story software chart with completion status ppt file example topics pdf to provide visual cues and insights. Share and navigate important information on one stages that need your due attention. This template can be used to pitch topics like agile user story software chart with completion status. In addtion, this PPT design contains high resolution images, graphics, etc, that are easily editable and available for immediate download.
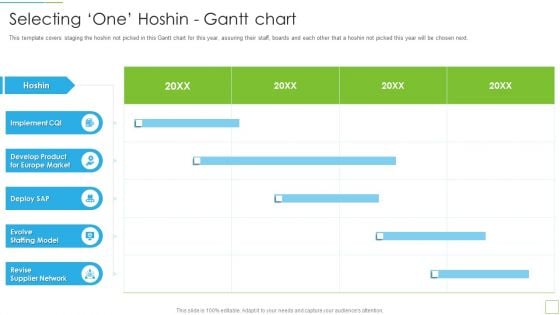
Hoshin Kanri Pitch Deck Selecting One Hoshin Gantt Chart Guidelines PDF
This template covers staging the hoshin not picked in this Gantt chart for this year, assuring their staff, boards and each other that a hoshin not picked this year will be chosen next.Deliver an awe inspiring pitch with this creative hoshin kanri pitch deck selecting one hoshin gantt chart guidelines pdf bundle. Topics like evolve staffing model, revise supplier network, develop product can be discussed with this completely editable template. It is available for immediate download depending on the needs and requirements of the user.
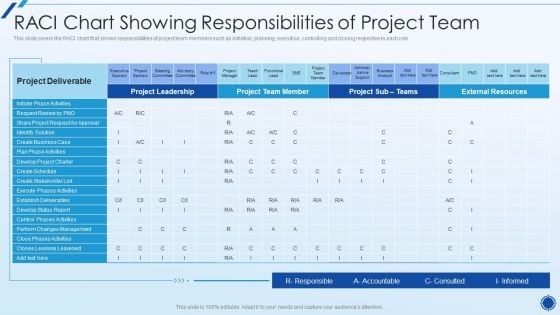
Organizing Action Plan For Successful Project Management RACI Chart Showing Responsibilities Of Project Team Portrait PDF
This slide covers the RACI chart that shows responsibilities of project team members such as initiation, planning, execution, controlling and closing respective to each role.Deliver and pitch your topic in the best possible manner with this organizing action plan for successful project management raci chart showing responsibilities of project team portrait pdf Use them to share invaluable insights on request review, create business case, establish deliverables and impress your audience. This template can be altered and modified as per your expectations. So, grab it now.
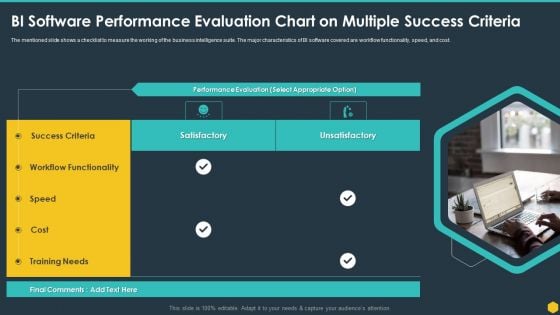
BI Software Performance Evaluation Chart On Multiple Success Criteria BI Transformation Toolset Ideas PDF
The mentioned slide shows a checklist to measure the working of the business intelligence suite. The major characteristics of BI software covered are workflow functionality, speed, and cost. This is a BI Software Performance Evaluation Chart On Multiple Success Criteria BI Transformation Toolset Ideas PDF template with various stages. Focus and dispense information on one stages using this creative set, that comes with editable features. It contains large content boxes to add your information on topics like BI Software Performance Evaluation Chart On Multiple Success Criteria. You can also showcase facts, figures, and other relevant content using this PPT layout. Grab it now.
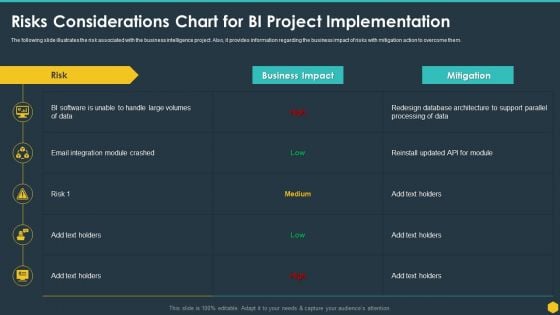
Risks Considerations Chart For BI Project Implementation BI Transformation Toolset Professional PDF
The following slide illustrates the risk associated with the business intelligence project. Also, it provides information regarding the business impact of risks with mitigation action to overcome them. Deliver and pitch your topic in the best possible manner with this Risks Considerations Chart For BI Project Implementation BI Transformation Toolset Professional PDF. Use them to share invaluable insights on Risks Considerations Chart For Bi Project Implementation and impress your audience. This template can be altered and modified as per your expectations. So, grab it now.
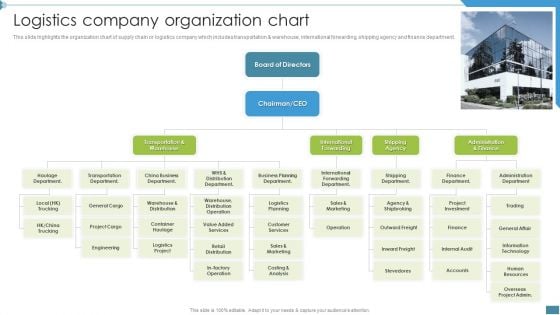
Supply Chain And Logistics Company Profile Logistics Company Organization Chart Template PDF
This slide highlights the organization chart of supply chain or logistics company which includes transportation and warehouse, international forwarding, shipping agency and finance department. Presenting Supply Chain And Logistics Company Profile Logistics Company Organization Chart Template PDF to provide visual cues and insights. Share and navigate important information on one stage that need your due attention. This template can be used to pitch topics like Haulage Department, Transportation Department, Business Department. In addtion, this PPT design contains high resolution images, graphics, etc, that are easily editable and available for immediate download.
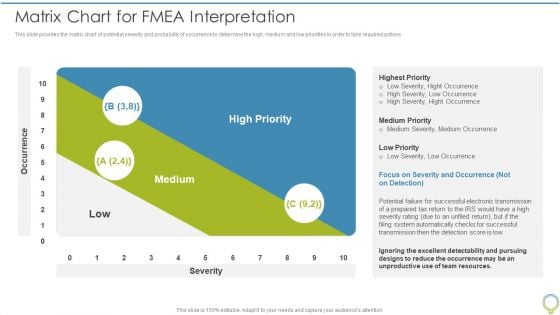
FMEA To Determine Potential Matrix Chart For Fmea Interpretation Summary PDF
This slide provides the matrix chart of potential severity and probability of occurrence to determine the high, medium and low priorities in order to take required actions. Presenting FMEA To Determine Potential Matrix Chart For Fmea Interpretation Summary PDF to provide visual cues and insights. Share and navigate important information on one stages that need your due attention. This template can be used to pitch topics like Highest Priority, Medium Priority, Low Priority. In addtion, this PPT design contains high resolution images, graphics, etc, that are easily editable and available for immediate download.
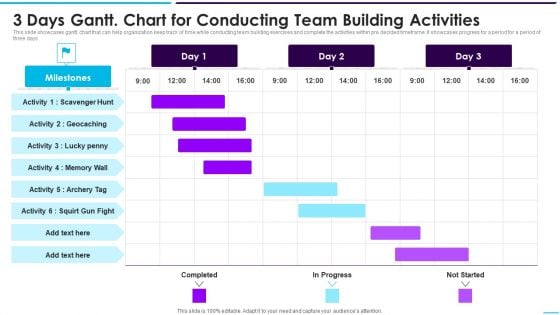
3 Days Gantt Chart For Conducting Team Building Activities Rules PDF
This slide showcases gantt. chart that can help organization keep track of time while conducting team building exercises and complete the activities within pre decided timeframe. It showcases progress for a period for a period of three days.Showcasing this set of slides titled 3 Days Gantt Chart For Conducting Team Building Activities Rules PDF The topics addressed in these templates are Conducting Team, Building, Activities All the content presented in this PPT design is completely editable. Download it and make adjustments in color, background, font etc. as per your unique business setting.
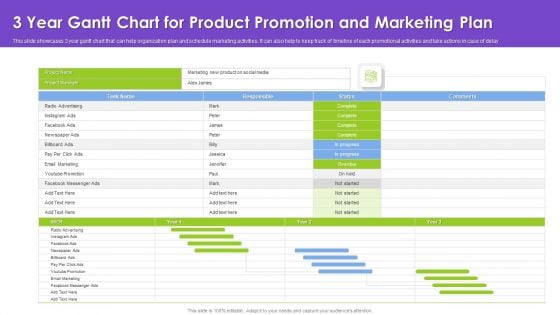
3 Year Gantt Chart For Product Promotion And Marketing Plan Demonstration PDF
This slide showcases 3 year gantt chart that can help organization plan and schedule marketing activities. It can also help to keep track of timeline of each promotional activities and take actions in case of delay.Pitch your topic with ease and precision using this 3 Year Gantt Chart For Product Promotion And Marketing Plan Demonstration PDF. This layout presents information on Radio Advertising, Responsible, Comments. It is also available for immediate download and adjustment. So, changes can be made in the color, design, graphics or any other component to create a unique layout.
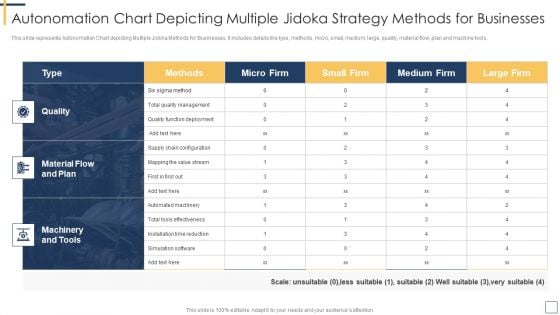
Autonomation Chart Depicting Multiple Jidoka Strategy Methods For Businesses Slides PDF
This slide represents Autonomation Chart depicting Multiple Jidoka Methods for Businesses. It includes details like type, methods, micro, small, medium, large, quality, material flow, plan and machine tools.Pitch your topic with ease and precision using this Autonomation Chart Depicting Multiple Jidoka Strategy Methods For Businesses Slides PDF. This layout presents information on Quality Management, Function Deployment, Automated Machinery. It is also available for immediate download and adjustment. So, changes can be made in the color, design, graphics or any other component to create a unique layout.
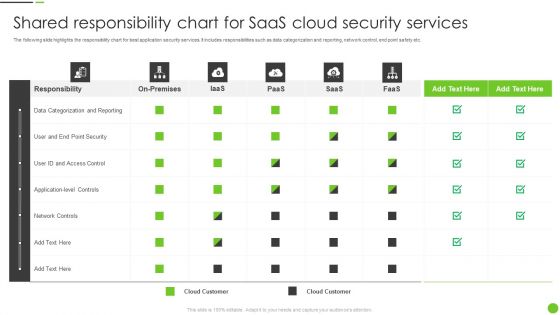
Shared Responsibility Chart For Saas Cloud Security Services Ppt PowerPoint Presentation File Outline PDF
The following slide highlights the responsibility chart for best application security services. It includes responsibilities such as data categorization and reporting, network control, end point safety etc. Showcasing this set of slides titled Shared Responsibility Chart For Saas Cloud Security Services Ppt PowerPoint Presentation File Outline PDF. The topics addressed in these templates are Application Level Controls, Cloud Customer, Data Categorization. All the content presented in this PPT design is completely editable. Download it and make adjustments in color, background, font etc. as per your unique business setting.
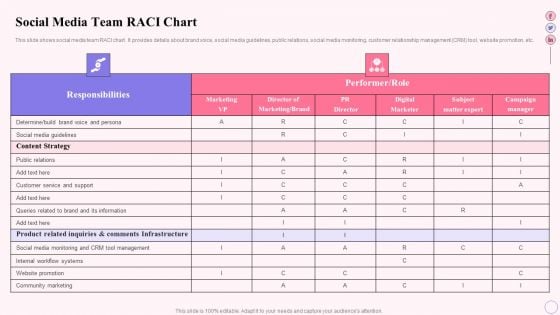
Integrating Social Media Tactics Social Media Team Raci Chart Clipart PDF
This slide shows social media team RACI chart. It provides details about brand voice, social media guidelines, public relations, social media monitoring, customer relationship management CRM tool, website promotion, etc. Deliver and pitch your topic in the best possible manner with this Integrating Social Media Tactics Social Media Team Raci Chart Clipart PDF. Use them to share invaluable insights on Contents Strategy, Customer Service, Community Marketing and impress your audience. This template can be altered and modified as per your expectations. So, grab it now.
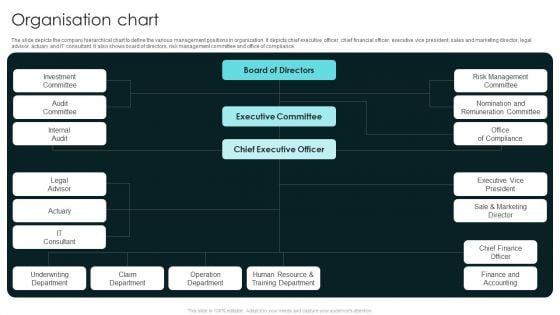
Term Life And General Insurance Company Profile Organisation Chart Formats PDF
The slide depicts the company hierarchical chart to define the various management positions in organization. It depicts chief executive officer, chief financial officer, executive vice president, sales and marketing director, legal advisor, actuary and IT consultant. It also shows board of directors, risk management committee and office of compliance. Deliver and pitch your topic in the best possible manner with this Term Life And General Insurance Company Profile Organisation Chart Formats PDF. Use them to share invaluable insights on Executive Committee, Chief Executive Officer, Risk Management Committee and impress your audience. This template can be altered and modified as per your expectations. So, grab it now.
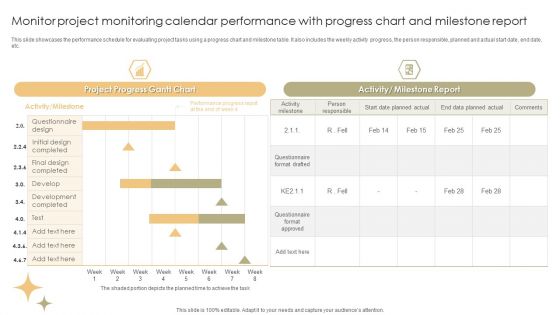
Monitor Project Monitoring Calendar Performance With Progress Chart And Milestone Report Formats PDF
This slide showcases the performance schedule for evaluating project tasks using a progress chart and milestone table. It also includes the weekly activity progress, the person responsible, planned and actual start date, end date, etc. Showcasing this set of slides titled Monitor Project Monitoring Calendar Performance With Progress Chart And Milestone Report Formats PDF. The topics addressed in these templates are Questionnaire Design, Develop, Performance Progress. All the content presented in this PPT design is completely editable. Download it and make adjustments in color, background, font etc. as per your unique business setting.
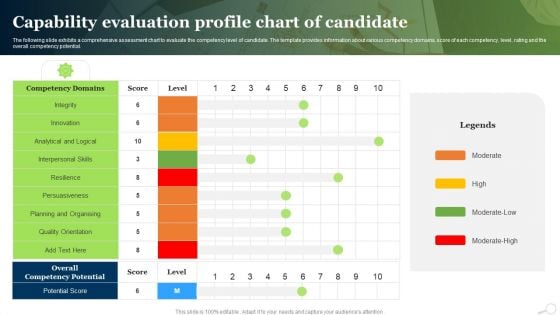
Capability Evaluation Profile Chart Of Candidate Ppt PowerPoint Presentation Slides Graphics Example PDF
The following slide exhibits a comprehensive assessment chart to evaluate the competency level of candidate. The template provides information about various competency domains, score of each competency, level, rating and the overall competency potential.Showcasing this set of slides titled Capability Evaluation Profile Chart Of Candidate Ppt PowerPoint Presentation Slides Graphics Example PDF. The topics addressed in these templates are Persuasiveness, Interpersonal Skills, Analytical Logical. All the content presented in this PPT design is completely editable. Download it and make adjustments in color, background, font etc. as per your unique business setting.
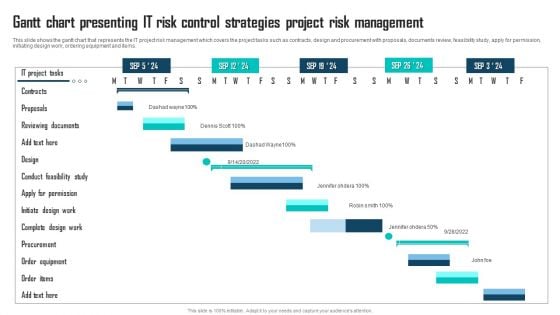
Gantt Chart Presenting IT Risk Control Strategies Project Risk Management Sample PDF
This slide shows the gantt chart that represents the IT project risk management which covers the project tasks such as contracts, design and procurement with proposals, documents review, feasibility study, apply for permission, initiating design work, ordering equipment and items. Showcasing this set of slides titled Gantt Chart Presenting IT Risk Control Strategies Project Risk Management Sample PDF. The topics addressed in these templates are IT Project Tasks, Reviewing Documents, Conduct Feasibility Study. All the content presented in this PPT design is completely editable. Download it and make adjustments in color, background, font etc. as per your unique business setting.
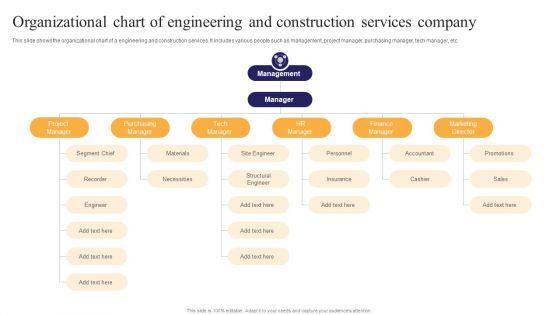
Organizational Chart Of Engineering And Construction Services Company Ppt PowerPoint Presentation Professional Demonstration PDF
This slide shows the organizational chart of a engineering and construction services. It includes various people such as management, project manager, purchasing manager, tech manager, etc. Pitch your topic with ease and precision using this Organizational Chart Of Engineering And Construction Services Company Ppt PowerPoint Presentation Professional Demonstration PDF. This layout presents information on Purchasing Manager, Structural Engineer, Finance Manager. It is also available for immediate download and adjustment. So, changes can be made in the color, design, graphics or any other component to create a unique layout.
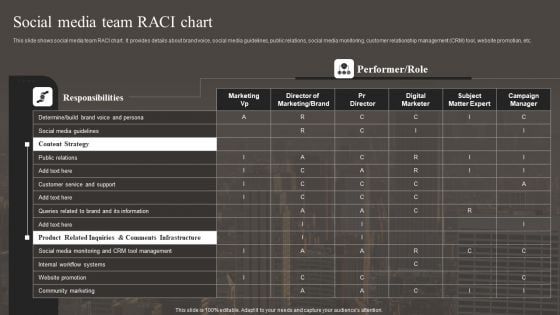
Social Media Team RACI Chart Implementing Social Media Marketing Strategy Clipart PDF
This slide shows social media team RACI chart. It provides details about brand voice, social media guidelines, public relations, social media monitoring, customer relationship management CRM tool, website promotion, etc. Deliver and pitch your topic in the best possible manner with this Social Media Team RACI Chart Implementing Social Media Marketing Strategy Clipart PDF. Use them to share invaluable insights on Content Strategy, Product Related Inquiries, Customer Service And Support and impress your audience. This template can be altered and modified as per your expectations. So, grab it now.
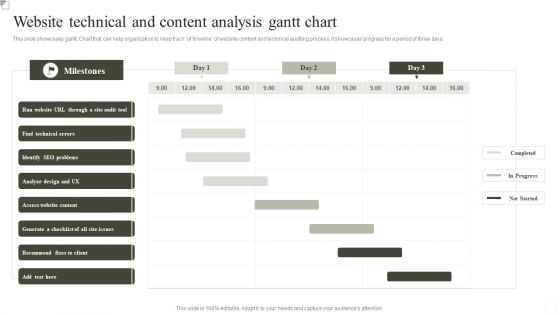
Website Technical And Content Analysis Gantt Chart Ppt Portfolio Example PDF
This slide showcases gantt. Chart that can help organization to keep track of timeline of website content and technical auditing process. it showcases progress for a period of three days. Pitch your topic with ease and precision using this Website Technical And Content Analysis Gantt Chart Ppt Portfolio Example PDF. This layout presents information on Find Technical Errors, Identify SEO Problems, Assess Website Content. It is also available for immediate download and adjustment. So, changes can be made in the color, design, graphics or any other component to create a unique layout.
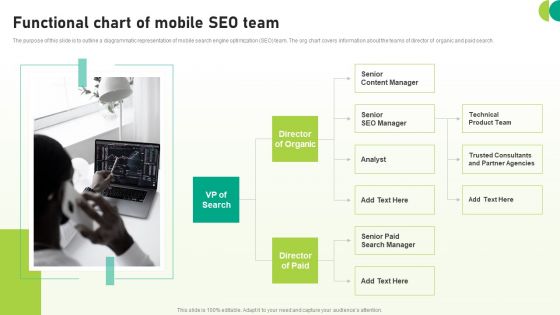
Utilizing SEO To Boost Customer Functional Chart Of Mobile SEO Team Introduction PDF
The purpose of this slide is to outline a diagrammatic representation of mobile search engine optimization SEO team. The org chart covers information about the teams of director of organic and paid search. Make sure to capture your audiences attention in your business displays with our gratis customizable Utilizing SEO To Boost Customer Functional Chart Of Mobile SEO Team Introduction PDF. These are great for business strategies, office conferences, capital raising or task suggestions. If you desire to acquire more customers for your tech business and ensure they stay satisfied, create your own sales presentation with these plain slides.
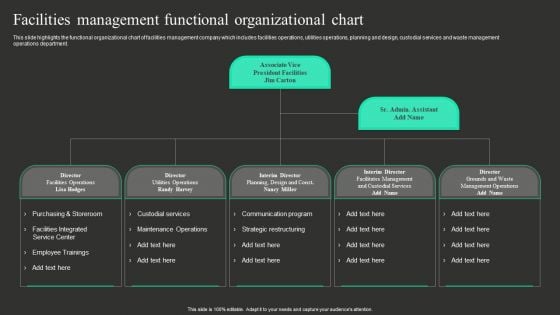
Workplace Facility Management Services Company Facilities Management Functional Organizational Chart Graphics PDF
This slide highlights the functional organizational chart of facilities management company which includes facilities operations, utilities operations, planning and design, custodial services and waste management operations department. From laying roadmaps to briefing everything in detail, our templates are perfect for you. You can set the stage with your presentation slides. All you have to do is download these easy to edit and customizable templates. Workplace Facility Management Services Company Facilities Management Functional Organizational Chart Graphics PDF will help you deliver an outstanding performance that everyone would remember and praise you for. Do download this presentation today.
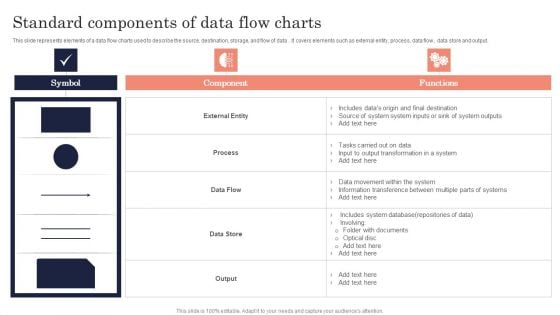
Standard Components Of Data Flow Charts Ppt PowerPoint Presentation File Pictures PDF
this slide represents elements of a data flow charts used to describe the source, destination, storage, and flow of data. it covers elements such as external entity, process, data flow, data store and output. Showcasing this set of slides titled Standard Components Of Data Flow Charts Ppt PowerPoint Presentation File Pictures PDF. The topics addressed in these templates are Symbol, Component, Functions. All the content presented in this PPT design is completely editable. Download it and make adjustments in color, background, font etc. as per your unique business setting.
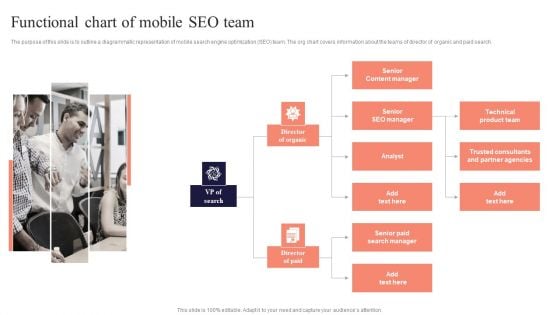
Functional Chart Of Mobile SEO Team Performing Mobile SEO Audit To Analyze Web Traffic Inspiration PDF
The purpose of this slide is to outline a diagrammatic representation of mobile search engine optimization SEO team. The org chart covers information about the teams of director of organic and paid search. Want to ace your presentation in front of a live audience Our Functional Chart Of Mobile SEO Team Performing Mobile SEO Audit To Analyze Web Traffic Inspiration PDF can help you do that by engaging all the users towards you.. Slidegeeks experts have put their efforts and expertise into creating these impeccable powerpoint presentations so that you can communicate your ideas clearly. Moreover, all the templates are customizable, and easy-to-edit and downloadable. Use these for both personal and commercial use.


 Continue with Email

 Home
Home


