icons
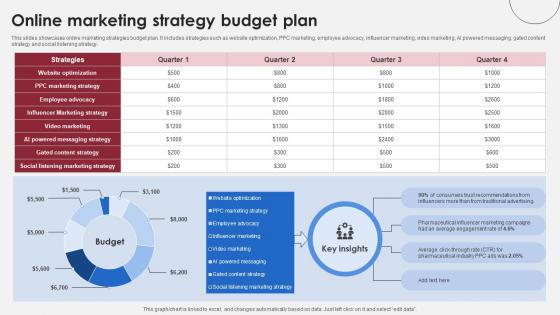
Online Marketing Strategy Budget Plan Accelerating Market Share And Profitability MKT SS V
This slides showcases online marketing strategies budget plan. It includes strategies such as website optimization, PPC marketing, employee advocacy, influencer marketing, video marketing, AI powered messaging, gated content strategy and social listening strategy. Slidegeeks has constructed Online Marketing Strategy Budget Plan Accelerating Market Share And Profitability MKT SS V after conducting extensive research and examination. These presentation templates are constantly being generated and modified based on user preferences and critiques from editors. Here, you will find the most attractive templates for a range of purposes while taking into account ratings and remarks from users regarding the content. This is an excellent jumping-off point to explore our content and will give new users an insight into our top-notch PowerPoint Templates. This slides showcases online marketing strategies budget plan. It includes strategies such as website optimization, PPC marketing, employee advocacy, influencer marketing, video marketing, AI powered messaging, gated content strategy and social listening strategy.
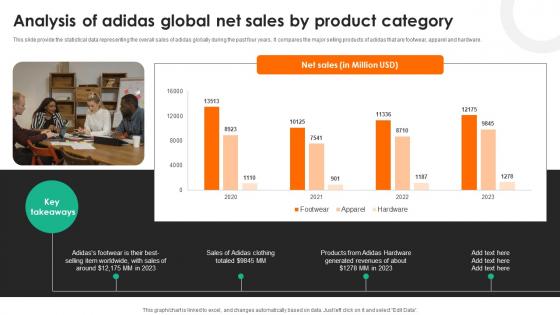
Evaluating Adidas Branding Analysis Of Adidas Global Net Sales By Product Category Strategy SS V
This slide provide the statistical data representing the overall sales of Adidas globally during the past four years. It compares the major selling products of Adidas that are footwear, apparel and hardware. Make sure to capture your audiences attention in your business displays with our gratis customizable Evaluating Adidas Branding Analysis Of Adidas Global Net Sales By Product Category Strategy SS V. These are great for business strategies, office conferences, capital raising or task suggestions. If you desire to acquire more customers for your tech business and ensure they stay satisfied, create your own sales presentation with these plain slides. This slide provide the statistical data representing the overall sales of Adidas globally during the past four years. It compares the major selling products of Adidas that are footwear, apparel and hardware.
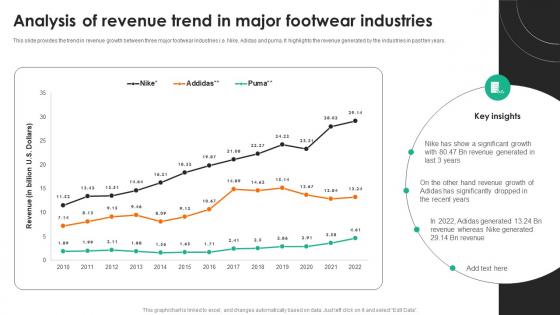
Evaluating Adidas Branding Analysis Of Revenue Trend In Major Footwear Industries Strategy SS V
This slide provides the trend in revenue growth between three major footwear industries i.e. Nike, Adidas and puma. It highlights the revenue generated by the industries in past ten years. Formulating a presentation can take up a lot of effort and time, so the content and message should always be the primary focus. The visuals of the PowerPoint can enhance the presenters message, so our Evaluating Adidas Branding Analysis Of Revenue Trend In Major Footwear Industries Strategy SS V was created to help save time. Instead of worrying about the design, the presenter can concentrate on the message while our designers work on creating the ideal templates for whatever situation is needed. Slidegeeks has experts for everything from amazing designs to valuable content, we have put everything into Evaluating Adidas Branding Analysis Of Revenue Trend In Major Footwear Industries Strategy SS V. This slide provides the trend in revenue growth between three major footwear industries i.e. Nike, Adidas and puma. It highlights the revenue generated by the industries in past ten years.
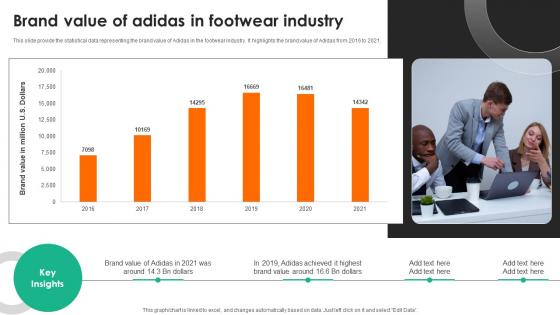
Evaluating Adidas Branding Brand Value Of Adidas In Footwear Industry Strategy SS V
This slide provide the statistical data representing the brand value of Adidas in the footwear industry. It highlights the brand value of Adidas from 2016 to 2021. This modern and well-arranged Evaluating Adidas Branding Brand Value Of Adidas In Footwear Industry Strategy SS V provides lots of creative possibilities. It is very simple to customize and edit with the Powerpoint Software. Just drag and drop your pictures into the shapes. All facets of this template can be edited with Powerpoint, no extra software is necessary. Add your own material, put your images in the places assigned for them, adjust the colors, and then you can show your slides to the world, with an animated slide included. This slide provide the statistical data representing the brand value of Adidas in the footwear industry. It highlights the brand value of Adidas from 2016 to 2021.
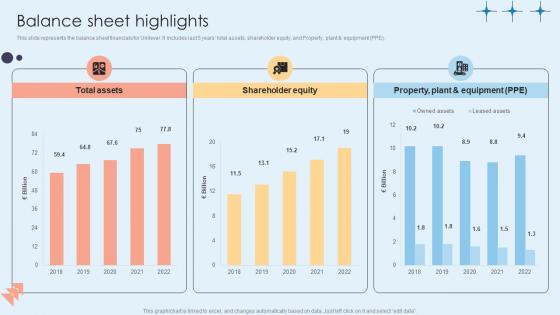
Balance Sheet Highlights Home Care Solutions Company Profile CP SS V
This slide represents the balance sheet financials for Unilever. It includes last 5 yearstotal assets, shareholder equity, and Property, plant and equipment PPE. Find a pre-designed and impeccable Balance Sheet Highlights Home Care Solutions Company Profile CP SS V. The templates can ace your presentation without additional effort. You can download these easy-to-edit presentation templates to make your presentation stand out from others. So, what are you waiting for Download the template from Slidegeeks today and give a unique touch to your presentation. This slide represents the balance sheet financials for Unilever. It includes last 5 yearstotal assets, shareholder equity, and Property, plant and equipment PPE.
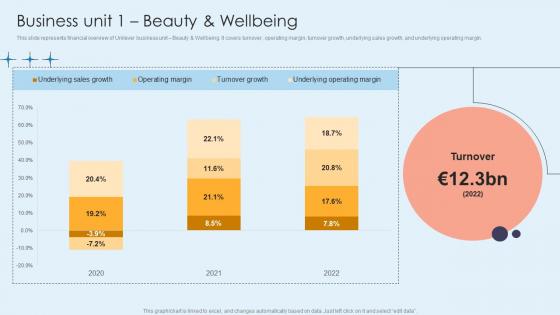
Business Unit 1 Beauty And Wellbeing Home Care Solutions Company Profile CP SS V
This slide represents financial overview of Unilever business unit Beauty and Wellbeing. It covers turnover, operating margin, turnover growth, underlying sales growth, and underlying operating margin.Slidegeeks is one of the best resources for PowerPoint templates. You can download easily and regulate Business Unit 1 Beauty And Wellbeing Home Care Solutions Company Profile CP SS V for your personal presentations from our wonderful collection. A few clicks is all it takes to discover and get the most relevant and appropriate templates. Use our Templates to add a unique zing and appeal to your presentation and meetings. All the slides are easy to edit and you can use them even for advertisement purposes. This slide represents financial overview of Unilever business unit Beauty and Wellbeing. It covers turnover, operating margin, turnover growth, underlying sales growth, and underlying operating margin.

Business Unit 2 Personal Care Home Care Solutions Company Profile CP SS V
This slide represents financial overview of Unilever business unit personal care. It covers turnover, operating margin, turnover growth, underlying sales growth, and underlying operating margin.Want to ace your presentation in front of a live audience Our Business Unit 2 Personal Care Home Care Solutions Company Profile CP SS V can help you do that by engaging all the users towards you. Slidegeeks experts have put their efforts and expertise into creating these impeccable powerpoint presentations so that you can communicate your ideas clearly. Moreover, all the templates are customizable, and easy-to-edit and downloadable. Use these for both personal and commercial use. This slide represents financial overview of Unilever business unit personal care. It covers turnover, operating margin, turnover growth, underlying sales growth, and underlying operating margin.

Business Unit 3 Home Care Home Care Solutions Company Profile CP SS V
This slide represents financial overview of Unilever business unit home care. It covers turnover, operating margin, turnover growth, underlying sales growth, and underlying operating margin.There are so many reasons you need a Business Unit 3 Home Care Home Care Solutions Company Profile CP SS V. The first reason is you can not spend time making everything from scratch, Thus, Slidegeeks has made presentation templates for you too. You can easily download these templates from our website easily. This slide represents financial overview of Unilever business unit home care. It covers turnover, operating margin, turnover growth, underlying sales growth, and underlying operating margin.

Business Unit 4 Nutrition Home Care Solutions Company Profile CP SS V
This slide represents financial overview of Unilever business unit Nutrition. It covers turnover, operating margin, turnover growth, underlying sales growth, and underlying operating margin.Do you have to make sure that everyone on your team knows about any specific topic I yes, then you should give Business Unit 4 Nutrition Home Care Solutions Company Profile CP SS V a try. Our experts have put a lot of knowledge and effort into creating this impeccable Business Unit 4 Nutrition Home Care Solutions Company Profile CP SS V. You can use this template for your upcoming presentations, as the slides are perfect to represent even the tiniest detail. You can download these templates from the Slidegeeks website and these are easy to edit. So grab these today This slide represents financial overview of Unilever business unit Nutrition. It covers turnover, operating margin, turnover growth, underlying sales growth, and underlying operating margin.

Business Unit 5 Ice Cream Home Care Solutions Company Profile CP SS V
This slide represents financial overview of Unilever business unit Ice cream. It covers turnover, operating margin, turnover growth, underlying sales growth, and underlying operating margin.Get a simple yet stunning designed Business Unit 5 Ice Cream Home Care Solutions Company Profile CP SS V. It is the best one to establish the tone in your meetings. It is an excellent way to make your presentations highly effective. So, download this PPT today from Slidegeeks and see the positive impacts. Our easy-to-edit Business Unit 5 Ice Cream Home Care Solutions Company Profile CP SS V can be your go-to option for all upcoming conferences and meetings. So, what are you waiting for Grab this template today. This slide represents financial overview of Unilever business unit Ice cream. It covers turnover, operating margin, turnover growth, underlying sales growth, and underlying operating margin.
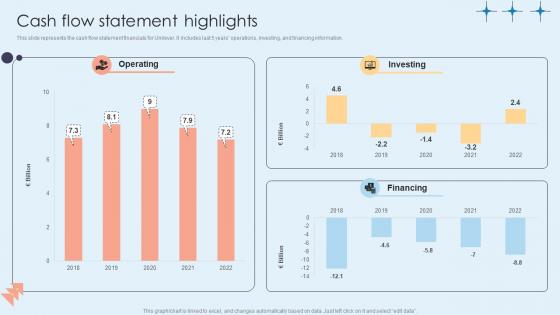
Cash Flow Statement Highlights Home Care Solutions Company Profile CP SS V
This slide represents the cash flow statement financials for Unilever. It includes last 5 yearsoperations, investing, and financing information.Slidegeeks is here to make your presentations a breeze with Cash Flow Statement Highlights Home Care Solutions Company Profile CP SS V With our easy-to-use and customizable templates, you can focus on delivering your ideas rather than worrying about formatting. With a variety of designs to choose from, you are sure to find one that suits your needs. And with animations and unique photos, illustrations, and fonts, you can make your presentation pop. So whether you are giving a sales pitch or presenting to the board, make sure to check out Slidegeeks first This slide represents the cash flow statement financials for Unilever. It includes last 5 yearsoperations, investing, and financing information.
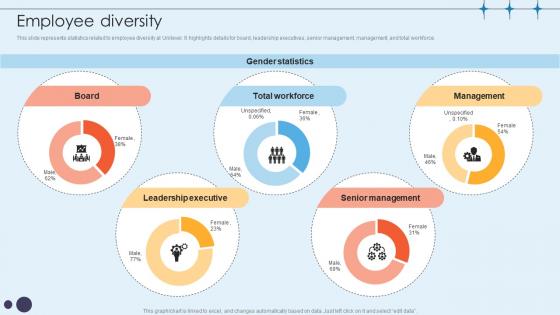
Employee Diversity Home Care Solutions Company Profile CP SS V
This slide represents statistics related to employee diversity at Unilever. It highlights details for board, leadership executives, senior management, management, and total workforce.Are you in need of a template that can accommodate all of your creative concepts This one is crafted professionally and can be altered to fit any style. Use it with Google Slides or PowerPoint. Include striking photographs, symbols, depictions, and other visuals. Fill, move around, or remove text boxes as desired. Test out color palettes and font mixtures. Edit and save your work, or work with colleagues. Download Employee Diversity Home Care Solutions Company Profile CP SS V and observe how to make your presentation outstanding. Give an impeccable presentation to your group and make your presentation unforgettable. This slide represents statistics related to employee diversity at Unilever. It highlights details for board, leadership executives, senior management, management, and total workforce.
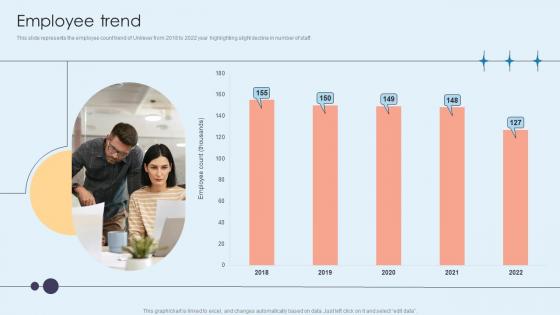
Employee Trend Home Care Solutions Company Profile CP SS V
This slide represents the employee count trend of Unilever from 2018 to 2022 year highlighting slight decline in number of staff.Crafting an eye-catching presentation has never been more straightforward. Let your presentation shine with this tasteful yet straightforward Employee Trend Home Care Solutions Company Profile CP SS V template. It offers a minimalistic and classy look that is great for making a statement. The colors have been employed intelligently to add a bit of playfulness while still remaining professional. Construct the ideal Employee Trend Home Care Solutions Company Profile CP SS V that effortlessly grabs the attention of your audience Begin now and be certain to wow your customers This slide represents the employee count trend of Unilever from 2018 to 2022 year highlighting slight decline in number of staff.
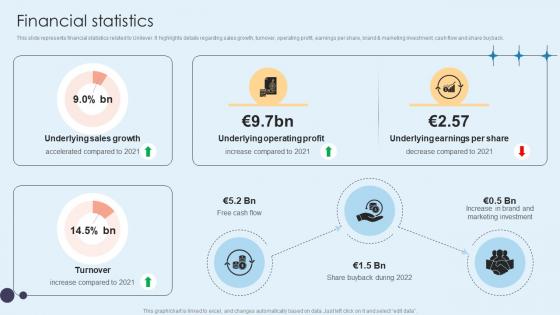
Financial Statistics Home Care Solutions Company Profile CP SS V
This slide represents financial statistics related to Unilever. It highlights details regarding sales growth, turnover, operating profit, earnings per share, brand and marketing investment, cash flow and share buyback.Formulating a presentation can take up a lot of effort and time, so the content and message should always be the primary focus. The visuals of the PowerPoint can enhance the presenters message, so our Financial Statistics Home Care Solutions Company Profile CP SS V was created to help save time. Instead of worrying about the design, the presenter can concentrate on the message while our designers work on creating the ideal templates for whatever situation is needed. Slidegeeks has experts for everything from amazing designs to valuable content, we have put everything into Financial Statistics Home Care Solutions Company Profile CP SS V. This slide represents financial statistics related to Unilever. It highlights details regarding sales growth, turnover, operating profit, earnings per share, brand and marketing investment, cash flow and share buyback.
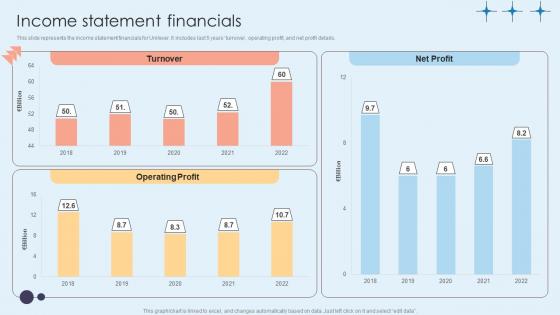
Income Statement Financials Home Care Solutions Company Profile CP SS V
This slide represents the income statement financials for Unilever. It includes last 5 yearsturnover, operating profit, and net profit details.Welcome to our selection of the Income Statement Financials Home Care Solutions Company Profile CP SS V. These are designed to help you showcase your creativity and bring your sphere to life. Planning and Innovation are essential for any business that is just starting out. This collection contains the designs that you need for your everyday presentations. All of our PowerPoints are 100 percent editable, so you can customize them to suit your needs. This multi-purpose template can be used in various situations. Grab these presentation templates today. This slide represents the income statement financials for Unilever. It includes last 5 yearsturnover, operating profit, and net profit details.
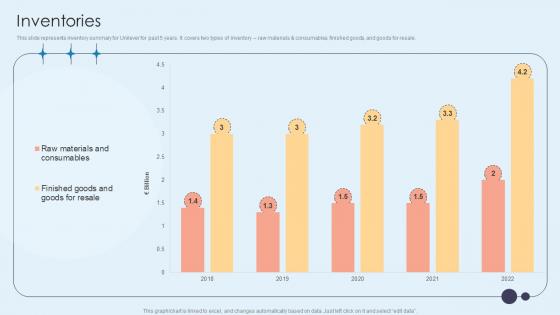
Inventories Home Care Solutions Company Profile CP SS V
This slide represents inventory summary for Unilever for past 5 years. It covers two types of inventory raw materials and consumables, finished goods, and goods for resale.Explore a selection of the finest Inventories Home Care Solutions Company Profile CP SS V here. With a plethora of professionally designed and pre-made slide templates, you can quickly and easily find the right one for your upcoming presentation. You can use our Inventories Home Care Solutions Company Profile CP SS V to effectively convey your message to a wider audience. Slidegeeks has done a lot of research before preparing these presentation templates. The content can be personalized and the slides are highly editable. Grab templates today from Slidegeeks. This slide represents inventory summary for Unilever for past 5 years. It covers two types of inventory raw materials and consumables, finished goods, and goods for resale.
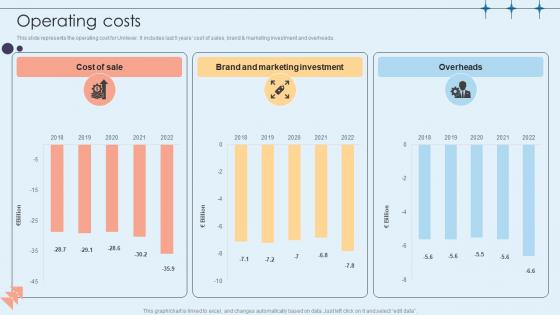
Operating Costs Home Care Solutions Company Profile CP SS V
This slide represents the operating cost for Unilever. It includes last 5 yearscost of sales, brand and marketing investment and overheads.Slidegeeks has constructed Operating Costs Home Care Solutions Company Profile CP SS V after conducting extensive research and examination. These presentation templates are constantly being generated and modified based on user preferences and critiques from editors. Here, you will find the most attractive templates for a range of purposes while taking into account ratings and remarks from users regarding the content. This is an excellent jumping-off point to explore our content and will give new users an insight into our top-notch PowerPoint Templates. This slide represents the operating cost for Unilever. It includes last 5 yearscost of sales, brand and marketing investment and overheads.
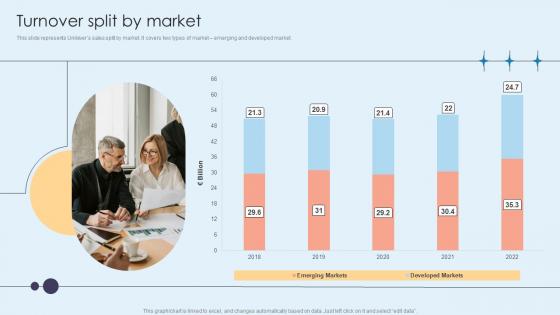
Turnover Split By Market Home Care Solutions Company Profile CP SS V
This slide represents Unilevers sales split by market. It covers two types of market emerging and developed market. Slidegeeks has constructed Turnover Split By Market Home Care Solutions Company Profile CP SS V after conducting extensive research and examination. These presentation templates are constantly being generated and modified based on user preferences and critiques from editors. Here, you will find the most attractive templates for a range of purposes while taking into account ratings and remarks from users regarding the content. This is an excellent jumping-off point to explore our content and will give new users an insight into our top-notch PowerPoint Templates. This slide represents Unilevers sales split by market. It covers two types of market emerging and developed market.
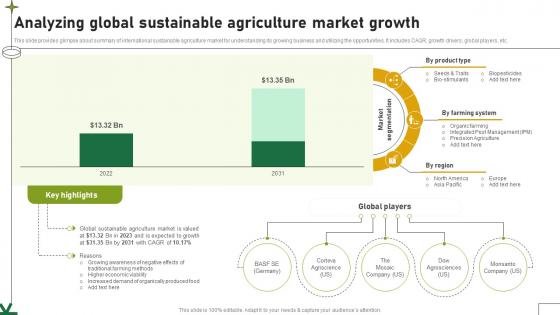
Analyzing Global Sustainable Agriculture Market Growth Adopting Sustainable Farming Techniques
This slide provides glimpse about summary of international sustainable agriculture market for understanding its growing business and utilizing the opportunities. It includes CAGR, growth drivers, global players, etc. If your project calls for a presentation, then Slidegeeks is your go-to partner because we have professionally designed, easy-to-edit templates that are perfect for any presentation. After downloading, you can easily edit Analyzing Global Sustainable Agriculture Market Growth Adopting Sustainable Farming Techniques and make the changes accordingly. You can rearrange slides or fill them with different images. Check out all the handy templates. This slide provides glimpse about summary of international sustainable agriculture market for understanding its growing business and utilizing the opportunities. It includes CAGR, growth drivers, global players, etc.
Dashboard Analysis For Tracking Agricultural Tasks Adopting Sustainable Farming Techniques
This slide showcases the KPIs that would help to track the improvements with adoption of new sustainable agriculture practices. It includes current tasks, crops, harvest, todays weather, summary, etc. Take your projects to the next level with our ultimate collection of Dashboard Analysis For Tracking Agricultural Tasks Adopting Sustainable Farming Techniques. Slidegeeks has designed a range of layouts that are perfect for representing task or activity duration, keeping track of all your deadlines at a glance. Tailor these designs to your exact needs and give them a truly corporate look with your own brand colors they will make your projects stand out from the rest This slide showcases the KPIs that would help to track the improvements with adoption of new sustainable agriculture practices. It includes current tasks, crops, harvest, todays weather, summary, etc.
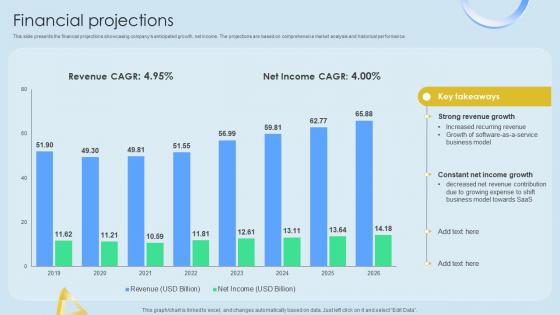
Financial Projections Cloud Networking Service Provider Business Model BMC SS V
This slide presents the financial projections showcasing companys anticipated growth, net income. The projections are based on comprehensive market analysis and historical performance. Do you have to make sure that everyone on your team knows about any specific topic I yes, then you should give Financial Projections Cloud Networking Service Provider Business Model BMC SS V a try. Our experts have put a lot of knowledge and effort into creating this impeccable Financial Projections Cloud Networking Service Provider Business Model BMC SS V. You can use this template for your upcoming presentations, as the slides are perfect to represent even the tiniest detail. You can download these templates from the Slidegeeks website and these are easy to edit. So grab these today This slide presents the financial projections showcasing companys anticipated growth, net income. The projections are based on comprehensive market analysis and historical performance.
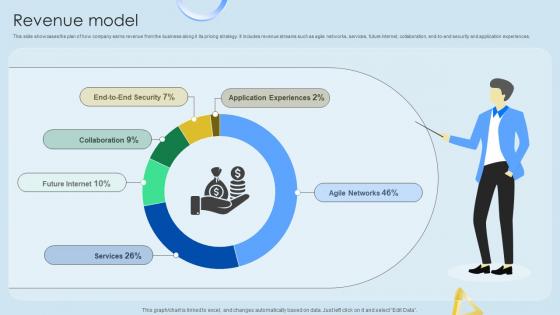
Revenue Model Cloud Networking Service Provider Business Model BMC SS V
This slide showcases the plan of how company earns revenue from the business along it its pricing strategy. It includes revenue streams such as agile networks, services, future internet, collaboration, end-to-end security and application experiences. Find highly impressive Revenue Model Cloud Networking Service Provider Business Model BMC SS V on Slidegeeks to deliver a meaningful presentation. You can save an ample amount of time using these presentation templates. No need to worry to prepare everything from scratch because Slidegeeks experts have already done a huge research and work for you. You need to download Revenue Model Cloud Networking Service Provider Business Model BMC SS V for your upcoming presentation. All the presentation templates are 100 percent editable and you can change the color and personalize the content accordingly. Download now This slide showcases the plan of how company earns revenue from the business along it its pricing strategy. It includes revenue streams such as agile networks, services, future internet, collaboration, end-to-end security and application experiences.

Application Security Performance Monitoring Application Security Testing
This slide showcases the performance tracking dashboard for application security to analyze and monitor security of application. Want to ace your presentation in front of a live audience Our Application Security Performance Monitoring Application Security Testing can help you do that by engaging all the users towards you. Slidegeeks experts have put their efforts and expertise into creating these impeccable powerpoint presentations so that you can communicate your ideas clearly. Moreover, all the templates are customizable, and easy-to-edit and downloadable. Use these for both personal and commercial use. This slide showcases the performance tracking dashboard for application security to analyze and monitor security of application.

Compound Annual Growth Rate CAGR Of Application Security Testing
This slide depicts the market growth of application security by software tools such as white-box testing, black-box testing, etc. Crafting an eye-catching presentation has never been more straightforward. Let your presentation shine with this tasteful yet straightforward Compound Annual Growth Rate CAGR Of Application Security Testing template. It offers a minimalistic and classy look that is great for making a statement. The colors have been employed intelligently to add a bit of playfulness while still remaining professional. Construct the ideal Compound Annual Growth Rate CAGR Of Application Security Testing that effortlessly grabs the attention of your audience Begin now and be certain to wow your customers This slide depicts the market growth of application security by software tools such as white-box testing, black-box testing, etc.
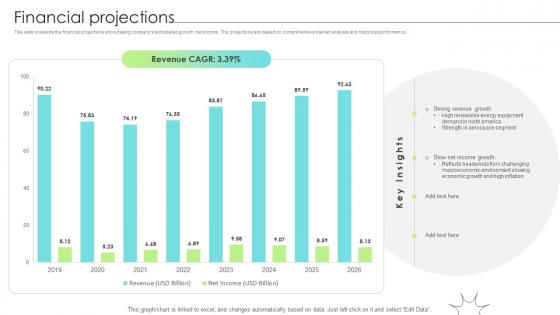
Financial Projections Renewable Energy Solution Provider Business Model BMC SS V
This slide presents the financial projections showcasing companys anticipated growth, net income. The projections are based on comprehensive market analysis and historical performance. There are so many reasons you need a Financial Projections Renewable Energy Solution Provider Business Model BMC SS V. The first reason is you can not spend time making everything from scratch, Thus, Slidegeeks has made presentation templates for you too. You can easily download these templates from our website easily. This slide presents the financial projections showcasing companys anticipated growth, net income. The projections are based on comprehensive market analysis and historical performance.

Revenue Model Renewable Energy Solution Provider Business Model BMC SS V
This slide showcases the revenue of the company by segments. Major segments included are aviation, healthcare, power, renewable energy and corporate. Find highly impressive Revenue Model Renewable Energy Solution Provider Business Model BMC SS V on Slidegeeks to deliver a meaningful presentation. You can save an ample amount of time using these presentation templates. No need to worry to prepare everything from scratch because Slidegeeks experts have already done a huge research and work for you. You need to download Revenue Model Renewable Energy Solution Provider Business Model BMC SS V for your upcoming presentation. All the presentation templates are 100 percent editable and you can change the color and personalize the content accordingly. Download now This slide showcases the revenue of the company by segments. Major segments included are aviation, healthcare, power, renewable energy and corporate.
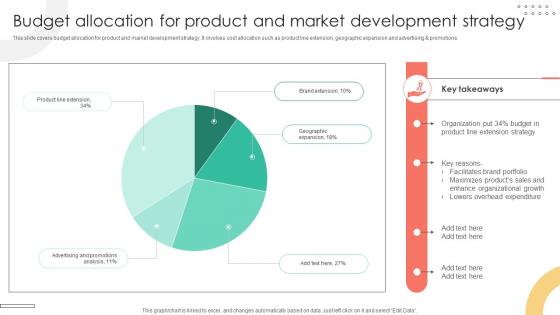
Brand Extension Techniques Budget Allocation For Product And Market Development Strategy SS V
This slide covers budget allocation for product and market development strategy. It involves cost allocation such as product line extension, geographic expansion and advertising and promotions. There are so many reasons you need a Brand Extension Techniques Budget Allocation For Product And Market Development Strategy SS V. The first reason is you can not spend time making everything from scratch, Thus, Slidegeeks has made presentation templates for you too. You can easily download these templates from our website easily. This slide covers budget allocation for product and market development strategy. It involves cost allocation such as product line extension, geographic expansion and advertising and promotions.

Brand Extension Techniques KPI Dashboard To Track Product Performance Strategy SS V
This slide represents KPI dashboard for measuring product performance. It covers total activities, new customers, events, net promoter score. Formulating a presentation can take up a lot of effort and time, so the content and message should always be the primary focus. The visuals of the PowerPoint can enhance the presenters message, so our Brand Extension Techniques KPI Dashboard To Track Product Performance Strategy SS V was created to help save time. Instead of worrying about the design, the presenter can concentrate on the message while our designers work on creating the ideal templates for whatever situation is needed. Slidegeeks has experts for everything from amazing designs to valuable content, we have put everything into Brand Extension Techniques KPI Dashboard To Track Product Performance Strategy SS V This slide represents KPI dashboard for measuring product performance. It covers total activities, new customers, events, net promoter score.
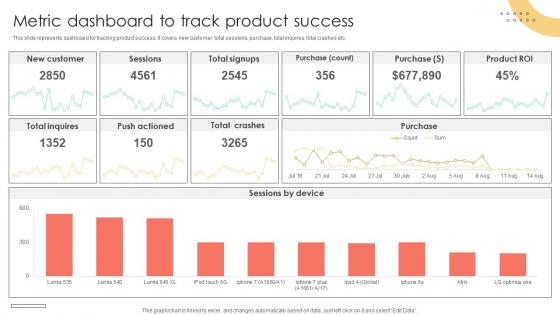
Brand Extension Techniques Metric Dashboard To Track Product Success Strategy SS V
This slide represents dashboard for tracking product success. It covers new customer, total sessions, purchase, total inquires, total crashes etc. Welcome to our selection of the Brand Extension Techniques Metric Dashboard To Track Product Success Strategy SS V. These are designed to help you showcase your creativity and bring your sphere to life. Planning and Innovation are essential for any business that is just starting out. This collection contains the designs that you need for your everyday presentations. All of our PowerPoints are 100Percent editable, so you can customize them to suit your needs. This multi-purpose template can be used in various situations. Grab these presentation templates today. This slide represents dashboard for tracking product success. It covers new customer, total sessions, purchase, total inquires, total crashes etc.
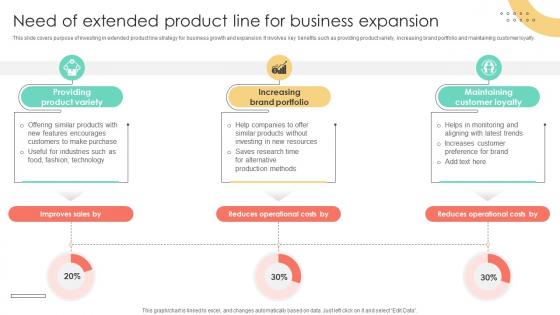
Brand Extension Techniques Need Of Extended Product Line For Business Expansion Strategy SS V
This slide covers purpose of investing in extended product line strategy for business growth and expansion. It involves key benefits such as providing product variety, increasing brand portfolio and maintaining customer loyalty. The best PPT templates are a great way to save time, energy, and resources. Slidegeeks have 100 percent editable powerpoint slides making them incredibly versatile. With these quality presentation templates, you can create a captivating and memorable presentation by combining visually appealing slides and effectively communicating your message. Download Brand Extension Techniques Need Of Extended Product Line For Business Expansion Strategy SS V from Slidegeeks and deliver a wonderful presentation. This slide covers purpose of investing in extended product line strategy for business growth and expansion. It involves key benefits such as providing product variety, increasing brand portfolio and maintaining customer loyalty.
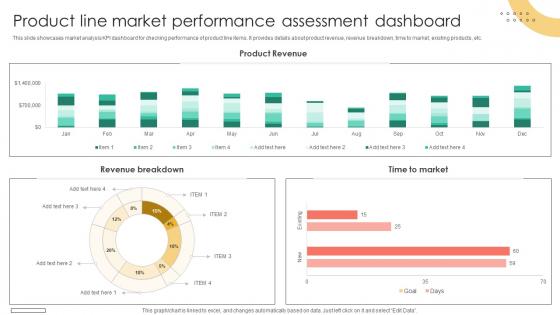
Brand Extension Techniques Product Line Market Performance Assessment Dashboard Strategy SS V
This slide showcases market analysis KPI dashboard for checking performance of product line items. It provides details about product revenue, revenue breakdown, time to market, existing products, etc. This Brand Extension Techniques Product Line Market Performance Assessment Dashboard Strategy SS V from Slidegeeks makes it easy to present information on your topic with precision. It provides customization options, so you can make changes to the colors, design, graphics, or any other component to create a unique layout. It is also available for immediate download, so you can begin using it right away. Slidegeeks has done good research to ensure that you have everything you need to make your presentation stand out. Make a name out there for a brilliant performance. This slide showcases market analysis KPI dashboard for checking performance of product line items. It provides details about product revenue, revenue breakdown, time to market, existing products, etc.
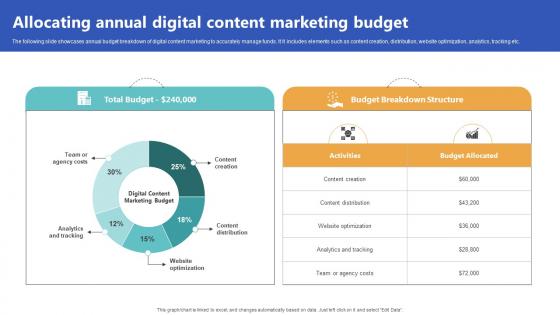
Allocating Annual Digital Content Marketing Top Of The Funnel Digital Content Strategy SS V
The following slide showcases annual budget breakdown of digital content marketing to accurately manage funds. It It includes elements such as content creation, distribution, website optimization, analytics, tracking etc. Create an editable Allocating Annual Digital Content Marketing Top Of The Funnel Digital Content Strategy SS V that communicates your idea and engages your audience. Whether you are presenting a business or an educational presentation, pre-designed presentation templates help save time. Allocating Annual Digital Content Marketing Top Of The Funnel Digital Content Strategy SS V is highly customizable and very easy to edit, covering many different styles from creative to business presentations. Slidegeeks has creative team members who have crafted amazing templates. So, go and get them without any delay. The following slide showcases annual budget breakdown of digital content marketing to accurately manage funds. It It includes elements such as content creation, distribution, website optimization, analytics, tracking etc.
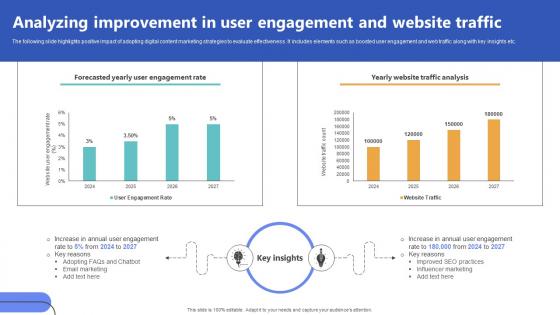
Analyzing Improvement In User Engagement Top Of The Funnel Digital Content Strategy SS V
The following slide highlights positive impact of adopting digital content marketing strategies to evaluate effectiveness. It includes elements such as boosted user engagement and web traffic along with key insights etc. Slidegeeks is one of the best resources for PowerPoint templates. You can download easily and regulate Analyzing Improvement In User Engagement Top Of The Funnel Digital Content Strategy SS V for your personal presentations from our wonderful collection. A few clicks is all it takes to discover and get the most relevant and appropriate templates. Use our Templates to add a unique zing and appeal to your presentation and meetings. All the slides are easy to edit and you can use them even for advertisement purposes. The following slide highlights positive impact of adopting digital content marketing strategies to evaluate effectiveness. It includes elements such as boosted user engagement and web traffic along with key insights etc.

Digital Content Performance Assessment Top Of The Funnel Digital Content Strategy SS V
The following slide depicts key performance indicators of digital content marketing to monitor results. It includes elements such as page views, social shares, click through rate, blog subscribers, conversions, opportunities influenced, average time on page etc. Find highly impressive Digital Content Performance Assessment Top Of The Funnel Digital Content Strategy SS V on Slidegeeks to deliver a meaningful presentation. You can save an ample amount of time using these presentation templates. No need to worry to prepare everything from scratch because Slidegeeks experts have already done a huge research and work for you. You need to download Digital Content Performance Assessment Top Of The Funnel Digital Content Strategy SS V for your upcoming presentation. All the presentation templates are 100 percent editable and you can change the color and personalize the content accordingly. Download now The following slide depicts key performance indicators of digital content marketing to monitor results. It includes elements such as page views, social shares, click through rate, blog subscribers, conversions, opportunities influenced, average time on page etc.
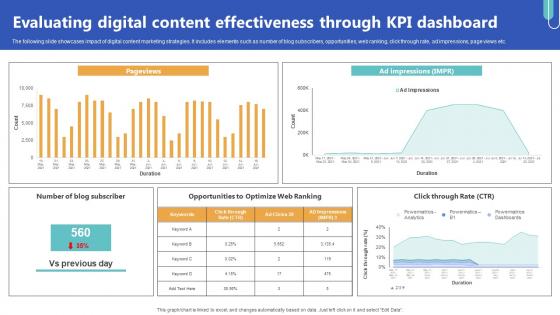
Evaluating Digital Content Effectiveness Through Top Of The Funnel Digital Content Strategy SS V
Crafting an eye-catching presentation has never been more straightforward. Let your presentation shine with this tasteful yet straightforward Evaluating Digital Content Effectiveness Through Top Of The Funnel Digital Content Strategy SS V template. It offers a minimalistic and classy look that is great for making a statement. The colors have been employed intelligently to add a bit of playfulness while still remaining professional. Construct the ideal Evaluating Digital Content Effectiveness Through Top Of The Funnel Digital Content Strategy SS V that effortlessly grabs the attention of your audience Begin now and be certain to wow your customers Our Evaluating Digital Content Effectiveness Through Top Of The Funnel Digital Content Strategy SS V are topically designed to provide an attractive backdrop to any subject. Use them to look like a presentation pro.
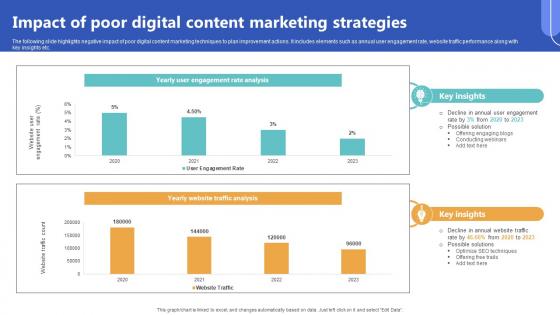
Impact Of Poor Digital Content Marketing Strategies Top Of The Funnel Digital Content Strategy SS V
The following slide highlights negative impact of poor digital content marketing techniques to plan improvement actions. It includes elements such as annual user engagement rate, website traffic performance along with key insights etc. Formulating a presentation can take up a lot of effort and time, so the content and message should always be the primary focus. The visuals of the PowerPoint can enhance the presenters message, so our Impact Of Poor Digital Content Marketing Strategies Top Of The Funnel Digital Content Strategy SS V was created to help save time. Instead of worrying about the design, the presenter can concentrate on the message while our designers work on creating the ideal templates for whatever situation is needed. Slidegeeks has experts for everything from amazing designs to valuable content, we have put everything into Impact Of Poor Digital Content Marketing Strategies Top Of The Funnel Digital Content Strategy SS V The following slide highlights negative impact of poor digital content marketing techniques to plan improvement actions. It includes elements such as annual user engagement rate, website traffic performance along with key insights etc.
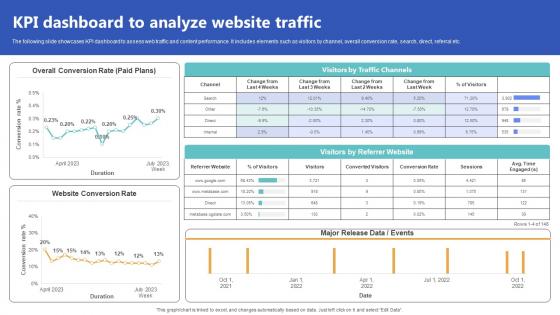
KPI Dashboard To Analyze Website Traffic Top Of The Funnel Digital Content Strategy SS V
The following slide showcases KPI dashboard to assess web traffic and content performance. It includes elements such as visitors by channel, overall conversion rate, search, direct, referral etc. Explore a selection of the finest KPI Dashboard To Analyze Website Traffic Top Of The Funnel Digital Content Strategy SS V here. With a plethora of professionally designed and pre-made slide templates, you can quickly and easily find the right one for your upcoming presentation. You can use our KPI Dashboard To Analyze Website Traffic Top Of The Funnel Digital Content Strategy SS V to effectively convey your message to a wider audience. Slidegeeks has done a lot of research before preparing these presentation templates. The content can be personalized and the slides are highly editable. Grab templates today from Slidegeeks. The following slide showcases KPI dashboard to assess web traffic and content performance. It includes elements such as visitors by channel, overall conversion rate, search, direct, referral etc.

Perform Comprehensive Keyword Research Top Of The Funnel Digital Content Strategy SS V
The following slide represents key outcomes of detailed keyword research to direct efforts to fulfill customer demand. It includes elements such as volume, intent, results, keyword variation, keyword difficulty, cost per click CPC etc. Take your projects to the next level with our ultimate collection of Perform Comprehensive Keyword Research Top Of The Funnel Digital Content Strategy SS V. Slidegeeks has designed a range of layouts that are perfect for representing task or activity duration, keeping track of all your deadlines at a glance. Tailor these designs to your exact needs and give them a truly corporate look with your own brand colors they will make your projects stand out from the rest The following slide represents key outcomes of detailed keyword research to direct efforts to fulfill customer demand. It includes elements such as volume, intent, results, keyword variation, keyword difficulty, cost per click CPC etc.
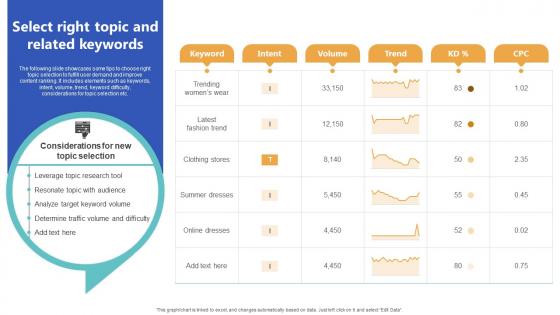
Select Right Topic And Related Keywords Top Of The Funnel Digital Content Strategy SS V
The following slide showcases some tips to choose right topic selection to fulfill user demand and improve content ranking. It includes elements such as keywords, intent, volume, trend, keyword difficulty, considerations for topic selection etc. Explore a selection of the finest Select Right Topic And Related Keywords Top Of The Funnel Digital Content Strategy SS V here. With a plethora of professionally designed and pre-made slide templates, you can quickly and easily find the right one for your upcoming presentation. You can use our Select Right Topic And Related Keywords Top Of The Funnel Digital Content Strategy SS V to effectively convey your message to a wider audience. Slidegeeks has done a lot of research before preparing these presentation templates. The content can be personalized and the slides are highly editable. Grab templates today from Slidegeeks. The following slide showcases some tips to choose right topic selection to fulfill user demand and improve content ranking. It includes elements such as keywords, intent, volume, trend, keyword difficulty, considerations for topic selection etc.
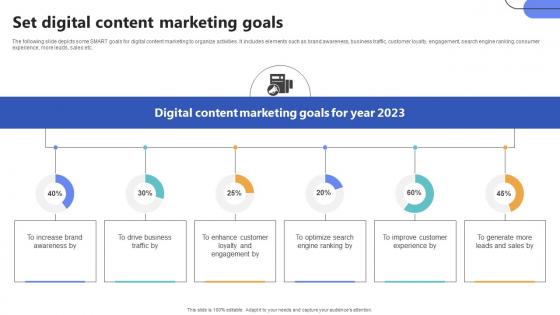
Set Digital Content Marketing Goals Top Of The Funnel Digital Content Strategy SS V
The following slide depicts some SMART goals for digital content marketing to organize activities. It includes elements such as brand awareness, business traffic, customer loyalty, engagement, search engine ranking, consumer experience, more leads, sales etc. The best PPT templates are a great way to save time, energy, and resources. Slidegeeks have 100 percent editable powerpoint slides making them incredibly versatile. With these quality presentation templates, you can create a captivating and memorable presentation by combining visually appealing slides and effectively communicating your message. Download Set Digital Content Marketing Goals Top Of The Funnel Digital Content Strategy SS V from Slidegeeks and deliver a wonderful presentation. The following slide depicts some SMART goals for digital content marketing to organize activities. It includes elements such as brand awareness, business traffic, customer loyalty, engagement, search engine ranking, consumer experience, more leads, sales etc.
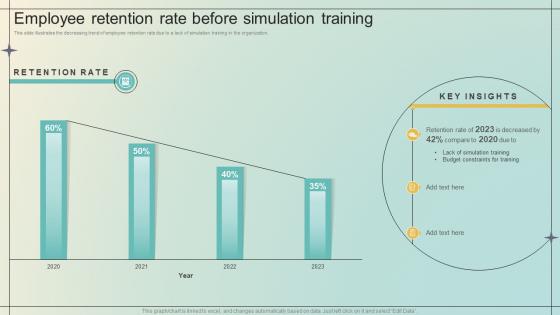
Immersive Training For Practical Employee Retention Rate Before Simulation Training DTE SS V
This slide illustrates the decreasing trend of employee retention rate due to a lack of simulation training in the organization. From laying roadmaps to briefing everything in detail, our templates are perfect for you. You can set the stage with your presentation slides. All you have to do is download these easy-to-edit and customizable templates. Immersive Training For Practical Employee Retention Rate Before Simulation Training DTE SS V will help you deliver an outstanding performance that everyone would remember and praise you for. Do download this presentation today. This slide illustrates the decreasing trend of employee retention rate due to a lack of simulation training in the organization.
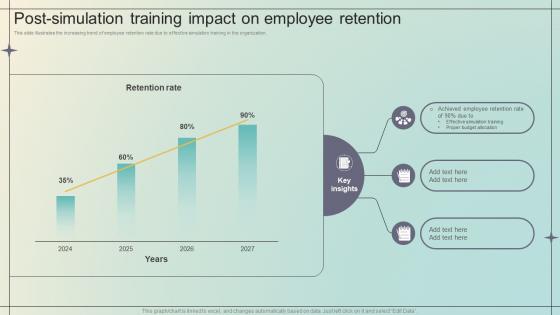
Immersive Training For Practical Post Simulation Training Impact On Employee Retention DTE SS V
This slide illustrates the increasing trend of employee retention rate due to effective simulation training in the organization. Make sure to capture your audiences attention in your business displays with our gratis customizable Immersive Training For Practical Post Simulation Training Impact On Employee Retention DTE SS V. These are great for business strategies, office conferences, capital raising or task suggestions. If you desire to acquire more customers for your tech business and ensure they stay satisfied, create your own sales presentation with these plain slides. This slide illustrates the increasing trend of employee retention rate due to effective simulation training in the organization.

Immersive Training For Practical Post Training Impact Of Simulation Training On Decision DTE SS V
This slide includes key performance indicators that the company has a positive impact on due to effective training programs such as team collaboration rate, error rate, etc. Formulating a presentation can take up a lot of effort and time, so the content and message should always be the primary focus. The visuals of the PowerPoint can enhance the presenters message, so our Immersive Training For Practical Post Training Impact Of Simulation Training On Decision DTE SS V was created to help save time. Instead of worrying about the design, the presenter can concentrate on the message while our designers work on creating the ideal templates for whatever situation is needed. Slidegeeks has experts for everything from amazing designs to valuable content, we have put everything into Immersive Training For Practical Post Training Impact Of Simulation Training On Decision DTE SS V. This slide includes key performance indicators that the company has a positive impact on due to effective training programs such as team collaboration rate, error rate, etc.
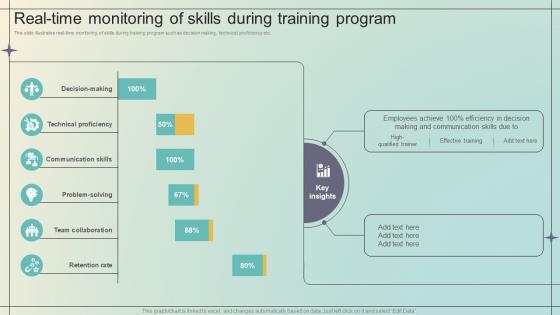
Immersive Training For Practical Real Time Monitoring Of Skills During Training Program DTE SS V
This slide illustrates real-time monitoring of skills during training program such as decision making, technical proficiency etc. This modern and well-arranged Immersive Training For Practical Real Time Monitoring Of Skills During Training Program DTE SS V provides lots of creative possibilities. It is very simple to customize and edit with the Powerpoint Software. Just drag and drop your pictures into the shapes. All facets of this template can be edited with Powerpoint, no extra software is necessary. Add your own material, put your images in the places assigned for them, adjust the colors, and then you can show your slides to the world, with an animated slide included. This slide illustrates real-time monitoring of skills during training program such as decision making, technical proficiency etc.
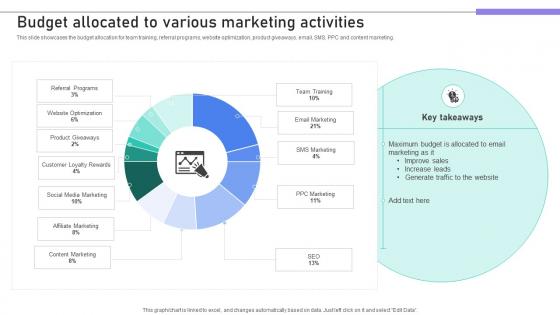
Building Stronger Customer Budget Allocated To Various Marketing Activities SA SS V
This slide showcases the budget allocation for team training, referral programs, website optimization, product giveaways, email, SMS, PPC and content marketing. Create an editable Building Stronger Customer Budget Allocated To Various Marketing Activities SA SS V that communicates your idea and engages your audience. Whether you are presenting a business or an educational presentation, pre-designed presentation templates help save time. Building Stronger Customer Budget Allocated To Various Marketing Activities SA SS V is highly customizable and very easy to edit, covering many different styles from creative to business presentations. Slidegeeks has creative team members who have crafted amazing templates. So, go and get them without any delay. This slide showcases the budget allocation for team training, referral programs, website optimization, product giveaways, email, SMS, PPC and content marketing.
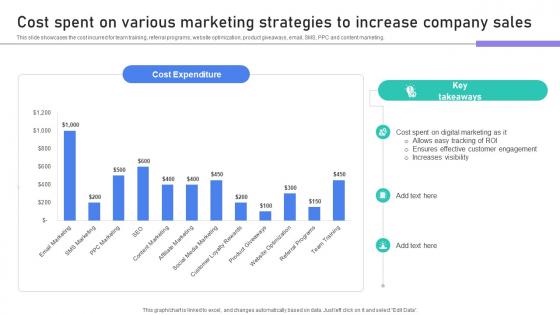
Building Stronger Customer Cost Spent On Various Marketing Strategies To Increase SA SS V
This slide showcases the cost incurred for team training, referral programs, website optimization, product giveaways, email, SMS, PPC and content marketing. Do you have to make sure that everyone on your team knows about any specific topic I yes, then you should give Building Stronger Customer Cost Spent On Various Marketing Strategies To Increase SA SS V a try. Our experts have put a lot of knowledge and effort into creating this impeccable Building Stronger Customer Cost Spent On Various Marketing Strategies To Increase SA SS V. You can use this template for your upcoming presentations, as the slides are perfect to represent even the tiniest detail. You can download these templates from the Slidegeeks website and these are easy to edit. So grab these today This slide showcases the cost incurred for team training, referral programs, website optimization, product giveaways, email, SMS, PPC and content marketing.

Building Stronger Customer Decreased Conversion Rate And Website Traffic Due SA SS V
This slide showcases the major reasons for the drop in e-commerce firm sales that are low conversion rate and website traffic. The major reasons for the decrease are poor website layout, generic email campaigns, etc. Present like a pro with Building Stronger Customer Decreased Conversion Rate And Website Traffic Due SA SS V. Create beautiful presentations together with your team, using our easy-to-use presentation slides. Share your ideas in real-time and make changes on the fly by downloading our templates. So whether you are in the office, on the go, or in a remote location, you can stay in sync with your team and present your ideas with confidence. With Slidegeeks presentation got a whole lot easier. Grab these presentations today. This slide showcases the major reasons for the drop in e-commerce firm sales that are low conversion rate and website traffic. The major reasons for the decrease are poor website layout, generic email campaigns, etc.
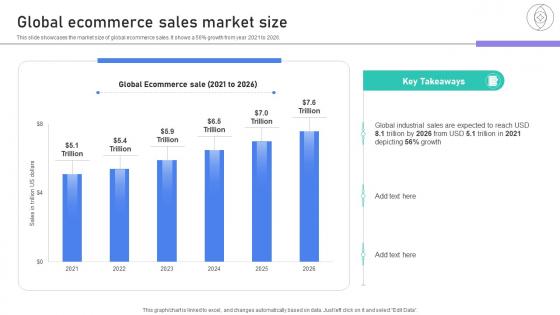
Building Stronger Customer Global Ecommerce Sales Market Size SA SS V
This slide showcases the market size of global ecommerce sales. It shows a 56 percent growth from year 2021 to 2026. Crafting an eye-catching presentation has never been more straightforward. Let your presentation shine with this tasteful yet straightforward Building Stronger Customer Global Ecommerce Sales Market Size SA SS V template. It offers a minimalistic and classy look that is great for making a statement. The colors have been employed intelligently to add a bit of playfulness while still remaining professional. Construct the ideal Building Stronger Customer Global Ecommerce Sales Market Size SA SS V that effortlessly grabs the attention of your audience Begin now and be certain to wow your customers This slide showcases the market size of global ecommerce sales. It shows a 56 percent growth from year 2021 to 2026.
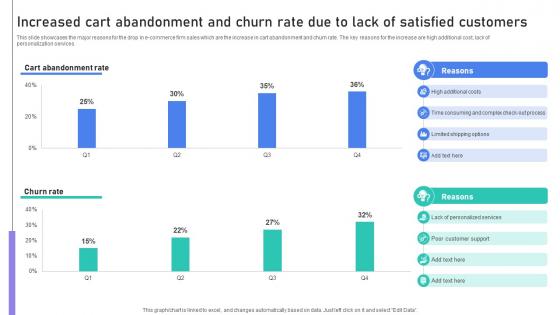
Building Stronger Customer Increased Cart Abandonment And Churn Rate Due To Lack SA SS V
This slide showcases the major reasons for the drop in e-commerce firm sales which are the increase in cart abandonment and churn rate. The key reasons for the increase are high additional cost, lack of personalization services. Coming up with a presentation necessitates that the majority of the effort goes into the content and the message you intend to convey. The visuals of a PowerPoint presentation can only be effective if it supplements and supports the story that is being told. Keeping this in mind our experts created Building Stronger Customer Increased Cart Abandonment And Churn Rate Due To Lack SA SS V to reduce the time that goes into designing the presentation. This way, you can concentrate on the message while our designers take care of providing you with the right template for the situation. This slide showcases the major reasons for the drop in e-commerce firm sales which are the increase in cart abandonment and churn rate. The key reasons for the increase are high additional cost, lack of personalization services.

Building Stronger Customer Increased Sales Due To Improved Cart Abandonment SA SS V
This slide showcases increased company sales due to a fall in cart abandonment and churn rate. Major reasons for the decrease are free delivery offers, adoption of various marketing strategies, etc. This modern and well-arranged Building Stronger Customer Increased Sales Due To Improved Cart Abandonment SA SS V provides lots of creative possibilities. It is very simple to customize and edit with the Powerpoint Software. Just drag and drop your pictures into the shapes. All facets of this template can be edited with Powerpoint, no extra software is necessary. Add your own material, put your images in the places assigned for them, adjust the colors, and then you can show your slides to the world, with an animated slide included. This slide showcases increased company sales due to a fall in cart abandonment and churn rate. Major reasons for the decrease are free delivery offers, adoption of various marketing strategies, etc.
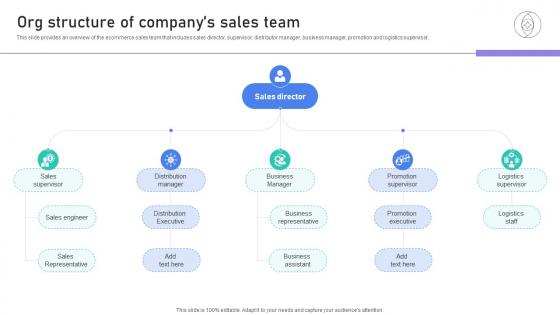
Building Stronger Customer Org Structure Of Companys Sales Team SA SS V
This slide provides an overview of the ecommerce sales team that includes sales director, supervisor, distributor manager, business manager, promotion and logistics supervisor. Slidegeeks has constructed Building Stronger Customer Org Structure Of Companys Sales Team SA SS V after conducting extensive research and examination. These presentation templates are constantly being generated and modified based on user preferences and critiques from editors. Here, you will find the most attractive templates for a range of purposes while taking into account ratings and remarks from users regarding the content. This is an excellent jumping-off point to explore our content and will give new users an insight into our top-notch PowerPoint Templates. This slide provides an overview of the ecommerce sales team that includes sales director, supervisor, distributor manager, business manager, promotion and logistics supervisor.
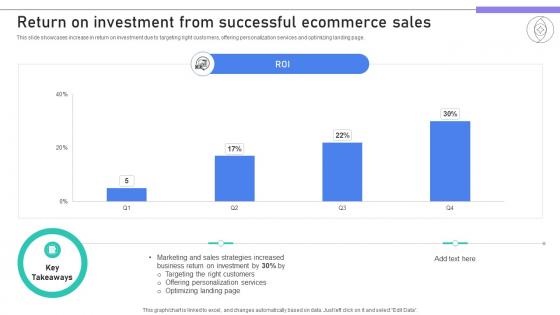
Building Stronger Customer Return On Investment From Successful Ecommerce Sales SA SS V
This slide showcases increase in return on investment due to targeting right customers, offering personalization services and optimizing landing page. Find a pre-designed and impeccable Building Stronger Customer Return On Investment From Successful Ecommerce Sales SA SS V. The templates can ace your presentation without additional effort. You can download these easy-to-edit presentation templates to make your presentation stand out from others. So, what are you waiting for Download the template from Slidegeeks today and give a unique touch to your presentation. This slide showcases increase in return on investment due to targeting right customers, offering personalization services and optimizing landing page.
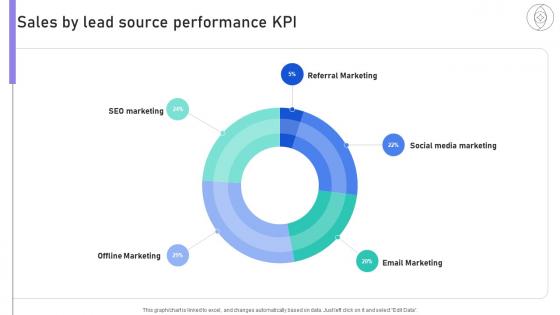
Building Stronger Customer Sales By Lead Source Performance KPI SA SS V
Boost your pitch with our creative Building Stronger Customer Sales By Lead Source Performance KPI SA SS V. Deliver an awe-inspiring pitch that will mesmerize everyone. Using these presentation templates you will surely catch everyones attention. You can browse the ppts collection on our website. We have researchers who are experts at creating the right content for the templates. So you do not have to invest time in any additional work. Just grab the template now and use them. Our Building Stronger Customer Sales By Lead Source Performance KPI SA SS V are topically designed to provide an attractive backdrop to any subject. Use them to look like a presentation pro.

Building Stronger Customer Sales Enhancement Due To Increased Conversion Rate SA SS V
This slide showcases increased company sales due to a rise in conversion rate and website traffic. Major reasons for the increase are website optimization, effective social media marketing, etc. Create an editable Building Stronger Customer Sales Enhancement Due To Increased Conversion Rate SA SS V that communicates your idea and engages your audience. Whether you are presenting a business or an educational presentation, pre-designed presentation templates help save time. Building Stronger Customer Sales Enhancement Due To Increased Conversion Rate SA SS V is highly customizable and very easy to edit, covering many different styles from creative to business presentations. Slidegeeks has creative team members who have crafted amazing templates. So, go and get them without any delay. This slide showcases increased company sales due to a rise in conversion rate and website traffic. Major reasons for the increase are website optimization, effective social media marketing, etc.

Strategies For Stabilizing Corporate Analysing Business Monthly Sales Revenue Report
This slide showcases the sales revenue report in order to monitor, analyze and track monthly sales trends. Key reasons for the decline include new competitors in the market, unable to adopt new technology, and production haltered. Create an editable Strategies For Stabilizing Corporate Analysing Business Monthly Sales Revenue Report that communicates your idea and engages your audience. Whether you are presenting a business or an educational presentation, pre-designed presentation templates help save time. Strategies For Stabilizing Corporate Analysing Business Monthly Sales Revenue Report is highly customizable and very easy to edit, covering many different styles from creative to business presentations. Slidegeeks has creative team members who have crafted amazing templates. So, go and get them without any delay. This slide showcases the sales revenue report in order to monitor, analyze and track monthly sales trends. Key reasons for the decline include new competitors in the market, unable to adopt new technology, and production haltered.

Strategies For Stabilizing Corporate Company Profit And Loss Dashboard With Income Statement
This slide provides a KPI dashboard that enables an organization to track revenue, expenses, and profit incurred in a specific period. It includes gross profit margin, OPEX ratio, operating profit margin, and net profit margin. There are so many reasons you need a Strategies For Stabilizing Corporate Company Profit And Loss Dashboard With Income Statement. The first reason is you can not spend time making everything from scratch, Thus, Slidegeeks has made presentation templates for you too. You can easily download these templates from our website easily. This slide provides a KPI dashboard that enables an organization to track revenue, expenses, and profit incurred in a specific period. It includes gross profit margin, OPEX ratio, operating profit margin, and net profit margin.
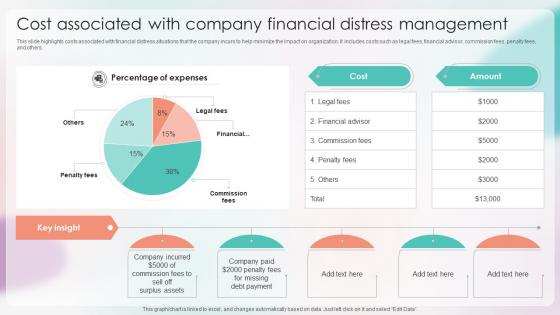
Strategies For Stabilizing Corporate Cost Associated With Company Financial Distress Management
This slide highlights costs associated with financial distress situations that the company incurs to help minimize the impact on organization. It includes costs such as legal fees, financial advisor, commission fees, penalty fees, and others. Do you have to make sure that everyone on your team knows about any specific topic I yes, then you should give Strategies For Stabilizing Corporate Cost Associated With Company Financial Distress Management a try. Our experts have put a lot of knowledge and effort into creating this impeccable Strategies For Stabilizing Corporate Cost Associated With Company Financial Distress Management. You can use this template for your upcoming presentations, as the slides are perfect to represent even the tiniest detail. You can download these templates from the Slidegeeks website and these are easy to edit. So grab these today This slide highlights costs associated with financial distress situations that the company incurs to help minimize the impact on organization. It includes costs such as legal fees, financial advisor, commission fees, penalty fees, and others.
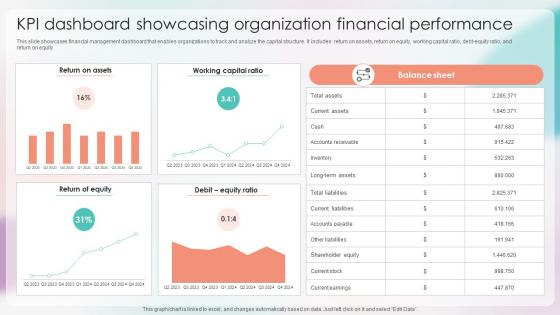
Strategies For Stabilizing Corporate KPI Dashboard Showcasing Organization Financial
This slide showcases financial management dashboard that enables organizations to track and analyze the capital structure. It includes return on assets, return on equity, working capital ratio, debt-equity ratio, and return on equity. Coming up with a presentation necessitates that the majority of the effort goes into the content and the message you intend to convey. The visuals of a PowerPoint presentation can only be effective if it supplements and supports the story that is being told. Keeping this in mind our experts created Strategies For Stabilizing Corporate KPI Dashboard Showcasing Organization Financial to reduce the time that goes into designing the presentation. This way, you can concentrate on the message while our designers take care of providing you with the right template for the situation. This slide showcases financial management dashboard that enables organizations to track and analyze the capital structure. It includes return on assets, return on equity, working capital ratio, debt-equity ratio, and return on equity.
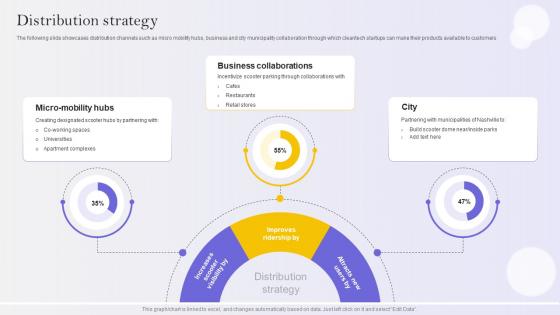
Distribution Strategy E Scooter Business Market Entry Strategy
The following slide showcases distribution channels such as micro mobility hubs, business and city municipality collaboration through which cleantech startups can make their products available to customersPresent like a pro with Distribution Strategy E Scooter Business Market Entry Strategy. Create beautiful presentations together with your team, using our easy-to-use presentation slides. Share your ideas in real-time and make changes on the fly by downloading our templates. So whether you are in the office, on the go, or in a remote location, you can stay in sync with your team and present your ideas with confidence. With Slidegeeks presentation got a whole lot easier. Grab these presentations today. The following slide showcases distribution channels such as micro mobility hubs, business and city municipality collaboration through which cleantech startups can make their products available to customers
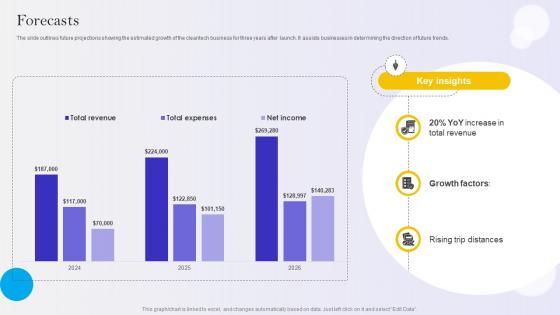
Forecasts E Scooter Business Market Entry Strategy
The slide outlines future projections showing the estimated growth of the cleantech business for three years after launch. It assists businesses in determining the direction of future trends.Slidegeeks is here to make your presentations a breeze with Forecasts E Scooter Business Market Entry Strategy With our easy-to-use and customizable templates, you can focus on delivering your ideas rather than worrying about formatting. With a variety of designs to choose from, you are sure to find one that suits your needs. And with animations and unique photos, illustrations, and fonts, you can make your presentation pop. So whether you are giving a sales pitch or presenting to the board, make sure to check out Slidegeeks first The slide outlines future projections showing the estimated growth of the cleantech business for three years after launch. It assists businesses in determining the direction of future trends.


 Continue with Email

 Home
Home


