icons
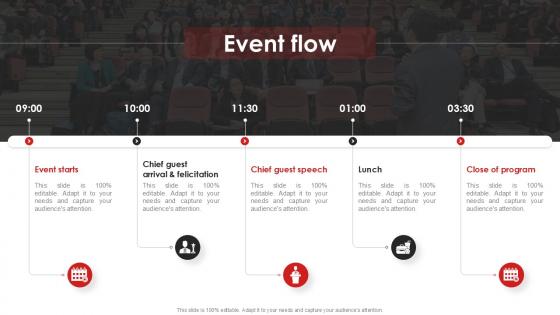
Event Flow Powerpoint Slide Presentation Guidelines
From laying roadmaps to briefing everything in detail, our templates are perfect for you. You can set the stage with your presentation slides. All you have to do is download these easy-to-edit and customizable templates. Event Flow Powerpoint Slide Presentation Guidelines will help you deliver an outstanding performance that everyone would remember and praise you for. Do download this presentation today. This slide provides a structured framework for planning and presenting events effectively. Designed to add clarity and professionalism, it helps you outline each phase of an event, ensuring smooth coordination and execution.
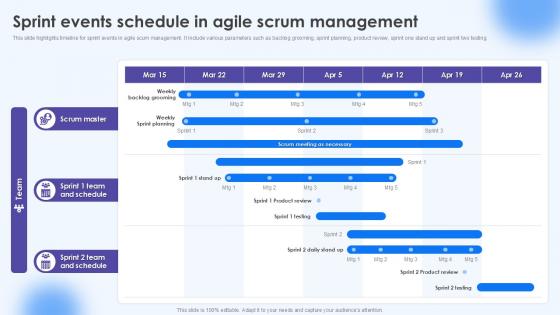
Sprint Events Schedule In Agile Scrum Management
Want to ace your presentation in front of a live audience Our Sprint Events Schedule In Agile Scrum Management can help you do that by engaging all the users towards you. Slidegeeks experts have put their efforts and expertise into creating these impeccable powerpoint presentations so that you can communicate your ideas clearly. Moreover, all the templates are customizable, and easy-to-edit and downloadable. Use these for both personal and commercial use. This template outlines timeline for sprint events in agile scrum management. It provides insights about milestones, including backlog grooming, sprint planning, product review, daily stand ups for different testing phases conducted by organization assuring structured sprint cycle.
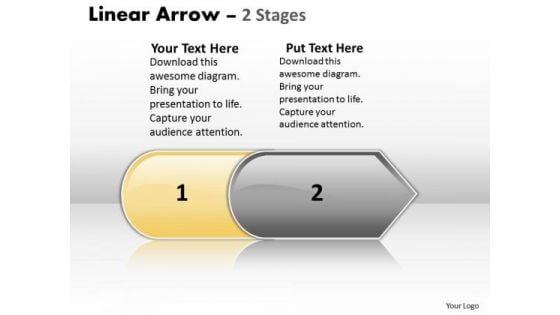
Marketing Ppt Linear Equations PowerPoint Arrow 2 Stages Business Plan Image
We present our marketing PPT linear equations PowerPoint arrow 2 stages business plan Image. Use our Arrows PowerPoint Templates because; now funnel your marketing strategies down the cone, stage by stage, refining as you go along. Use our Layers PowerPoint Templates because, There are various viable propositions available to further your commercial interests. Use our Shapes PowerPoint Templates because; Ring them out loud with your brilliant ideas. Use our Business PowerPoint Templates because, this one depicts the popular chart. Use our Process and Flows PowerPoint Templates because, getting it done in time is the key to success. Use these PowerPoint slides for presentations relating to abstract, algorithm, arrow, block diagram, business, chart, color, connection, design, development, diagram, direction, element, flow, graph, linear, linear diagram, management, organization, plan, process, section, segment, set, sign, solution, strategy, symbol, technology, vector. The prominent colors used in the PowerPoint template are Yellow, Gray, and White Add some body to your thoughts. They will fill out with our Marketing Ppt Linear Equations PowerPoint Arrow 2 Stages Business Plan Image.
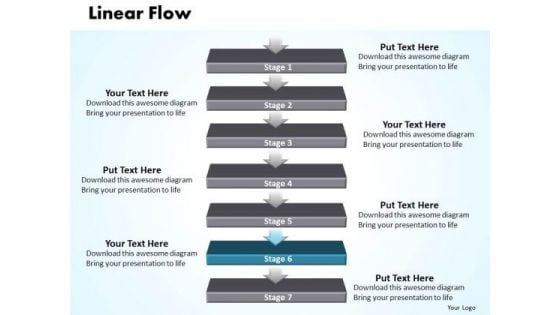
Success Ppt Non-linear PowerPoint Flow 7 Stages Time Management Design
We present our success PPT non-linear Powerpoint flow 7 stages time management design. Use our Arrows PowerPoint Templates because; Churn the wheels of the brains of your colleagues. Use our Layers PowerPoint Templates because, Business 3D Circular Puzzle:- Your business and plans for its growth consist of processes that are highly co-related. Use our Shapes PowerPoint Templates because, Present your views using our innovative slides and be assured of leaving a lasting impression. Use our Business PowerPoint Templates because, Marketing Strategy Business Template: - Maximizing sales of your product is the intended destination. Use our Process and Flows PowerPoint Templates because, this template with an image of helps you chart the course of your presentation. Use these PowerPoint slides for presentations relating to abstract, algorithm, arrow, block diagram, business, chart, color, connection, design, development, diagram, direction, element, flow, graph, linear, linear diagram, management, organization, plan, process, section, segment, set, sign, solution, strategy, symbol, technology, vector. The prominent colors used in the PowerPoint template are Blue, Gray, and Black Clear the blocks for your thoughts. Open up the pipeline with our Success Ppt Non-linear PowerPoint Flow 7 Stages Time Management Design.
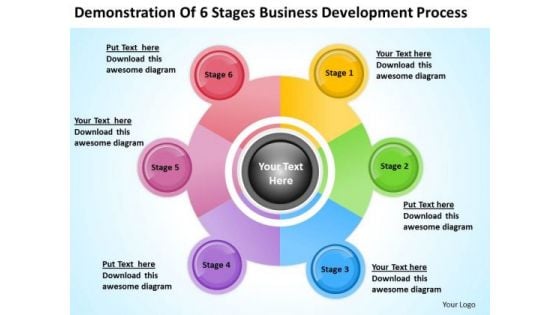
6 Stages Business Development Process Ppt Plan Outline PowerPoint Templates
We present our 6_stages_business_development_process_ppt_plan_outline_PowerPoint_templates.Use our Business PowerPoint Templates because Our PowerPoint Templates and Slides are the chords of your song. String them along and provide the lilt to your views. Download and present our Shapes PowerPoint Templates because Our PowerPoint Templates and Slides are created by a hardworking bunch of busybees. Always flitting around with solutions gauranteed to please. Download and present our Process and Flows PowerPoint Templates because Our PowerPoint Templates and Slides will generate and maintain the level of interest you desire. They will create the impression you want to imprint on your audience. Use our Circle Charts PowerPoint Templates because You will get more than you ever bargained for. Dispatch your thoughts on our 6 Stages Business Development Process Ppt Plan Outline PowerPoint Templates. They will take them the farthest possible.
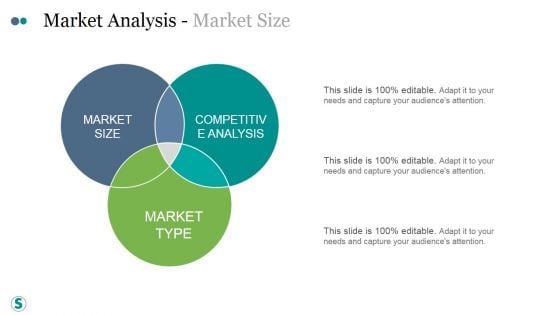
Market Analysis Market Size Ppt PowerPoint Presentation Microsoft
This is a market analysis market size ppt powerpoint presentation designs. This is a six stage process. The stages in this process are business, strategy, marketing, analysis, success, pie chart.
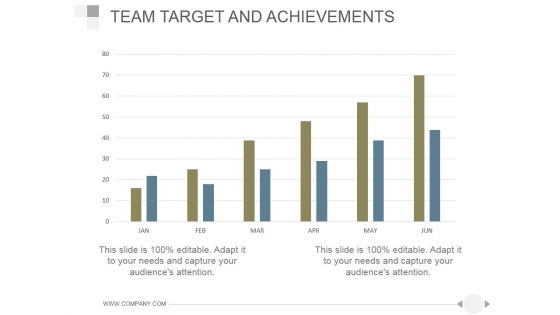
Team Target And Achievements Ppt PowerPoint Presentation Information
This is a team target and achievements ppt powerpoint presentation information. This is a six stage process. The stages in this process are chart graph, management, strategy, business, marketing.
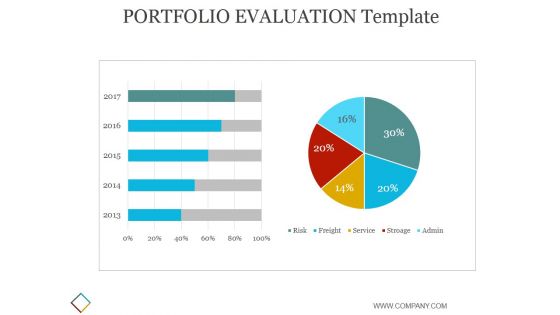
Portfolio Evaluation Template 1 Ppt PowerPoint Presentation Designs Download
This is a portfolio evaluation template 1 ppt powerpoint presentation designs download. This is a five stage process. The stages in this process are business, strategy, marketing, analysis, finance, chart and graph.
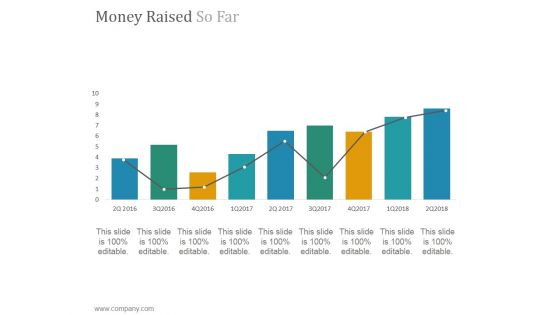
Money Raised So Far Ppt PowerPoint Presentation Layout
This is a money raised so far ppt powerpoint presentation layout. This is a nine stage process. The stages in this process are chart, bar graph, success, growth, marketing.
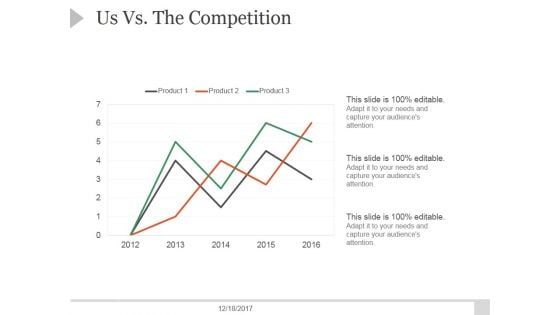
Us Vs The Competition Ppt PowerPoint Presentation Shapes
This is a us vs the competition ppt powerpoint presentation shapes. This is a three stage process. The stages in this process are chart graph, planning, business, marketing, strategy.

Lean Project Management Ppt PowerPoint Presentation Complete Deck With Slides
This is a lean project management ppt powerpoint presentation complete deck with slides. This is a one stage process. The stages in this process are business, strategy, finance, analysis, project management, chart and graph.
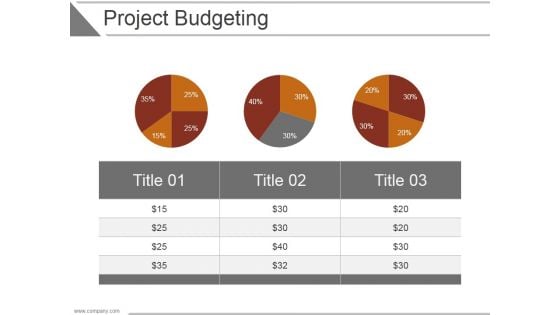
Project Budgeting Ppt PowerPoint Presentation Picture
This is a project budgeting ppt powerpoint presentation picture. This is a three stage process. The stages in this process are business, strategy, analysis, marketing, chart and graph, finance.
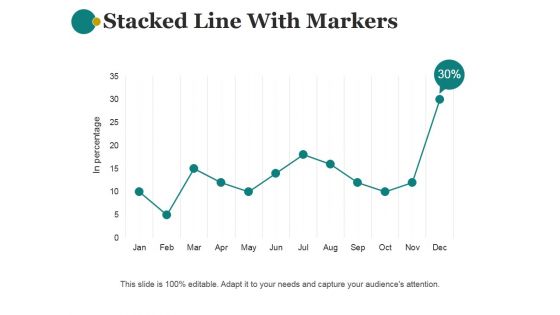
Stacked Line With Markers Template 1 Ppt PowerPoint Presentation Portfolio
This is a stacked line with markers template 1 ppt powerpoint presentation portfolio. This is a one stage process. The stages in this process are chart graph, marketing, planning ,business, management, strategy.
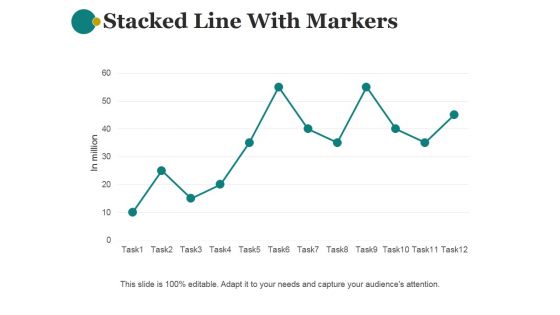
Stacked Line With Markers Template 2 Ppt PowerPoint Presentation Images
This is a stacked line with markers template 2 ppt powerpoint presentation images. This is a one stage process. The stages in this process are chart graph, marketing, planning ,business, management, strategy.
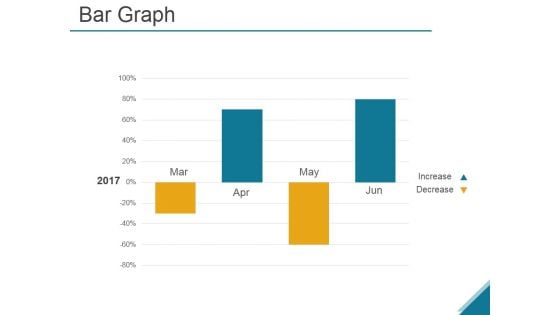
Bar Graph Ppt PowerPoint Presentation Infographic Template Background
This is a bar graph ppt powerpoint presentation infographic template background. This is a four stage process. The stages in this process are business, strategy, analysis, growth, chart and graph.
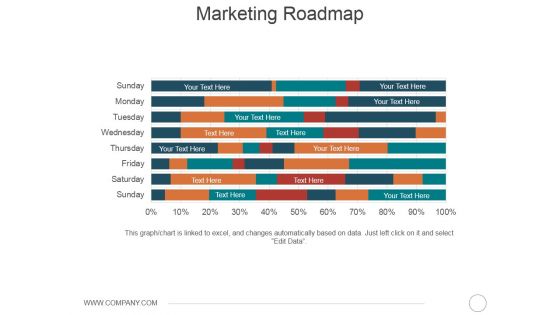
Marketing Roadmap Ppt PowerPoint Presentation Show Graphic Tips
This is a marketing roadmap ppt powerpoint presentation show graphic tips. This is a eight stage process. The stages in this process are business, marketing, strategy, analysis, bar chart.
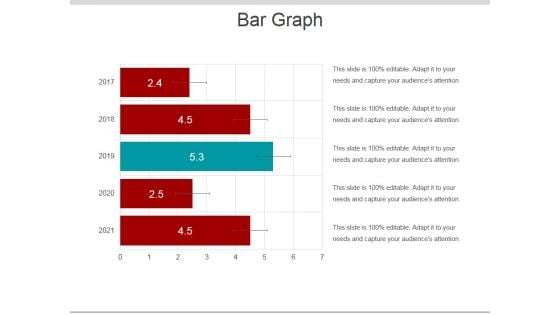
Bar Graph Ppt PowerPoint Presentation Infographic Template Deck
This is a bar graph ppt powerpoint presentation infographic template deck. This is a five stage process. The stages in this process are bar chart, business, marketing, strategy, planning.
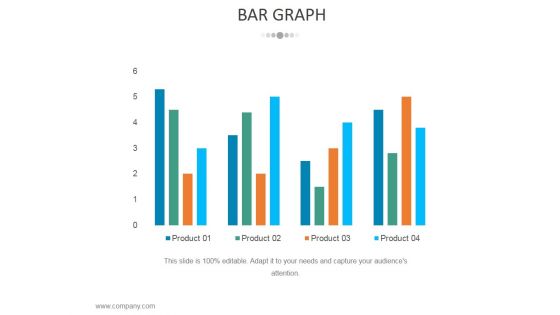
Bar Graph Ppt PowerPoint Presentation Ideas Sample
This is a bar graph ppt powerpoint presentation ideas sample. This is a four stage process. The stages in this process are business, strategy, marketing, analysis, chart and graph, bar graph.
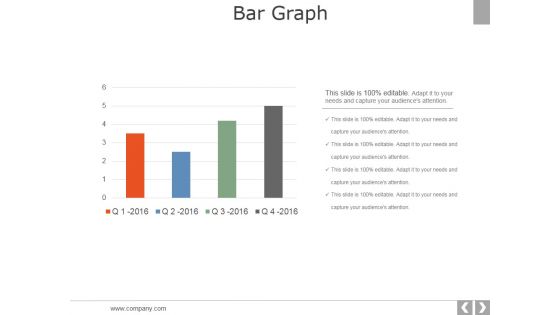
Bar Graph Ppt PowerPoint Presentation Styles Picture
This is a bar graph ppt powerpoint presentation styles picture. This is a four stage process. The stages in this process are business, strategy, marketing, analysis, chart and graph, bar graph.
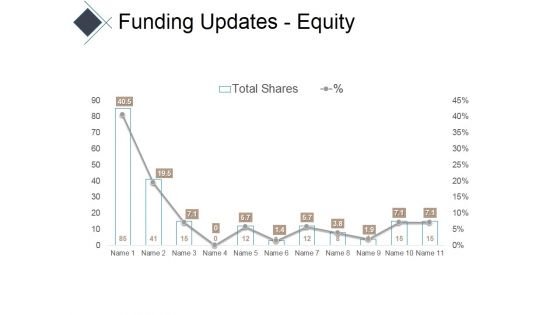
Funding Updates Equity Ppt PowerPoint Presentation Infographic Template Portfolio
This is a funding updates equity ppt powerpoint presentation infographic template portfolio. This is a eleven stage process. The stages in this process are charts, area, marketing, business, success.
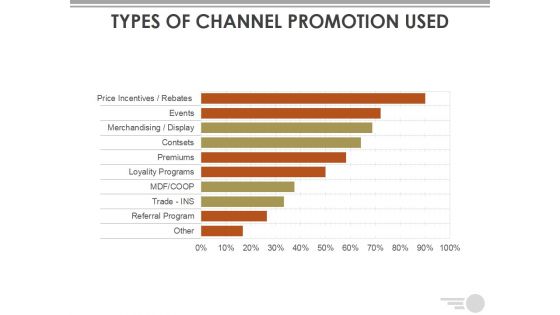
Types Of Channel Promotion Used Ppt PowerPoint Presentation Outline Display
This is a types of channel promotion used ppt powerpoint presentation outline display. This is a ten stage process. The stages in this process are bar graph, business, marketing, strategy, charts.
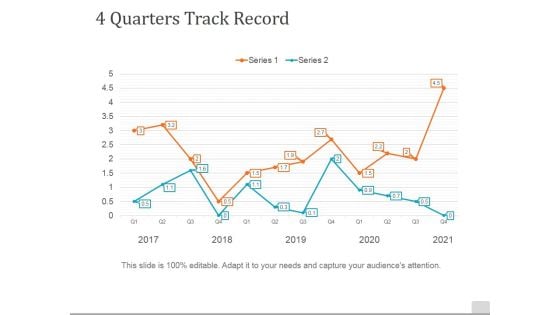
4 Quarters Track Record Template 1 Ppt PowerPoint Presentation Slides Example
This is a 4 quarters track record template 1 ppt powerpoint presentation slides example. This is a two stage process. The stages in this process are management, business, marketing, graph, line chart.
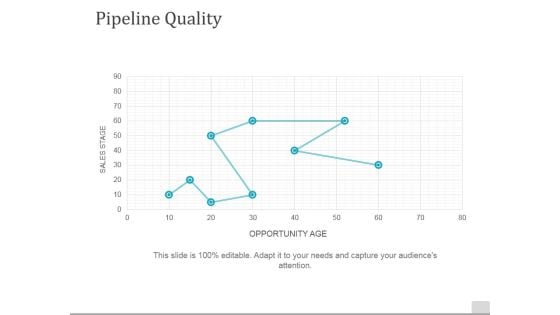
Pipeline Quality Template 2 Ppt PowerPoint Presentation Inspiration Show
This is a pipeline quality template 2 ppt powerpoint presentation inspiration show. This is a one stage process. The stages in this process are sales stage, opportunity age, pipeline, quality, line chart.
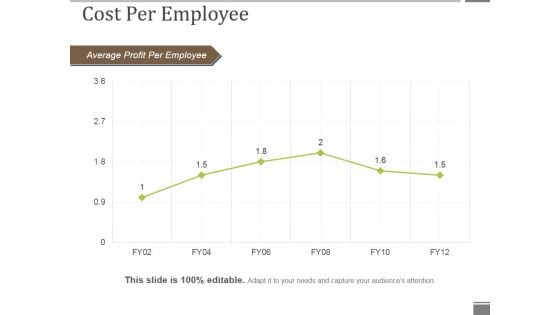
Cost Per Employee Ppt PowerPoint Presentation Model Graphics Download
This is a cost per employee ppt powerpoint presentation model graphics download. This is a six stage process. The stages in this process are average profit per employee, line chart, business, marketing, management.
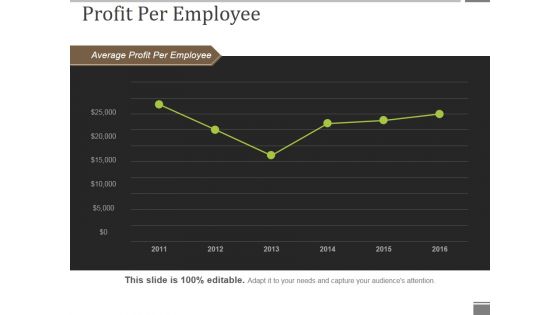
Profit Per Employee Ppt PowerPoint Presentation Show Portfolio
This is a profit per employee ppt powerpoint presentation show portfolio. This is a six stage process. The stages in this process are average profit per employee, line chart, business, marketing, success.
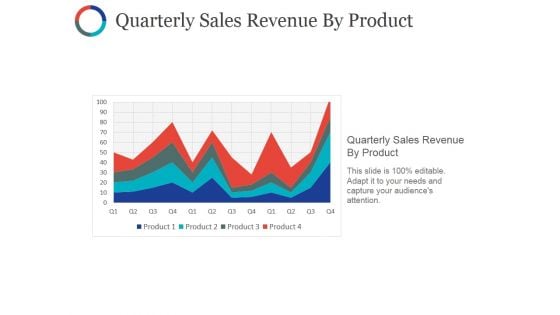
Quarterly Sales Revenue By Product Ppt PowerPoint Presentation Styles Slides
This is a quarterly sales revenue by product ppt powerpoint presentation styles slides. This is a four stage process. The stages in this process are quarterly sales revenue by product, charts, sales, business, success.
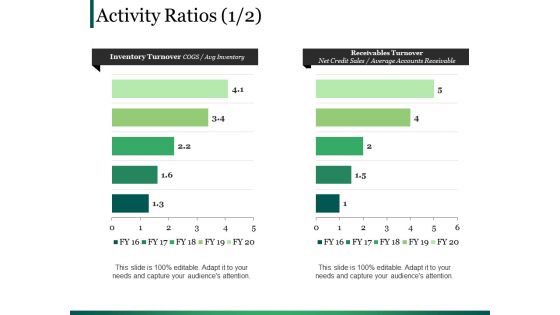
Activity Ratios Template 1 Ppt PowerPoint Presentation Portfolio Graphics
This is a activity ratios template 1 ppt powerpoint presentation portfolio graphics. This is a two stage process. The stages in this process are finance, chart graph, marketing, planning, analysis.
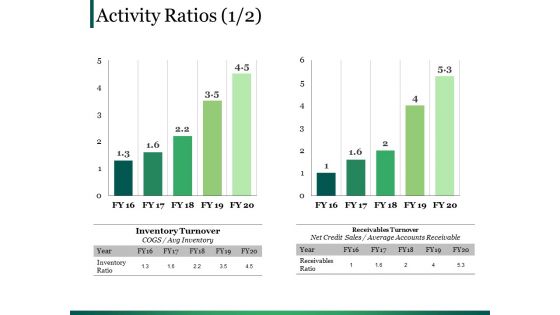
Activity Ratios Template 4 Ppt PowerPoint Presentation Portfolio Backgrounds
This is a activity ratios template 4 ppt powerpoint presentation portfolio backgrounds. This is a two stage process. The stages in this process are finance, chart graph, marketing, planning, analysis.
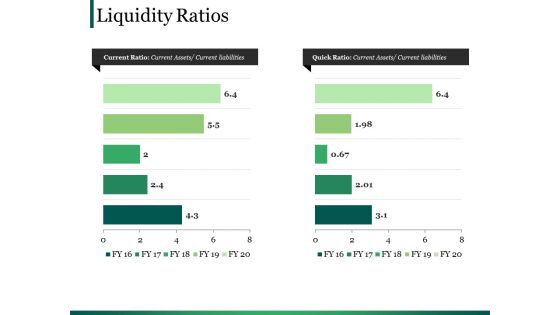
Liquidity Ratios Template Ppt PowerPoint Presentation Outline Elements
This is a liquidity ratios template ppt powerpoint presentation outline elements. This is a two stage process. The stages in this process are finance, chart graph, marketing, planning, analysis.
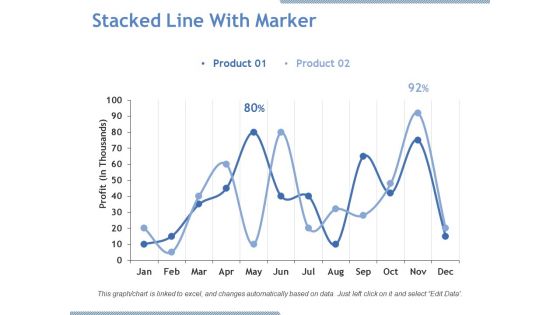
Stacked Line With Marker Ppt PowerPoint Presentation Pictures Graphics Download
This is a stacked line with marker ppt powerpoint presentation pictures graphics download. This is a two stage process. The stages in this process are product, profit, line chart, business, growth.
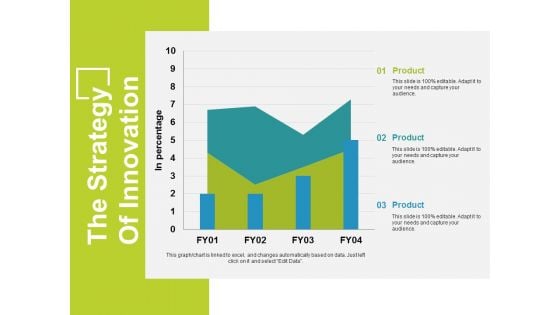
The Strategy Of Innovation Template 2 Ppt PowerPoint Presentation Professional Graphic Images
This is a the strategy of innovation template 2 ppt powerpoint presentation professional graphic images. This is a three stage process. The stages in this process are business, area chart, finance, marketing, strategy.
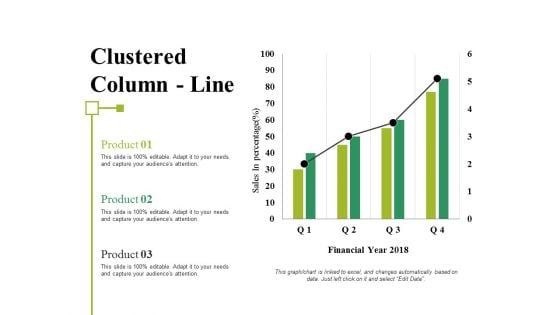
Clustered Column Line Ppt PowerPoint Presentation Inspiration Visual Aids
This is a clustered column line ppt powerpoint presentation inspiration visual aids. This is a four stage process. The stages in this process are business, marketing, strategy, planning, bar chart.
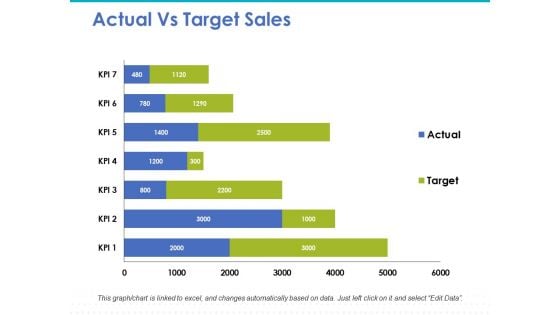
Actual Vs Target Sales Ppt PowerPoint Presentation Slides Template
This is a actual vs target sales ppt powerpoint presentation slides template. This is a seven stage process. The stages in this process are bar chart, marketing, strategy, finance, planning.
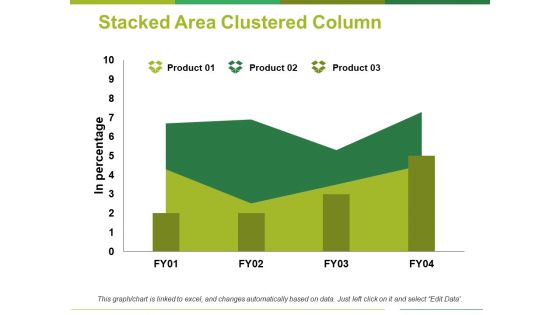
Stacked Area Clustered Column Ppt PowerPoint Presentation Professional Clipart
This is a stacked area clustered column ppt powerpoint presentation professional clipart. This is a three stage process. The stages in this process are product, in percentage, area chart.
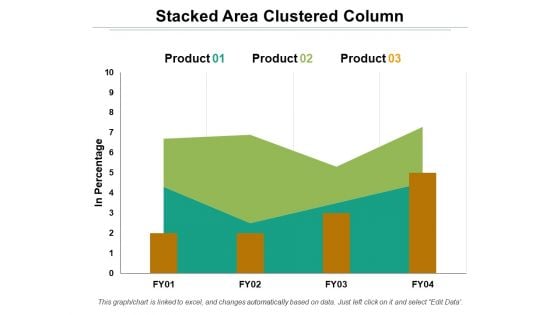
Stacked Area Clustered Column Ppt PowerPoint Presentation Layouts Templates
This is a stacked area clustered column ppt powerpoint presentation layouts templates. This is a three stage process. The stages in this process are product, in percentage, area chart.
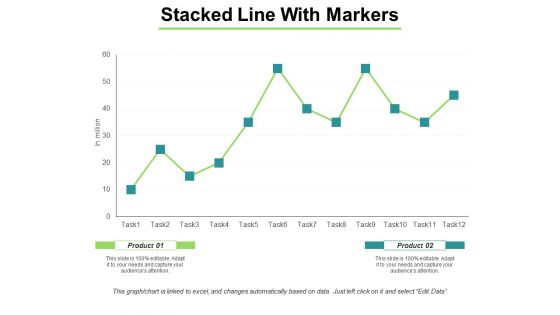
Stacked Line With Markers Ppt PowerPoint Presentation Pictures Background Designs
This is a stacked line with markers ppt powerpoint presentation pictures background designs. This is a two stage process. The stages in this process are line chart, marketing, strategy, planning, finance.
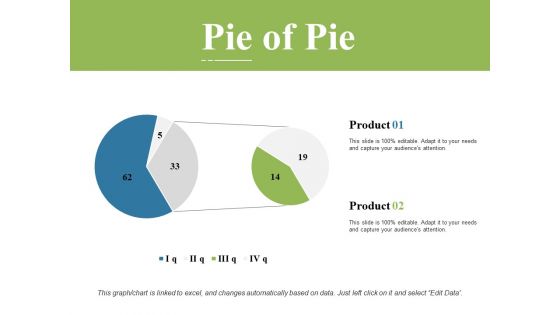
Pie Of Pie Ppt PowerPoint Presentation Styles Graphics Template
This is a pie of pie ppt powerpoint presentation styles graphics template. This is a two stage process. The stages in this process are Pie chart, finance, marketing, management, investment.
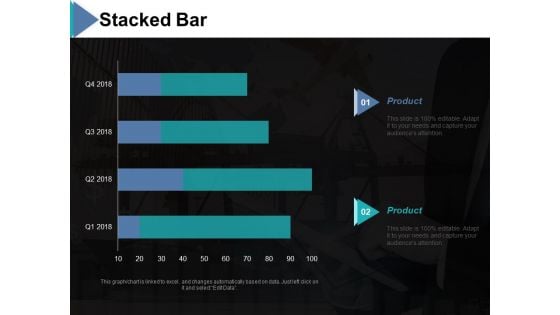
Stacked Bar Ppt PowerPoint Presentation Model Graphics
This is a stacked bar ppt powerpoint presentation model graphics. This is a two stage process. The stages in this process are stacked bar, product, chart and graph, finance, business.
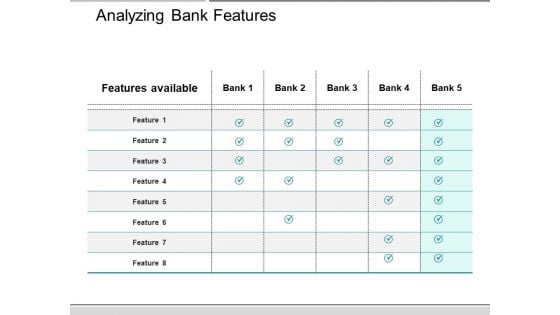
Analyzing Bank Features Ppt PowerPoint Presentation Professional Background
This is a analyzing bank features ppt powerpoint presentation professional background. This is a six stage process. The stages in this process are comparison chart, comparison table, comparison matrix.
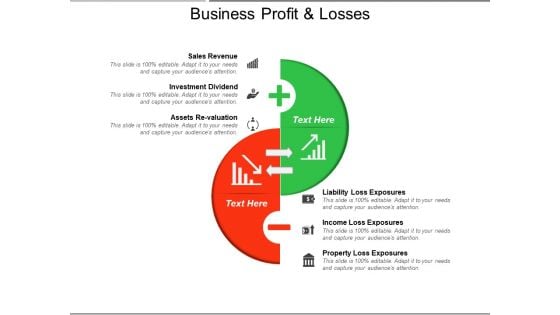
Business Profit And Losses Ppt PowerPoint Presentation Summary Outline
This is a business profit and losses ppt powerpoint presentation summary outline. This is a two stage process. The stages in this process are comparison chart, comparison table, comparison matrix.
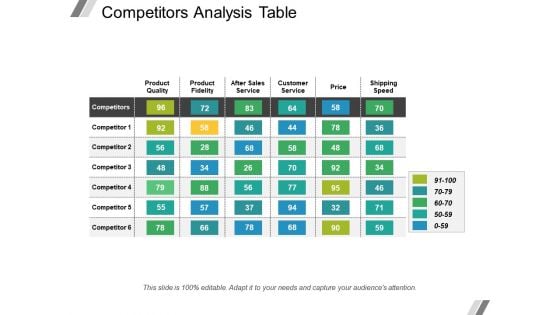
Competitors Analysis Table Ppt PowerPoint Presentation Layouts Example Introduction
This is a competitors analysis table ppt powerpoint presentation layouts example introduction. This is a seven stage process. The stages in this process are comparison chart, comparison table, comparison matrix.
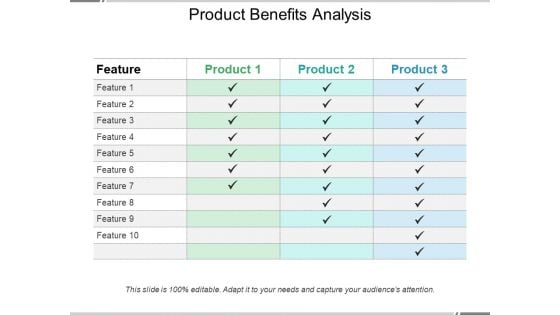
Product Benefits Analysis Ppt PowerPoint Presentation Summary Background
This is a product benefits analysis ppt powerpoint presentation summary background. This is a four stage process. The stages in this process are comparison chart, comparison table, comparison matrix.
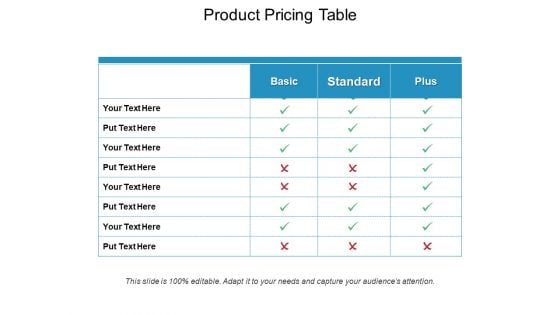
Product Pricing Table Ppt PowerPoint Presentation File Deck
This is a product pricing table ppt powerpoint presentation file deck. This is a four stage process. The stages in this process are comparison chart, comparison table, comparison matrix.
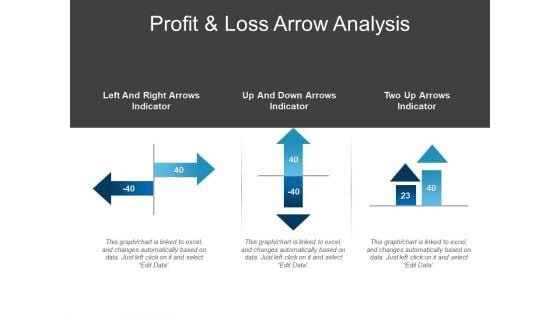
Profit And Loss Arrow Analysis Ppt PowerPoint Presentation Infographic Template Model
This is a profit and loss arrow analysis ppt powerpoint presentation infographic template model. This is a three stage process. The stages in this process are comparison chart, comparison table, comparison matrix.
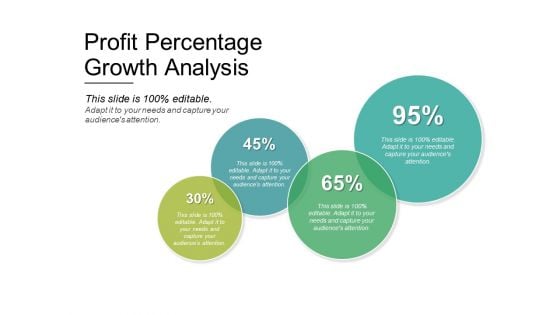
Profit Percentage Growth Analysis Ppt PowerPoint Presentation Layouts Graphics Tutorials
This is a profit percentage growth analysis ppt powerpoint presentation layouts graphics tutorials. This is a four stage process. The stages in this process are comparison chart, comparison table, comparison matrix.
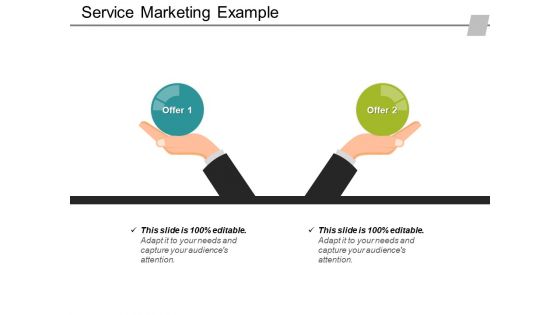
Service Marketing Example Ppt PowerPoint Presentation Styles Example File
This is a service marketing example ppt powerpoint presentation styles example file. This is a two stage process. The stages in this process are comparison chart, comparison table, comparison matrix.
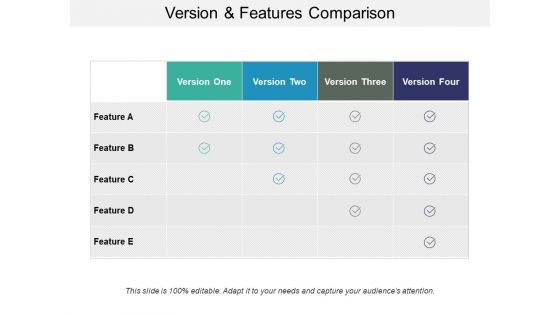
Version And Features Comparison Ppt PowerPoint Presentation Portfolio Example Topics
This is a version and features comparison ppt powerpoint presentation portfolio example topics. This is a five stage process. The stages in this process are comparison chart, comparison table, comparison matrix.
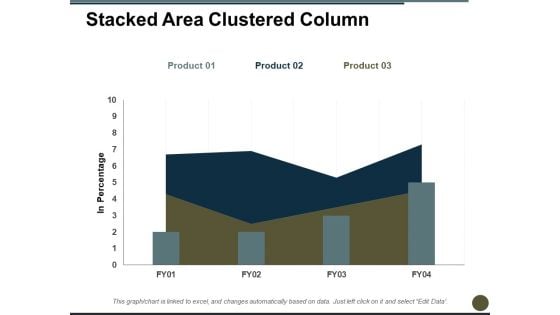
Stacked Area Clustered Column Ppt PowerPoint Presentation Professional Graphics
This is a stacked area clustered column ppt powerpoint presentation professional graphics. This is a three stage process. The stages in this process are in percentage, bar chart, product, growth, year.
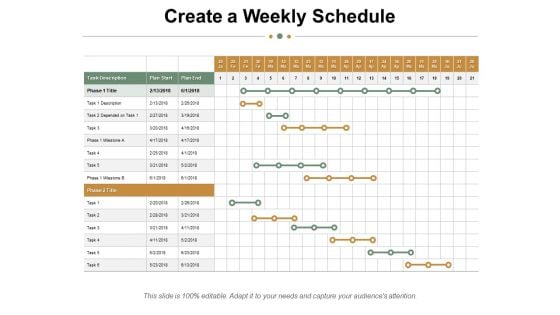
Create A Weekly Schedule Ppt PowerPoint Presentation Styles Background Image
This is a create a weekly schedule ppt powerpoint presentation styles background image. This is a four stage process. The stages in this process are table, chart, task description, plan start, plan end.
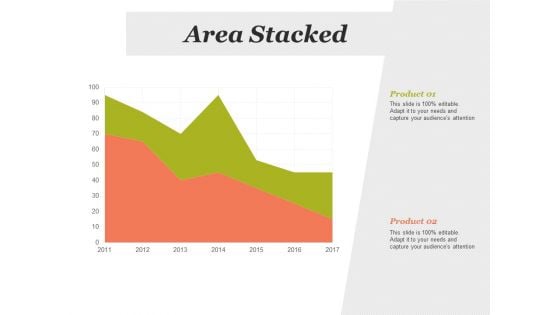
Area Stacked Analysis Ppt PowerPoint Presentation Inspiration Slideshow
This is a area stacked analysis ppt powerpoint presentation inspiration slideshow. This is a two stage process. The stages in this process are area chart, finance, marketing, strategy, business.
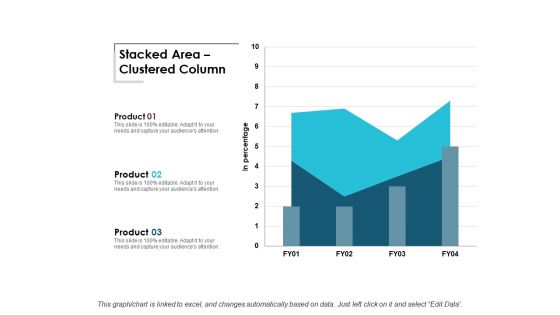
Stacked Area Clustered Column Ppt Powerpoint Presentation Infographic Template Background Images
This is a stacked area clustered column ppt powerpoint presentation infographic template background images. This is a three stage process. The stages in this process are area chart, finance, marketing, management, investment.
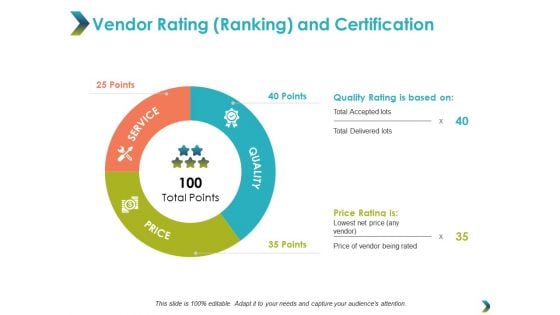
Vendor Rating Ranking And Certification Ppt Powerpoint Presentation Model Background Designs
This is a vendor rating ranking and certification ppt powerpoint presentation model background designs. This is a three stage process. The stages in this process are donut chart, finance, marketing, business, analysis.
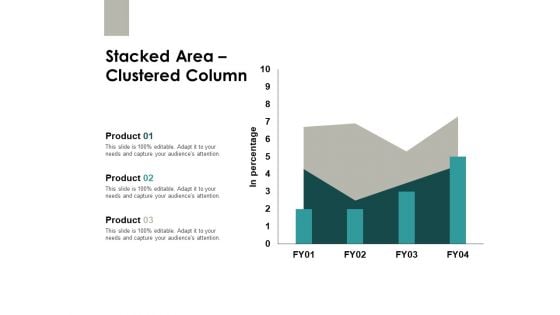
Stacked Area Clustered Column Finance Ppt PowerPoint Presentation Slides Images
This is a stacked area clustered column finance ppt powerpoint presentation slides images. This is a three stage process. The stages in this process are area chart, finance, marketing, analysis, investment.
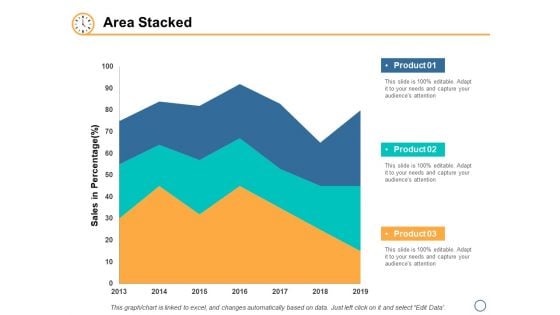
Area Stacked Finance Ppt PowerPoint Presentation Inspiration Graphics Download
This is a area stacked finance ppt powerpoint presentation inspiration graphics download. This is a three stage process. The stages in this process are area chart, finance, marketing, analysis, investment.
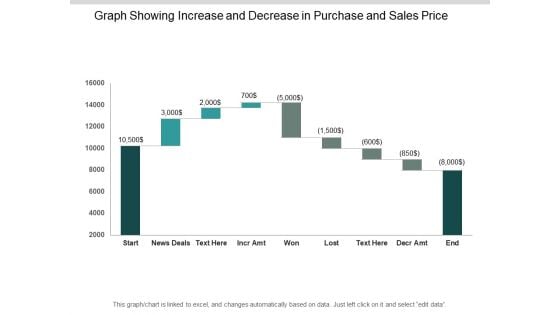
Graph Showing Increase And Decrease In Purchase And Sales Price Ppt PowerPoint Presentation Outline Gallery
This is a graph showing increase and decrease in purchase and sales price ppt powerpoint presentation outline gallery. This is a nine stage process. The stages in this process are sales waterfall, waterfall chart, business.
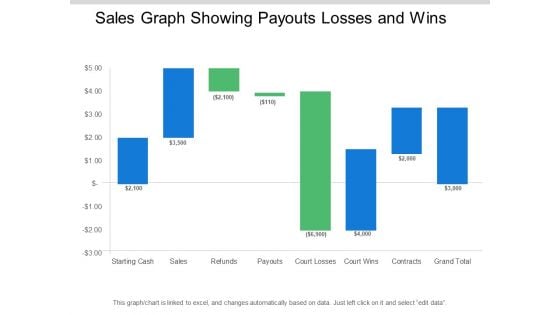
Sales Graph Showing Payouts Losses And Wins Ppt PowerPoint Presentation Pictures Designs Download
This is a sales graph showing payouts losses and wins ppt powerpoint presentation pictures designs download. This is a eight stage process. The stages in this process are sales waterfall, waterfall chart, business.
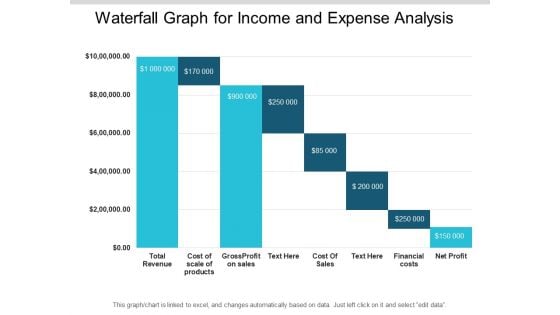
Waterfall Graph For Income And Expense Analysis Ppt PowerPoint Presentation File Deck
This is a waterfall graph for income and expense analysis ppt powerpoint presentation file deck. This is a eight stage process. The stages in this process are sales waterfall, waterfall chart, business.
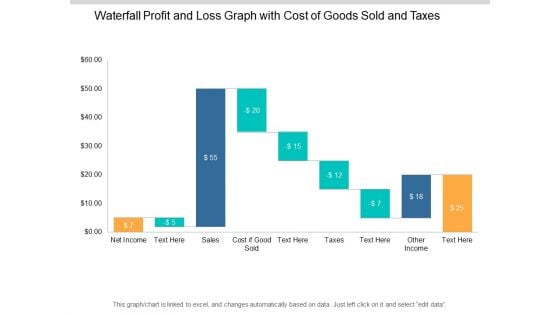
Waterfall Profit And Loss Graph With Cost Of Goods Sold And Taxes Ppt PowerPoint Presentation Show Slideshow
This is a waterfall profit and loss graph with cost of goods sold and taxes ppt powerpoint presentation show slideshow. This is a nine stage process. The stages in this process are sales waterfall, waterfall chart, business.

Algorithm Graph Pattern Matching Ppt PowerPoint Presentation Inspiration Background Images
This is a algorithm graph pattern matching ppt powerpoint presentation inspiration background images. This is a two stage process. The stages in this process are graph theory, chart theory, business.
Graph Model Showing Relation Between Objects Ppt PowerPoint Presentation Summary Graphics Tutorials
This is a graph model showing relation between objects ppt powerpoint presentation summary graphics tutorials. This is a two stage process. The stages in this process are graph theory, chart theory, business.

 Home
Home