icons
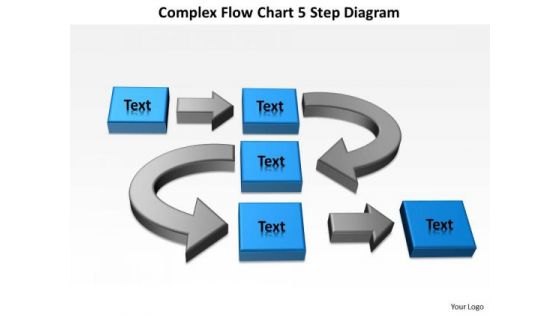
Flow Chart 5 Step Diagram Writing Business Plan For PowerPoint Templates
We present our flow chart 5 step diagram writing business plan for PowerPoint templates.Use our Boxes PowerPoint Templates because You are an avid believer in ethical practices. Highlight the benefits that accrue with our PowerPoint Templates and Slides. Present our Arrows PowerPoint Templates because Our PowerPoint Templates and Slides ensures Effective communication. They help you put across your views with precision and clarity. Use our Shapes PowerPoint Templates because You can Zap them with our PowerPoint Templates and Slides. See them reel under the impact. Present our Process and Flows PowerPoint Templates because You should Kick up a storm with our PowerPoint Templates and Slides. The heads of your listeners will swirl with your ideas. Download and present our Business PowerPoint Templates because Our PowerPoint Templates and Slides will fulfill your every need. Use them and effectively satisfy the desires of your audience.Use these PowerPoint slides for presentations relating to process, workflow, flow, diagram, flowchart, business, chart, plan, concept, chain, design, engineering, algorithm, organisation, process chain, process management, cog, gear, work-flow, flow chart, procedure, information, software, gearwheel, cogwheel, 3d. The prominent colors used in the PowerPoint template are Blue, Gray, Black. Have the last laugh with our Flow Chart 5 Step Diagram Writing Business Plan For PowerPoint Templates. Make sure your presentation gets the attention it deserves.
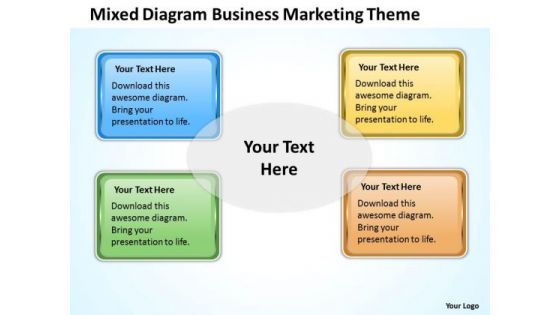
Diagram Business Marketing Theme Ppt Examples Of Plan Outline PowerPoint Templates
We present our diagram business marketing theme ppt examples of plan outline PowerPoint templates.Download and present our Technology PowerPoint Templates because you can Set pulses racing with our PowerPoint Templates and Slides. They will raise the expectations of your team. Download and present our Competition PowerPoint Templates because Our PowerPoint Templates and Slides will let you Illuminate the road ahead to Pinpoint the important landmarks along the way. Download and present our Boxes PowerPoint Templates because Our PowerPoint Templates and Slides has conjured up a web of all you need with the help of our great team. Use them to string together your glistening ideas. Present our Process and Flows PowerPoint Templates because Our PowerPoint Templates and Slides are topically designed to provide an attractive backdrop to any subject. Download our Business PowerPoint Templates because Our PowerPoint Templates and Slides will let you Hit the right notes. Watch your audience start singing to your tune.Use these PowerPoint slides for presentations relating to Chart, flow, organization, flowchart, box, vector, chain, information, 3d, network, isolated, program, business, blank, plan, concept, arrow, sign, teamwork, symbol, organisation, diagram, circle, graphic, process, workflow, technology, shape, management, graph, connection, solution, design, colorful, empty, procedure, connect, organize, background, work, structure, block. The prominent colors used in the PowerPoint template are Yellow, Green, Blue. You are destined for fame. Our Diagram Business Marketing Theme Ppt Examples Of Plan Outline PowerPoint Templates ensure acclaim for your ideas.
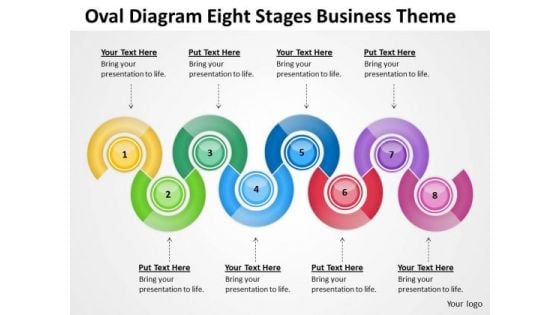
Oval Diagram Eight Stages Business Theme Ppt Profit Plan PowerPoint Templates
We present our oval diagram eight stages business theme ppt profit plan PowerPoint templates.Use our Marketing PowerPoint Templates because our PowerPoint Templates and Slides will give your ideas the shape. Present our Finance PowerPoint Templates because It can Conjure up grand ideas with our magical PowerPoint Templates and Slides. Leave everyone awestruck by the end of your presentation. Download and present our Curves and Lines PowerPoint Templates because Our PowerPoint Templates and Slides will definately Enhance the stature of your presentation. Adorn the beauty of your thoughts with their colourful backgrounds. Download and present our Business PowerPoint Templates because It is Aesthetically crafted by artistic young minds. Our PowerPoint Templates and Slides are designed to display your dexterity. Present our Shapes PowerPoint Templates because It can Conjure up grand ideas with our magical PowerPoint Templates and Slides. Leave everyone awestruck by the end of your presentation.Use these PowerPoint slides for presentations relating to Ideas, diagram, leadership, program, coding, business, blank, plan, engineering, arrow, sign, line, presentation, decisions, scheme, graphic, flowchart, drawing, digital, marketing, technology, development, computer, graph, connection, chart, strategy, division, research, workshop, design, science, selective, empty, organization, link, neat, brainstorming, software, concepts, design element. The prominent colors used in the PowerPoint template are Yellow, Green, Purple. Examine the facts in all their combinations. Run the comb through with our Oval Diagram Eight Stages Business Theme Ppt Profit Plan PowerPoint Templates.
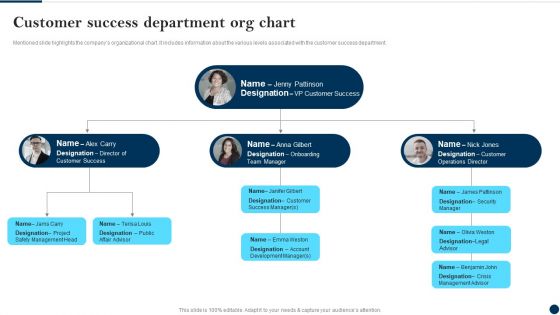
Customer Success Department Org Chart Client Success Best Practices Guide Diagrams PDF
Mentioned slide highlights the companys organizational chart. It includes information about the various levels associated with the customer success department.Slidegeeks has constructed Customer Success Department Org Chart Client Success Best Practices Guide Diagrams PDF after conducting extensive research and examination. These presentation templates are constantly being generated and modified based on user preferences and critiques from editors. Here, you will find the most attractive templates for a range of purposes while taking into account ratings and remarks from users regarding the content. This is an excellent jumping-off point to explore our content and will give new users an insight into our top-notch PowerPoint Templates.
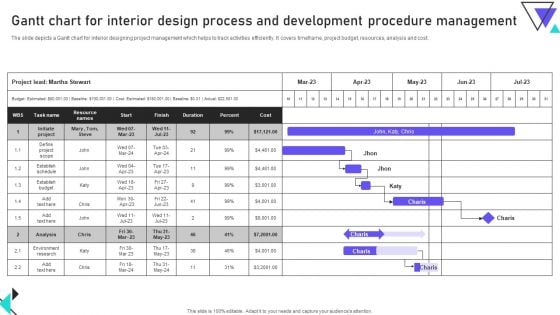
Gantt Chart For Interior Design Process And Development Procedure Management Diagrams PDF
The slide depicts a Gantt chart for interior designing project management which helps to track activities efficiently. It covers timeframe, project budget, resources, analysis and cost. Showcasing this set of slides titled Gantt Chart For Interior Design Process And Development Procedure Management Diagrams PDF. The topics addressed in these templates are Cost, Establish Budget, Development Procedure Management. All the content presented in this PPT design is completely editable. Download it and make adjustments in color, background, font etc. as per your unique business setting.

Ppt Background Multicolored Sequential Demo Create Flow Chart PowerPoint Diagram 4 Image
We present our PPT Background multicolored sequential demo create flow Chart PowerPoint diagram 4 Image. Use our Business PowerPoint Templates because, Different people with differing ideas and priorities perform together to score. Use our Shapes PowerPoint Templates because; amplify your thoughts via our appropriate templates. Use our Design PowerPoint Templates because; Show them how to churn out fresh ideas. Use our Signs PowerPoint Templates because, But you have an idea of which you are sure. Use our Process and Flows PowerPoint Templates because; Highlight the various ways in which we can maintain its efficiency. Use these PowerPoint slides for presentations relating to abstract, algorithm, arrow, business, chart, connection, design, development, diagram, direction, element, flow, graph, linear, linear diagram, management, organization, plan, process, section, segment, set, sign, solution, strategy, symbol, vector. The prominent colors used in the PowerPoint template are Green, Gray, and Black Do not go purely by the face value of our Ppt Background Multicolored Sequential Demo Create Flow Chart PowerPoint Diagram 4 Image. Dwell on them and you will discover lot's more.
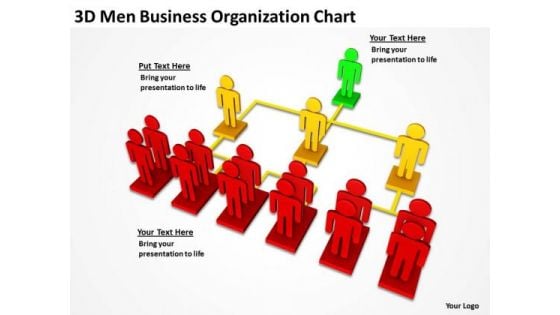
Business Process Flow Diagram Organization Chart PowerPoint Templates Ppt Backgrounds For Slides
We present our business process flow diagram organization chart PowerPoint templates PPT backgrounds for slides.Download our Communication PowerPoint Templates because Our PowerPoint Templates and Slides will let you Leave a lasting impression to your audiences. They possess an inherent longstanding recall factor. Use our Business PowerPoint Templates because you should Experience excellence with our PowerPoint Templates and Slides. They will take your breath away. Download and present our Process and Flows PowerPoint Templates because You canTake a leap off the starting blocks with our PowerPoint Templates and Slides. They will put you ahead of the competition in quick time. Download our Shapes PowerPoint Templates because You can Raise a toast with our PowerPoint Templates and Slides. Spread good cheer amongst your audience. Use our Signs PowerPoint Templates because Our PowerPoint Templates and Slides will provide weight to your words. They will bring out the depth of your thought process.Use these PowerPoint slides for presentations relating to 3d, Business, Businessman, Chart, Communication, Community, Connection, Cooperation, Corporation, Diagram, Domination, Employment, Entrepreneur, Flow, Flowchart, Graphic, Group, Hierarchy, Human, Isolated, Job, Leadership, Level, Management, Manager, Men, Network, Occupation, Office, Organization, Organized, Partnership, People, Person, Planning, Promotion, Recruitment, Relationship, Resources, Solution, Strategy, Structure, Team, Teamwork. The prominent colors used in the PowerPoint template are Green, Yellow, Red. We assure you our business process flow diagram organization chart PowerPoint templates PPT backgrounds for slides are designed by a team of presentation professionals. Use our Communication PowerPoint templates and PPT Slides provide you with a vast range of viable options. Select the appropriate ones and just fill in your text. We assure you our business process flow diagram organization chart PowerPoint templates PPT backgrounds for slides are incredible easy to use. Professionals tell us our Connection PowerPoint templates and PPT Slides look good visually. The feedback we get is that our business process flow diagram organization chart PowerPoint templates PPT backgrounds for slides are specially created by a professional team with vast experience. They diligently strive to come up with the right vehicle for your brilliant Ideas. You can be sure our Corporation PowerPoint templates and PPT Slides will generate and maintain the level of interest you desire. They will create the impression you want to imprint on your audience. Bubble up to the top with our Business Process Flow Diagram Organization Chart PowerPoint Templates Ppt Backgrounds For Slides. You will come out on top.
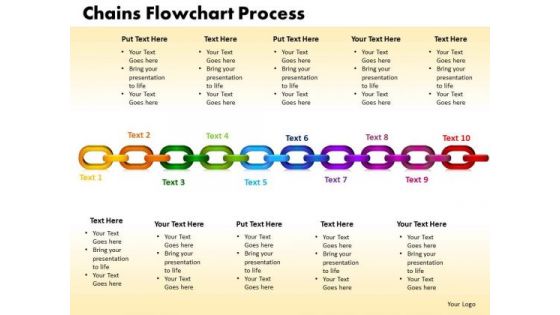
PowerPoint Designs Chains Flowchart Process Leadership Ppt Theme
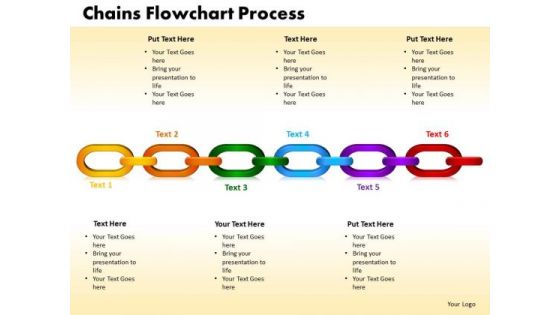
PowerPoint Designs Chains Flowchart Process Leadership PPT Theme-This is a very simple Chain Flow Chart Diagram. It can be used to express ideas, logical chains, or organizational hierarchies.-PowerPoint Designs Chains Flowchart Process Leadership PPT Theme Our PowerPoint Designs Chains Flowchart Process Leadership Ppt Theme are not a figment of imagination. They actually help in day to day aspects.
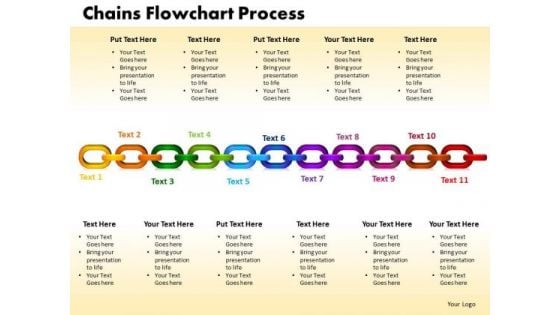
PowerPoint Designs Chains Flowchart Process Marketing Ppt Themes
PowerPoint Designs Chains Flowchart Process Marketing PPT Themes-This is a very simple Chain Flow Chart Diagram. It can be used to express ideas, logical chains, or organizational hierarchies.-PowerPoint Designs Chains Flowchart Process Marketing PPT Themes Be the diva of the dais with our PowerPoint Designs Chains Flowchart Process Marketing Ppt Themes. Display a dapper attitude with your thoughts.
PowerPoint Themes Chains Flowchart Process Company Ppt Slide
PowerPoint Themes Chains Flowchart Process Company PPT Slide-This is a very simple Chain Flow Chart Diagram. It can be used to express ideas, logical chains, or organizational hierarchies.-PowerPoint Themes Chains Flowchart Process Company PPT Slide Operate efficiently with our PowerPoint Themes Chains Flowchart Process Company Ppt Slide. Download without worries with our money back guaranteee.
Executive Summary Ppt PowerPoint Presentation Summary Themes
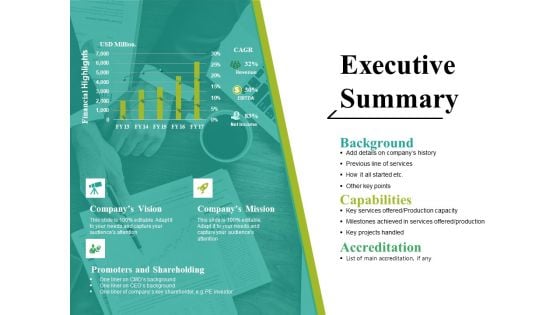
This is a executive summary ppt powerpoint presentation summary themes. This is a three stage process. The stages in this process are background, capabilities, accreditation, company s vision, promoters and shareholding.
Half Yearly Commodity Marketing Research Roadmap Themes
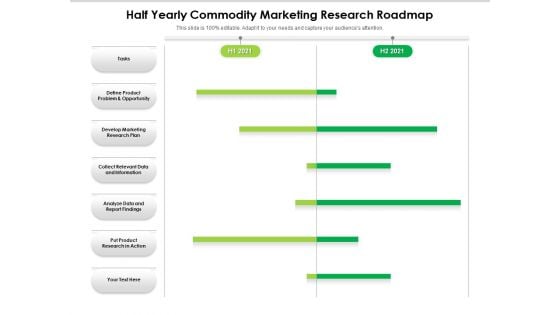
We present our half yearly commodity marketing research roadmap themes. This PowerPoint layout is easy-to-edit so you can change the font size, font type, color, and shape conveniently. In addition to this, the PowerPoint layout is Google Slides compatible, so you can share it with your audience and give them access to edit it. Therefore, download and save this well-researched half yearly commodity marketing research roadmap themes in different formats like PDF, PNG, and JPG to smoothly execute your business plan.
Quarterly Business Analytics Analyst Career Roadmap Themes
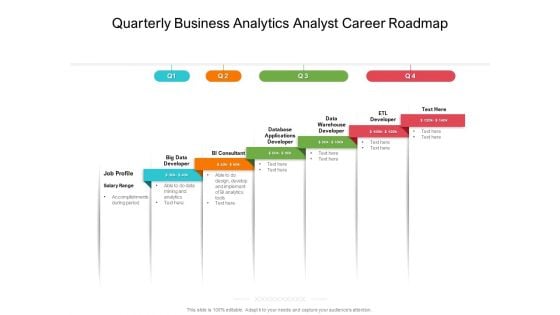
We present our quarterly business analytics analyst career roadmap themes. This PowerPoint layout is easy-to-edit so you can change the font size, font type, color, and shape conveniently. In addition to this, the PowerPoint layout is Google Slides compatible, so you can share it with your audience and give them access to edit it. Therefore, download and save this well-researched quarterly business analytics analyst career roadmap themes in different formats like PDF, PNG, and JPG to smoothly execute your business plan.
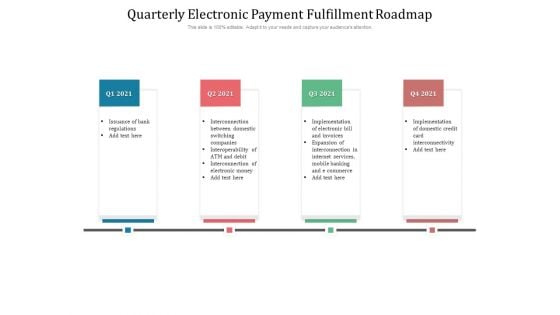
Quarterly Electronic Payment Fulfillment Roadmap Themes
We present our quarterly electronic payment fulfillment roadmap themes. This PowerPoint layout is easy-to-edit so you can change the font size, font type, color, and shape conveniently. In addition to this, the PowerPoint layout is Google Slides compatible, so you can share it with your audience and give them access to edit it. Therefore, download and save this well-researched quarterly electronic payment fulfillment roadmap themes in different formats like PDF, PNG, and JPG to smoothly execute your business plan.
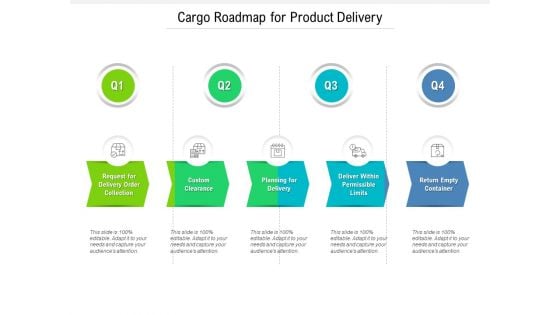
Cargo Roadmap For Product Delivery Themes
We present our cargo roadmap for product delivery themes. This PowerPoint layout is easy-to-edit so you can change the font size, font type, color, and shape conveniently. In addition to this, the PowerPoint layout is Google Slides compatible, so you can share it with your audience and give them access to edit it. Therefore, download and save this well-researched cargo roadmap for product delivery themes in different formats like PDF, PNG, and JPG to smoothly execute your business plan.
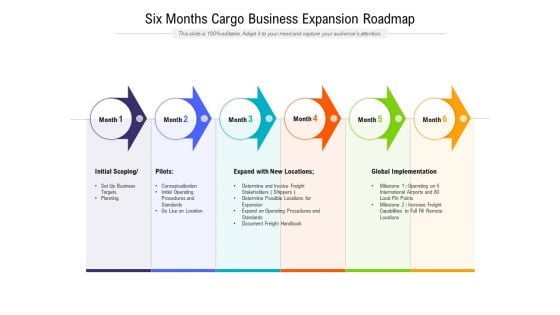
Six Months Cargo Business Expansion Roadmap Themes
We present our six months cargo business expansion roadmap themes. This PowerPoint layout is easy-to-edit so you can change the font size, font type, color, and shape conveniently. In addition to this, the PowerPoint layout is Google Slides compatible, so you can share it with your audience and give them access to edit it. Therefore, download and save this well-researched six months cargo business expansion roadmap themes in different formats like PDF, PNG, and JPG to smoothly execute your business plan.
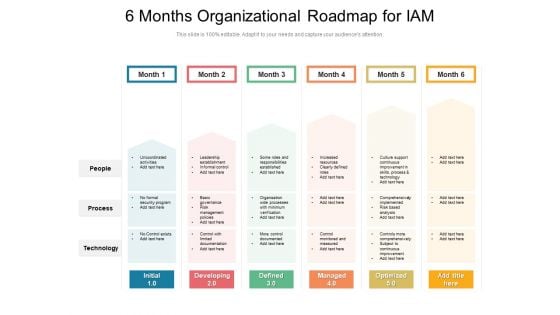
6 Months Organizational Roadmap For IAM Themes
We present our 6 months organizational roadmap for iam themes. This PowerPoint layout is easy-to-edit so you can change the font size, font type, color, and shape conveniently. In addition to this, the PowerPoint layout is Google Slides compatible, so you can share it with your audience and give them access to edit it. Therefore, download and save this well-researched 6 months organizational roadmap for iam themes in different formats like PDF, PNG, and JPG to smoothly execute your business plan.
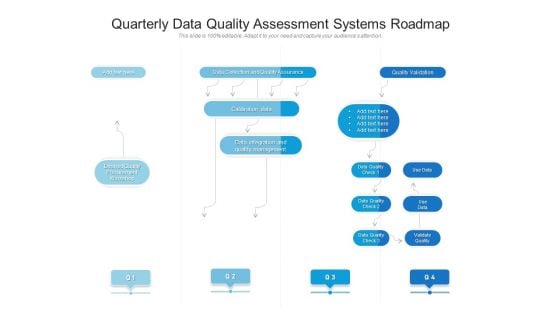
Quarterly Data Quality Assessment Systems Roadmap Themes
We present our quarterly data quality assessment systems roadmap themes. This PowerPoint layout is easy-to-edit so you can change the font size, font type, color, and shape conveniently. In addition to this, the PowerPoint layout is Google Slides compatible, so you can share it with your audience and give them access to edit it. Therefore, download and save this well-researched quarterly data quality assessment systems roadmap themes in different formats like PDF, PNG, and JPG to smoothly execute your business plan.
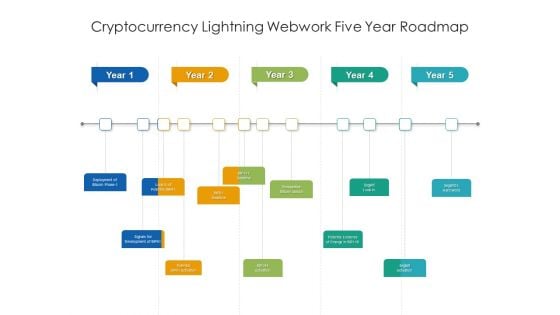
Cryptocurrency Lightning Webwork Five Year Roadmap Themes
We present our cryptocurrency lightning webwork five year roadmap themes. This PowerPoint layout is easy-to-edit so you can change the font size, font type, color, and shape conveniently. In addition to this, the PowerPoint layout is Google Slides compatible, so you can share it with your audience and give them access to edit it. Therefore, download and save this well-researched cryptocurrency lightning webwork five year roadmap themes in different formats like PDF, PNG, and JPG to smoothly execute your business plan.
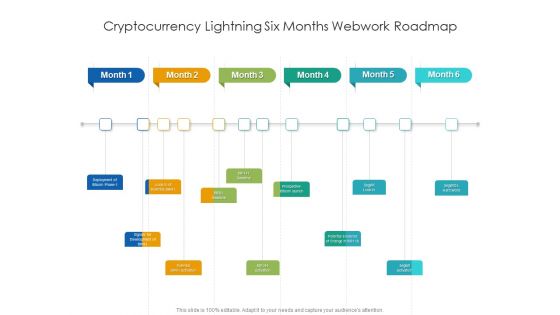
Cryptocurrency Lightning Six Months Webwork Roadmap Themes
We present our cryptocurrency lightning six months webwork roadmap themes. This PowerPoint layout is easy-to-edit so you can change the font size, font type, color, and shape conveniently. In addition to this, the PowerPoint layout is Google Slides compatible, so you can share it with your audience and give them access to edit it. Therefore, download and save this well-researched cryptocurrency lightning six months webwork roadmap themes in different formats like PDF, PNG, and JPG to smoothly execute your business plan.

Business Arrow Finance PowerPoint Templates And PowerPoint Themes 0812
Business Chart Arrow PowerPoint Templates And PowerPoint Themes 0812-Microsoft Powerpoint Templates and Background with business chart and arrow Reorganize your team with our Business Arrow Finance PowerPoint Templates And PowerPoint Themes 0812. Download without worries with our money back guaranteee.
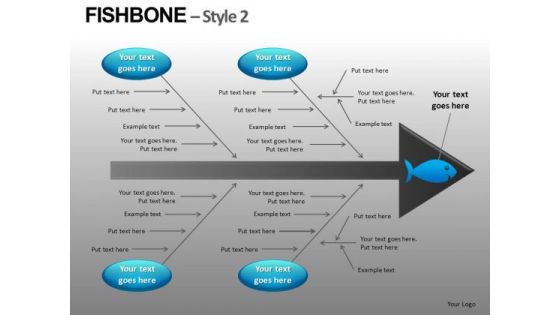
Fishbone Diagram Ppt Slides Download
Fishbone Diagram PPT Slides Download-These high quality powerpoint pre-designed slides and powerpoint templates have been carefully created by our professional team to help you impress your audience. All slides have been created and are 100% editable in powerpoint. Each and every property of any graphic - color, size, orientation, shading, outline etc. can be modified to help you build an effective powerpoint presentation. Any text can be entered at any point in the powerpoint template or slide. Simply DOWNLOAD, TYPE and PRESENT!These PowerPoint Presentation slides can be used for themes relating to--Arrow, cause, defect, deficiency, diagram, document, effect, envelope, environment, fishbone, flow, industry, kahashiwara, machine, manufacture, material, paper, pencil, safety, sketch Our Fishbone Diagram Ppt Slides Download team are great exponents of visual art. They have created some beauties for you.
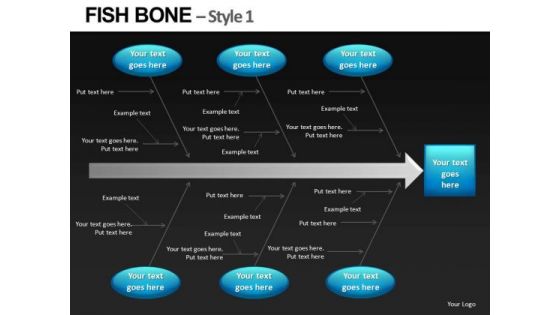
PowerPoint Slides Fishbone Diagrams Templates
PowerPoint Slides FishBone Diagrams templates-These high quality powerpoint pre-designed slides and powerpoint templates have been carefully created by our professional team to help you impress your audience. All slides have been created and are 100% editable in powerpoint. Each and every property of any graphic - color, size, orientation, shading, outline etc. can be modified to help you build an effective powerpoint presentation. Any text can be entered at any point in the powerpoint template or slide. Simply DOWNLOAD, TYPE and PRESENT!These PowerPoint Presentation slides can be used for themes relating to--Arrow, cause, defect, deficiency, diagram, document, effect, envelope, environment, fishbone, flow, industry, kahashiwara, machine, manufacture, material, paper, pencil, safety, sketch Make it clear your product is the best with our PowerPoint Slides Fishbone Diagrams Templates. Just download, type and present.
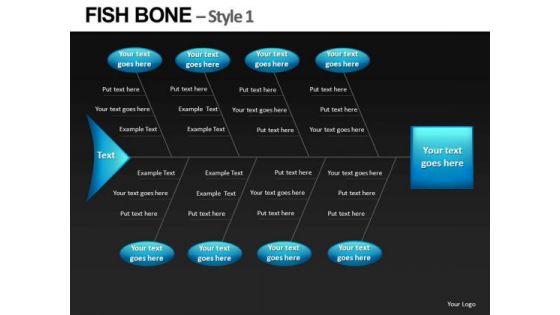
Ppt Slides Ishikawa Diagrams Fishbone
PPT Slides Ishikawa Diagrams Fishbone-These high quality powerpoint pre-designed slides and powerpoint templates have been carefully created by our professional team to help you impress your audience. All slides have been created and are 100% editable in powerpoint. Each and every property of any graphic - color, size, orientation, shading, outline etc. can be modified to help you build an effective powerpoint presentation. Any text can be entered at any point in the powerpoint template or slide. Simply DOWNLOAD, TYPE and PRESENT!These PowerPoint Presentation slides can be used for themes relating to--Arrow, cause, defect, deficiency, diagram, document, effect, envelope, environment, fishbone, flow, industry, kahashiwara, machine, manufacture, material, paper, pencil, safety, sketch Never fail to impress with our Ppt Slides Ishikawa Diagrams Fishbone. You will be at the top of your game.
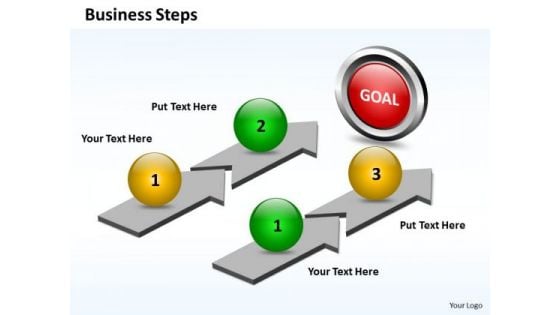
Business Charts PowerPoint Templates Parallel Plan Explain Steps
Business Charts PowerPoint templates parallel plan explain steps-This PowerPoint Diagram consists of two parallel processes each having two stages to reach till Destination. This PowerPoint Diagram imitates the concept of action, advance, case, channels, course, course of action, development, evolution, fashion.-Business Charts PowerPoint templates parallel plan explain steps You believe in fair dealings. Our Business Charts PowerPoint Templates Parallel Plan Explain Steps action your thoughts.
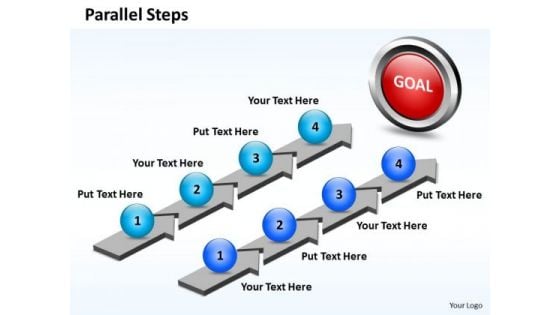
Business Charts PowerPoint Templates Parallel Steps For Plan Of Action
Business Charts PowerPoint templates parallel steps for plan of action-Use this PowerPoint Diagram to show of two parallel processes each having four stages to reach the end point. This Diagram represents formation, growth, manner, means, measure, mechanism, mode, modus operandi, movement, operation, outgrowth, performance.-Business Charts PowerPoint templates parallel steps for plan of action Exceed estimates with our Business Charts PowerPoint Templates Parallel Steps For Plan Of Action. Your ideas will deliver a breakthrough.
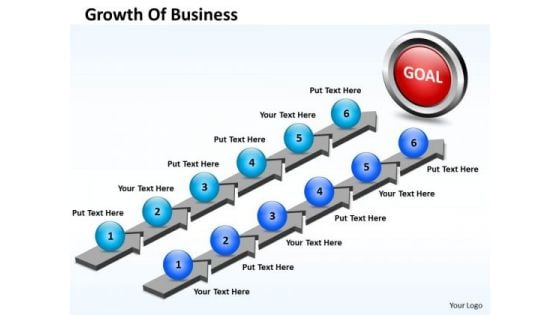
Business Charts PowerPoint Templates Parallel Steps Plan Growth Of
Business Charts PowerPoint templates parallel steps plan growth of-Use this PowerPoint Diagram to show of two parallel processes each having six stages to reach the end point. This Diagram represents formation, growth, manner, measure, mechanism, mode, technique, transaction, trial, movement, operation, outgrowth, performance.-Business Charts PowerPoint templates parallel steps plan growth of Failures are a stepping stone to success. Analyse likely causes with our Business Charts PowerPoint Templates Parallel Steps Plan Growth Of.
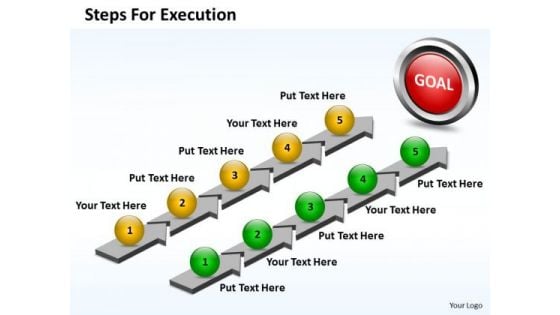
Business Charts PowerPoint Templates Parallelized Steps For Execution Of Plan
Business Charts PowerPoint templates parallelized steps for execution of plan-By using this PowerPoint Diagram you will be able to explain the different Approaches Parallel to each other that means you can use this to compare two approaches. Use this diagram to present your contents in a clear and structured manner.-Business Charts PowerPoint templates parallelized steps for execution of plan With our Business Charts PowerPoint Templates Parallelized Steps For Execution Of Plan your troubles will fall away. Your ideas will make smooth progress.
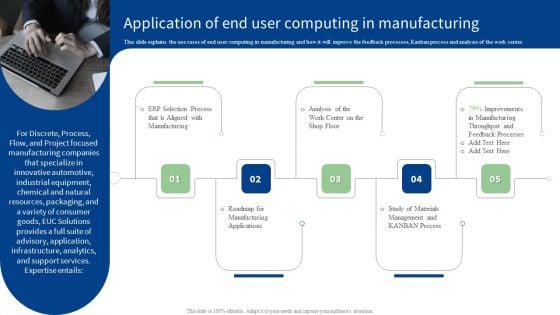
Application Of End User Computing In Manufacturing Ppt PowerPoint Presentation Diagram Graph Charts PDF
This slide explains the use cases of end user computing in manufacturing and how it will improve the feedback processes, Kanban process and analysis of the work center. Do you have to make sure that everyone on your team knows about any specific topic I yes, then you should give Application Of End User Computing In Manufacturing Ppt PowerPoint Presentation Diagram Graph Charts PDF a try. Our experts have put a lot of knowledge and effort into creating this impeccable Application Of End User Computing In Manufacturing Ppt PowerPoint Presentation Diagram Graph Charts PDF. You can use this template for your upcoming presentations, as the slides are perfect to represent even the tiniest detail. You can download these templates from the Slidegeeks website and these are easy to edit. So grab these today.
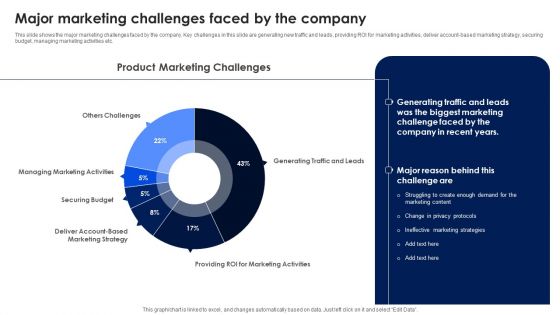
Major Marketing Challenges Faced By The Company Ppt PowerPoint Presentation Diagram Graph Charts PDF
This slide shows the major marketing challenges faced by the company. Key challenges in this slide are generating new traffic and leads, providing ROI for marketing activities, deliver account based marketing strategy, securing budget, managing marketing activities etc. Find highly impressive Major Marketing Challenges Faced By The Company Ppt PowerPoint Presentation Diagram Graph Charts PDF on Slidegeeks to deliver a meaningful presentation. You can save an ample amount of time using these presentation templates. No need to worry to prepare everything from scratch because Slidegeeks experts have already done a huge research and work for you. You need to download Major Marketing Challenges Faced By The Company Ppt PowerPoint Presentation Diagram Graph Charts PDF for your upcoming presentation. All the presentation templates are 100 percent editable and you can change the color and personalize the content accordingly. Download now.
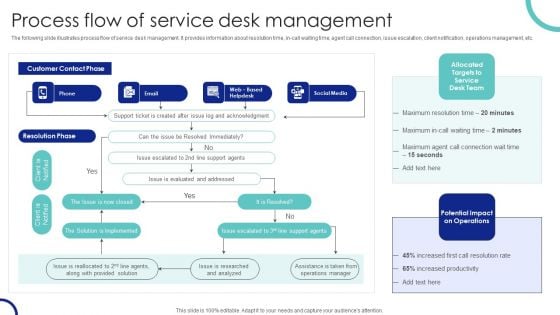
Process Flow Of Service Desk Management Ppt PowerPoint Presentation Diagram Graph Charts PDF
The following slide illustrates process flow of service desk management. It provides information about resolution time, in-call waiting time, agent call connection, issue escalation, client notification, operations management, etc. Explore a selection of the finest Process Flow Of Service Desk Management Ppt PowerPoint Presentation Diagram Graph Charts PDF here. With a plethora of professionally designed and pre made slide templates, you can quickly and easily find the right one for your upcoming presentation. You can use our Process Flow Of Service Desk Management Ppt PowerPoint Presentation Diagram Graph Charts PDF to effectively convey your message to a wider audience. Slidegeeks has done a lot of research before preparing these presentation templates. The content can be personalized and the slides are highly editable. Grab templates today from Slidegeeks.
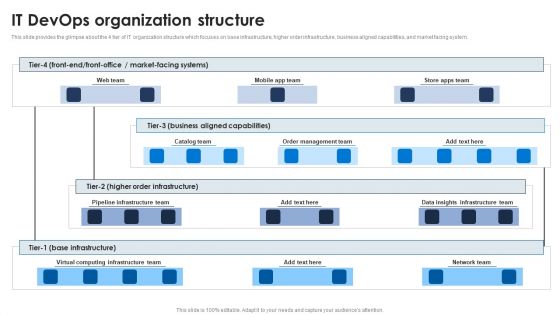
It Devops Organization Structure Ppt PowerPoint Presentation Diagram Graph Charts PDF
This slide provides the glimpse about the 4 tier of IT organization structure which focuses on base infrastructure, higher order infrastructure, business aligned capabilities, and market facing system. Do you have an important presentation coming up Are you looking for something that will make your presentation stand out from the rest Look no further than It Devops Organization Structure Ppt PowerPoint Presentation Diagram Graph Charts PDF. With our professional designs, you can trust that your presentation will pop and make delivering it a smooth process. And with Slidegeeks, you can trust that your presentation will be unique and memorable. So why wait Grab It Devops Organization Structure Ppt PowerPoint Presentation Diagram Graph Charts PDF today and make your presentation stand out from the rest.
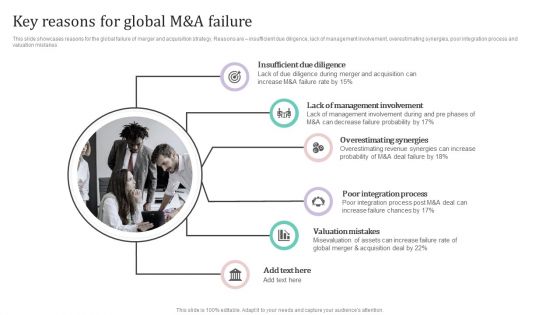
Key Reasons For Global M And A Failure Ppt PowerPoint Presentation Diagram Graph Charts PDF
This slide showcases reasons for the global failure of merger and acquisition strategy. Reasons are insufficient due diligence, lack of management involvement, overestimating synergies, poor integration process and valuation mistakes.Find highly impressive Key Reasons For Global M And A Failure Ppt PowerPoint Presentation Diagram Graph Charts PDF on Slidegeeks to deliver a meaningful presentation. You can save an ample amount of time using these presentation templates. No need to worry to prepare everything from scratch because Slidegeeks experts have already done a huge research and work for you. You need to download Key Reasons For Global M And A Failure Ppt PowerPoint Presentation Diagram Graph Charts PDF for your upcoming presentation. All the presentation templates are 100precent editable and you can change the color and personalize the content accordingly. Download now.
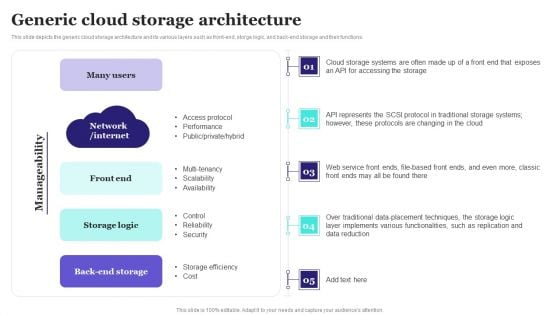
Generic Cloud Storage Architecture Ppt PowerPoint Presentation Diagram Graph Charts PDF
This slide depicts the generic cloud storage architecture and its various layers such as front end, storge logic, and back-end storage and their functions. Crafting an eye catching presentation has never been more straightforward. Let your presentation shine with this tasteful yet straightforward Generic Cloud Storage Architecture Ppt PowerPoint Presentation Diagram Graph Charts PDF template. It offers a minimalistic and classy look that is great for making a statement. The colors have been employed intelligently to add a bit of playfulness while still remaining professional. Construct the ideal Generic Cloud Storage Architecture Ppt PowerPoint Presentation Diagram Graph Charts PDF that effortlessly grabs the attention of your audience Begin now and be certain to wow your customers.
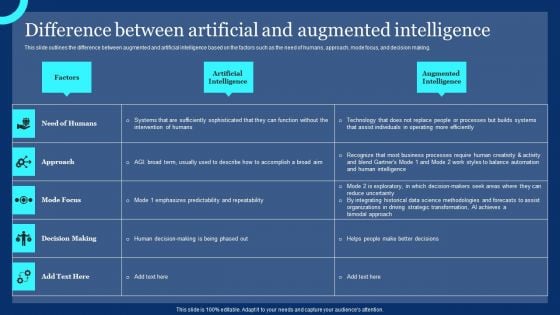
Difference Between Artificial And Augmented Intelligence Ppt PowerPoint Presentation Diagram Graph Charts PDF
This slide outlines the difference between augmented and artificial intelligence based on the factors such as the need of humans, approach, mode focus, and decision making. Here you can discover an assortment of the finest PowerPoint and Google Slides templates. With these templates, you can create presentations for a variety of purposes while simultaneously providing your audience with an eye catching visual experience. Download Difference Between Artificial And Augmented Intelligence Ppt PowerPoint Presentation Diagram Graph Charts PDF to deliver an impeccable presentation. These templates will make your job of preparing presentations much quicker, yet still, maintain a high level of quality. Slidegeeks has experienced researchers who prepare these templates and write high quality content for you. Later on, you can personalize the content by editing the Difference Between Artificial And Augmented Intelligence Ppt PowerPoint Presentation Diagram Graph Charts PDF.
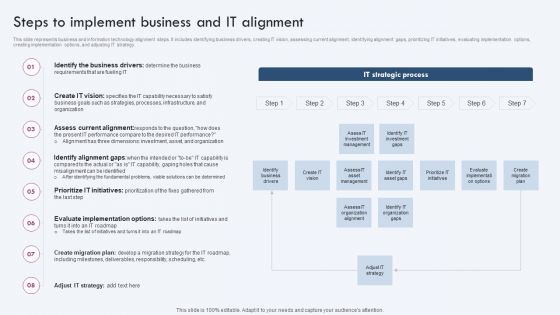
Steps To Implement Business And IT Alignment Ppt PowerPoint Presentation Diagram Graph Charts PDF
This slide represents business and information technology alignment steps. It includes identifying business drivers, creating IT vision, assessing current alignment, identifying alignment gaps, prioritizing IT initiatives, evaluating implementation options, creating implementation options, and adjusting IT strategy. Crafting an eye catching presentation has never been more straightforward. Let your presentation shine with this tasteful yet straightforward Steps To Implement Business And IT Alignment Ppt PowerPoint Presentation Diagram Graph Charts PDF template. It offers a minimalistic and classy look that is great for making a statement. The colors have been employed intelligently to add a bit of playfulness while still remaining professional. Construct the ideal Steps To Implement Business And IT Alignment Ppt PowerPoint Presentation Diagram Graph Charts PDF that effortlessly grabs the attention of your audience Begin now and be certain to wow your customers.
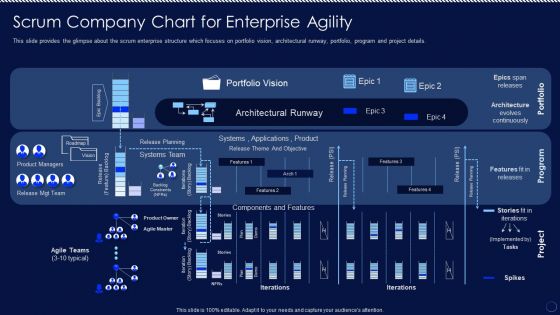
Scrum Company Chart For Enterprise Agility Ppt PowerPoint Presentation Diagram Lists PDF
This slide provides the glimpse about the scrum enterprise structure which focuses on portfolio vision, architectural runway, portfolio, program and project details. Do you have to make sure that everyone on your team knows about any specific topic I yes, then you should give Scrum Company Chart For Enterprise Agility Ppt PowerPoint Presentation Diagram Lists PDF a try. Our experts have put a lot of knowledge and effort into creating this impeccable Scrum Company Chart For Enterprise Agility Ppt PowerPoint Presentation Diagram Lists PDF. You can use this template for your upcoming presentations, as the slides are perfect to represent even the tiniest detail. You can download these templates from the Slidegeeks website and these are easy to edit. So grab these today.
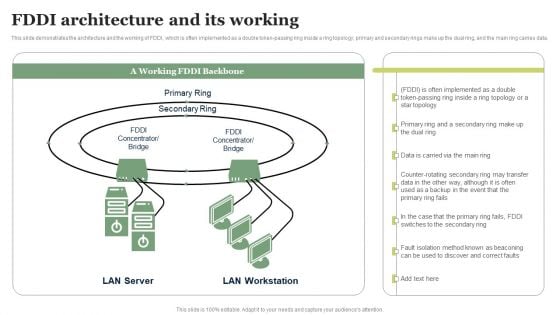
FDDI Architecture And Its Working Ppt PowerPoint Presentation Diagram Graph Charts PDF
This slide demonstrates the architecture and the working of FDDI, which is often implemented as a double token-passing ring inside a ring topology primary and secondary rings make up the dual ring, and the main ring carries data. Here you can discover an assortment of the finest PowerPoint and Google Slides templates. With these templates, you can create presentations for a variety of purposes while simultaneously providing your audience with an eye catching visual experience. Download FDDI Architecture And Its Working Ppt PowerPoint Presentation Diagram Graph Charts PDF to deliver an impeccable presentation. These templates will make your job of preparing presentations much quicker, yet still, maintain a high level of quality. Slidegeeks has experienced researchers who prepare these templates and write high quality content for you. Later on, you can personalize the content by editing the FDDI Architecture And Its Working Ppt PowerPoint Presentation Diagram Graph Charts PDF.
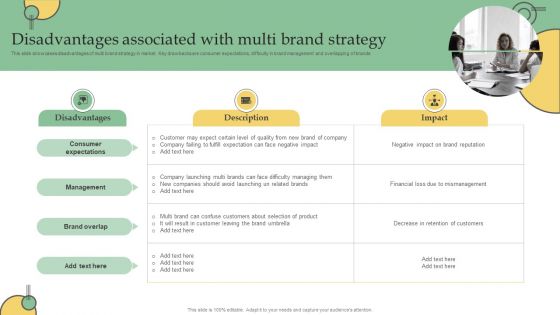
Disadvantages Associated With Multi Brand Strategy Ppt PowerPoint Presentation Diagram Graph Charts PDF
This slide showcases disadvantages of multi brand strategy in market. Key drawbacks are consumer expectations, difficulty in brand management and overlapping of brands. Explore a selection of the finest Disadvantages Associated With Multi Brand Strategy Ppt PowerPoint Presentation Diagram Graph Charts PDF here. With a plethora of professionally designed and pre made slide templates, you can quickly and easily find the right one for your upcoming presentation. You can use our Disadvantages Associated With Multi Brand Strategy Ppt PowerPoint Presentation Diagram Graph Charts PDF to effectively convey your message to a wider audience. Slidegeeks has done a lot of research before preparing these presentation templates. The content can be personalized and the slides are highly editable. Grab templates today from Slidegeeks.
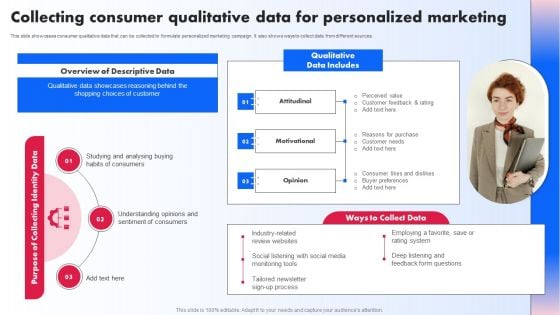
Collecting Consumer Qualitative Data For Personalized Marketing Ppt PowerPoint Presentation Diagram Graph Charts PDF
This slide showcases consumer qualitative data that can be collected to formulate personalized marketing campaign. It also shows ways to collect data from different sources Do you have an important presentation coming up Are you looking for something that will make your presentation stand out from the rest Look no further than Collecting Consumer Qualitative Data For Personalized Marketing Ppt PowerPoint Presentation Diagram Graph Charts PDF. With our professional designs, you can trust that your presentation will pop and make delivering it a smooth process. And with Slidegeeks, you can trust that your presentation will be unique and memorable. So why wait Grab Collecting Consumer Qualitative Data For Personalized Marketing Ppt PowerPoint Presentation Diagram Graph Charts PDF today and make your presentation stand out from the rest.
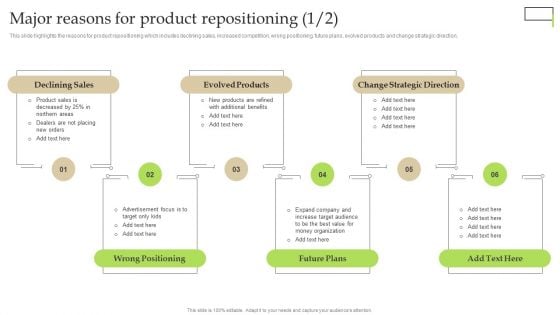
Major Reasons For Product Repositioning Ppt PowerPoint Presentation Diagram Graph Charts PDF
This slide highlights the reasons for product repositioning which includes declining sales, increased competition, wrong positioning, future plans, evolved products and change strategic direction. Do you have to make sure that everyone on your team knows about any specific topic I yes, then you should give Major Reasons For Product Repositioning Ppt PowerPoint Presentation Diagram Graph Charts PDF a try. Our experts have put a lot of knowledge and effort into creating this impeccable Major Reasons For Product Repositioning Ppt PowerPoint Presentation Diagram Graph Charts PDF. You can use this template for your upcoming presentations, as the slides are perfect to represent even the tiniest detail. You can download these templates from the Slidegeeks website and these are easy to edit. So grab these today
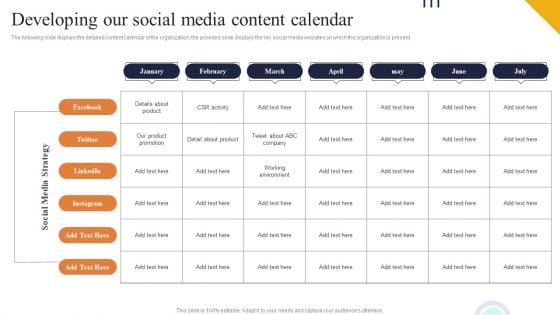
Developing Our Social Media Content Calendar Ppt PowerPoint Presentation Diagram Graph Charts PDF
The following slide displays the detailed content calendar of the organization, the provided slide displays the key social media websites on which the organization is present. Get a simple yet stunning designed Developing Our Social Media Content Calendar Ppt PowerPoint Presentation Diagram Graph Charts PDF. It is the best one to establish the tone in your meetings. It is an excellent way to make your presentations highly effective. So, download this PPT today from Slidegeeks and see the positive impacts. Our easy to edit Developing Our Social Media Content Calendar Ppt PowerPoint Presentation Diagram Graph Charts PDF can be your go to option for all upcoming conferences and meetings. So, what are you waiting for Grab this template today.
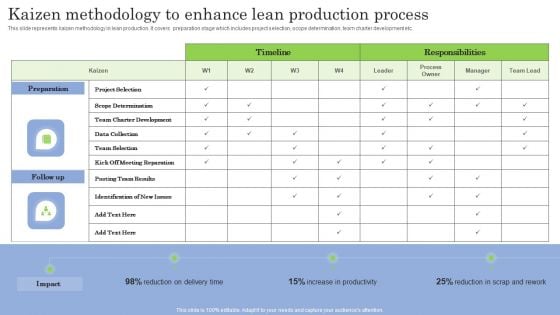
Kaizen Methodology To Enhance Lean Production Process Ppt PowerPoint Presentation Diagram Graph Charts PDF
This slide represents kaizen methodology in lean production. It covers preparation stage which includes project selection, scope determination, team charter development etc. Crafting an eye catching presentation has never been more straightforward. Let your presentation shine with this tasteful yet straightforward Kaizen Methodology To Enhance Lean Production Process Ppt PowerPoint Presentation Diagram Graph Charts PDF template. It offers a minimalistic and classy look that is great for making a statement. The colors have been employed intelligently to add a bit of playfulness while still remaining professional. Construct the ideal Kaizen Methodology To Enhance Lean Production Process Ppt PowerPoint Presentation Diagram Graph Charts PDF that effortlessly grabs the attention of your audience. Begin now and be certain to wow your customers.
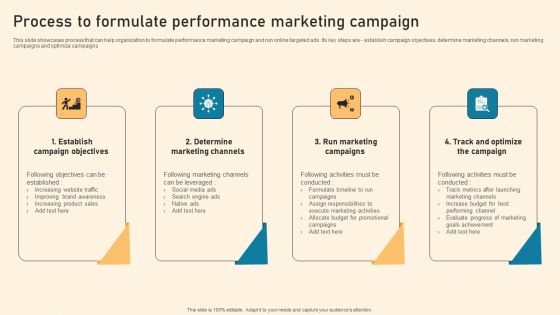
Process To Formulate Performance Marketing Campaign Ppt PowerPoint Presentation Diagram Graph Charts PDF
This slide showcases process that can help organization to formulate performance marketing campaign and run online targeted ads. Its key steps are - establish campaign objectives, determine marketing channels, run marketing campaigns and optimize campaigns Explore a selection of the finest Process To Formulate Performance Marketing Campaign Ppt PowerPoint Presentation Diagram Graph Charts PDF here. With a plethora of professionally designed and pre made slide templates, you can quickly and easily find the right one for your upcoming presentation. You can use our Process To Formulate Performance Marketing Campaign Ppt PowerPoint Presentation Diagram Graph Charts PDF to effectively convey your message to a wider audience. Slidegeeks has done a lot of research before preparing these presentation templates. The content can be personalized and the slides are highly editable. Grab templates today from Slidegeeks.
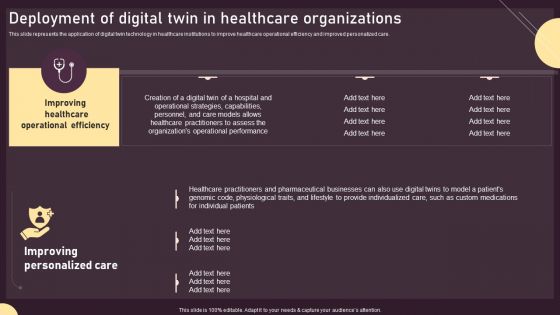
Deployment Of Digital Twin In Healthcare Organizations Ppt PowerPoint Presentation Diagram Graph Charts PDF
This slide represents the application of digital twin technology in healthcare institutions to improve healthcare operational efficiency and improved personalized care. Here you can discover an assortment of the finest PowerPoint and Google Slides templates. With these templates, you can create presentations for a variety of purposes while simultaneously providing your audience with an eye catching visual experience. Download Deployment Of Digital Twin In Healthcare Organizations Ppt PowerPoint Presentation Diagram Graph Charts PDF to deliver an impeccable presentation. These templates will make your job of preparing presentations much quicker, yet still, maintain a high level of quality. Slidegeeks has experienced researchers who prepare these templates and write high quality content for you. Later on, you can personalize the content by editing the Deployment Of Digital Twin In Healthcare Organizations Ppt PowerPoint Presentation Diagram Graph Charts PDF.
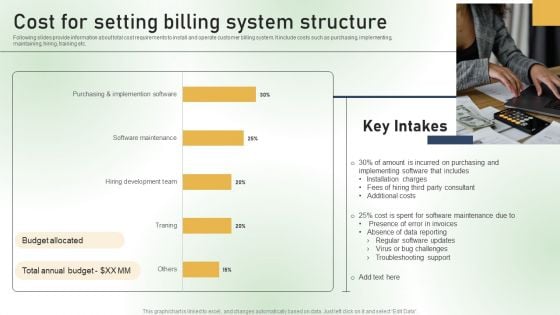
Cost For Setting Billing System Structure Ppt PowerPoint Presentation Diagram Graph Charts PDF
Following slides provide information about total cost requirements to install and operate customer billing system. It include costs such as purchasing, implementing, maintaining, hiring, training etc. Crafting an eye catching presentation has never been more straightforward. Let your presentation shine with this tasteful yet straightforward Cost For Setting Billing System Structure Ppt PowerPoint Presentation Diagram Graph Charts PDF template. It offers a minimalistic and classy look that is great for making a statement. The colors have been employed intelligently to add a bit of playfulness while still remaining professional. Construct the ideal Cost For Setting Billing System Structure Ppt PowerPoint Presentation Diagram Graph Charts PDF that effortlessly grabs the attention of your audience. Begin now and be certain to wow your customers.

Various Billing Software Comparison Chart Ppt PowerPoint Presentation File Diagrams PDF
Following slide represents comparative analysis of various software for company billing system. It includes various parameters such as prices, installation, time tracking, individual invoices, expense tracking etc. Do you have an important presentation coming up Are you looking for something that will make your presentation stand out from the rest Look no further than Various Billing Software Comparison Chart Ppt PowerPoint Presentation File Diagrams PDF With our professional designs, you can trust that your presentation will pop and make delivering it a smooth process. And with Slidegeeks, you can trust that your presentation will be unique and memorable. So why wait Grab Various Billing Software Comparison Chart Ppt PowerPoint Presentation File Diagrams PDF today and make your presentation stand out from the rest.
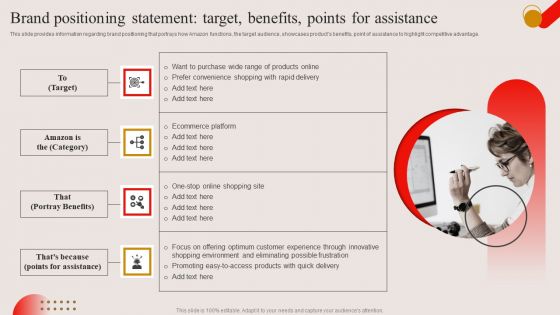
Brand Positioning Statement Target Benefits Points For Assistance Ppt PowerPoint Presentation Diagram Graph Charts PDF
This slide provides information regarding brand positioning that portrays how Amazon functions, the target audience, showcases products benefits, point of assistance to highlight competitive advantage. Get a simple yet stunning designed Brand Positioning Statement Target Benefits Points For Assistance Ppt PowerPoint Presentation Diagram Graph Charts PDF. It is the best one to establish the tone in your meetings. It is an excellent way to make your presentations highly effective. So, download this PPT today from Slidegeeks and see the positive impacts. Our easy to edit Brand Positioning Statement Target Benefits Points For Assistance Ppt PowerPoint Presentation Diagram Graph Charts PDF can be your go to option for all upcoming conferences and meetings. So, what are you waiting for Grab this template today.
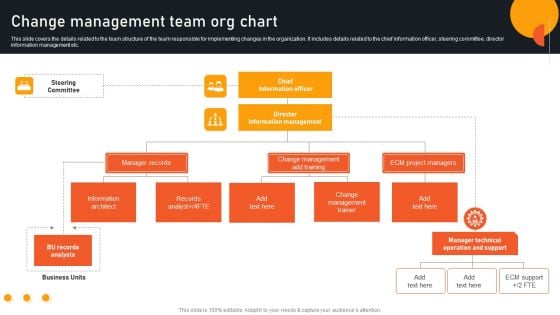
Transform Management Instruction Schedule Change Management Team Org Chart Diagrams PDF
This slide covers the details related to the team structure of the team responsible for implementing changes in the organization. It includes details related to the chief information officer, steering committee, director information management etc. Create an editable Transform Management Instruction Schedule Change Management Team Org Chart Diagrams PDF that communicates your idea and engages your audience. Whether youre presenting a business or an educational presentation, pre designed presentation templates help save time. Transform Management Instruction Schedule Change Management Team Org Chart Diagrams PDF is highly customizable and very easy to edit, covering many different styles from creative to business presentations. Slidegeeks has creative team members who have crafted amazing templates. So, go and get them without any delay.

Key Texting And SMS Marketing Statistics Ppt PowerPoint Presentation Diagram Graph Charts PDF
This slide represents the statistical data to help marketers analyze the benefits and importance of SMS marketing for business growth and development. It includes key SMS marketing statistics such as click through rates, opt-ins etc. Get a simple yet stunning designed Key Texting And SMS Marketing Statistics Ppt PowerPoint Presentation Diagram Graph Charts PDF. It is the best one to establish the tone in your meetings. It is an excellent way to make your presentations highly effective. So, download this PPT today from Slidegeeks and see the positive impacts. Our easy to edit Key Texting And SMS Marketing Statistics Ppt PowerPoint Presentation Diagram Graph Charts PDF can be your go to option for all upcoming conferences and meetings. So, what are you waiting for Grab this template today.
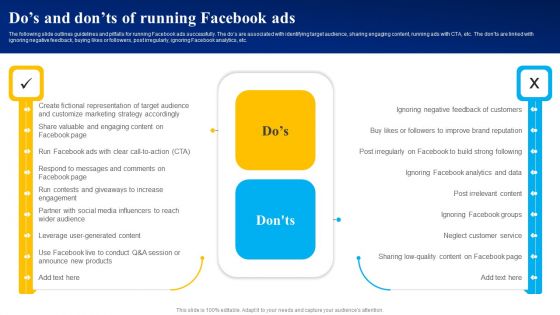
Dos And Donts Of Running Facebook Ads Ppt PowerPoint Presentation Diagram Graph Charts PDF
The following slide outlines guidelines and pitfalls for running Facebook ads successfully. The dos are associated with identifying target audience, sharing engaging content, running ads with CTA, etc. The donts are linked with ignoring negative feedback, buying likes or followers, post irregularly, ignoring Facebook analytics, etc. Formulating a presentation can take up a lot of effort and time, so the content and message should always be the primary focus. The visuals of the PowerPoint can enhance the presenters message, so our Dos And Donts Of Running Facebook Ads Ppt PowerPoint Presentation Diagram Graph Charts PDF was created to help save time. Instead of worrying about the design, the presenter can concentrate on the message while our designers work on creating the ideal templates for whatever situation is needed. Slidegeeks has experts for everything from amazing designs to valuable content, we have put everything into Dos And Donts Of Running Facebook Ads Ppt PowerPoint Presentation Diagram Graph Charts PDF.
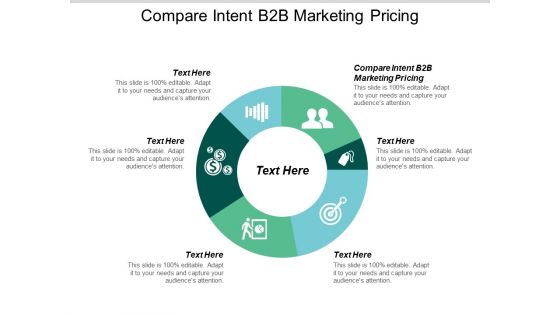
Compare Intent B2B Marketing Pricing Ppt PowerPoint Presentation Diagram Graph Charts Cpb
Presenting this set of slides with name compare intent b2b marketing pricing ppt powerpoint presentation diagram graph charts cpb. This is an editable Powerpoint six stages graphic that deals with topics like compare intent b2b marketing pricing to help convey your message better graphically. This product is a premium product available for immediate download and is 100 percent editable in Powerpoint. Download this now and use it in your presentations to impress your audience.
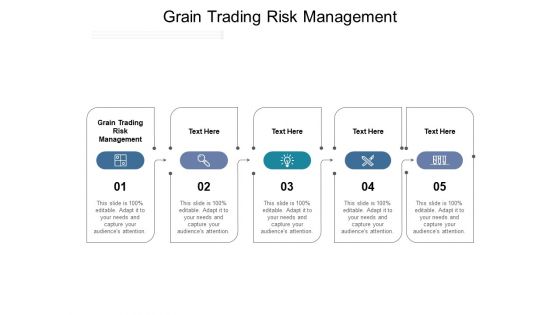
Grain Trading Risk Management Ppt PowerPoint Presentation Diagram Graph Charts Cpb Pdf
Presenting this set of slides with name grain trading risk management ppt powerpoint presentation diagram graph charts cpb pdf. This is an editable Powerpoint five stages graphic that deals with topics like grain trading risk management to help convey your message better graphically. This product is a premium product available for immediate download and is 100 percent editable in Powerpoint. Download this now and use it in your presentations to impress your audience.
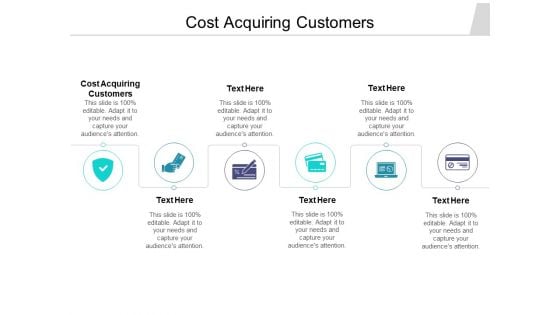
Cost Acquiring Customers Ppt PowerPoint Presentation Diagram Graph Charts Cpb Pdf
Presenting this set of slides with name cost acquiring customers ppt powerpoint presentation diagram graph charts cpb pdf. This is an editable Powerpoint six stages graphic that deals with topics like cost acquiring customers to help convey your message better graphically. This product is a premium product available for immediate download and is 100 percent editable in Powerpoint. Download this now and use it in your presentations to impress your audience.
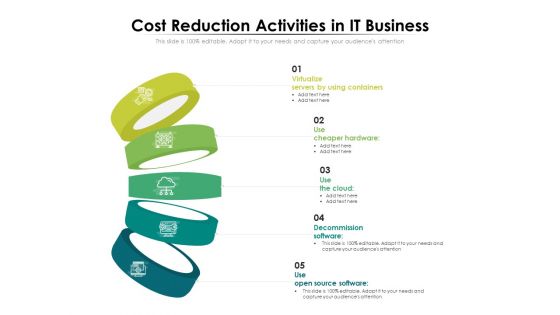
Cost Reduction Activities In IT Business Ppt PowerPoint Presentation Diagram Graph Charts PDF
Presenting this set of slides with name cost reduction activities in it business ppt powerpoint presentation diagram graph charts pdf. This is a five stage process. The stages in this process are virtualize servers by using containers, use cheaper hardware, use the cloud decommission software, use open source software. This is a completely editable PowerPoint presentation and is available for immediate download. Download now and impress your audience.
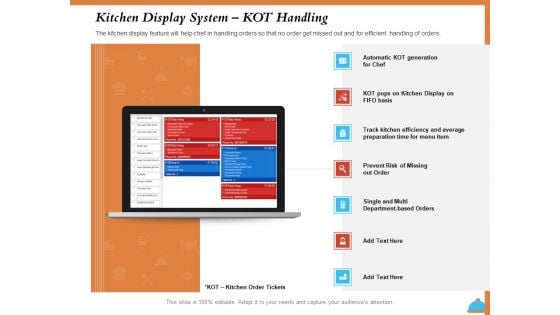
Improving Restaurant Operations Kitchen Display System Kot Handling Ppt Diagram Graph Charts PDF
Presenting this set of slides with name improving restaurant operations kitchen display system kot handling ppt diagram graph charts pdf. This is a seven stage process. The stages in this process are automatic kot generation chef , kot pops kitchen display, fifo basis, track kitchen efficiency and average preparation time, menu item, prevent risk of missing out order, single and multi, department based orders. This is a completely editable PowerPoint presentation and is available for immediate download. Download now and impress your audience.
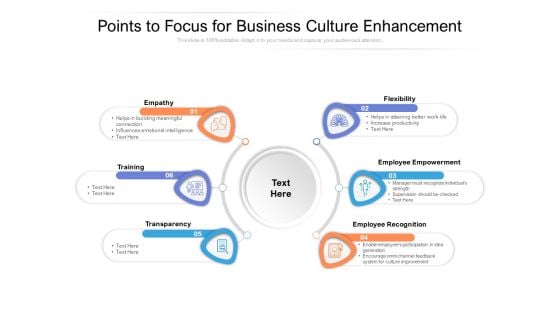
Points To Focus For Business Culture Enhancement Ppt PowerPoint Presentation Diagram Graph Charts PDF
Persuade your audience using this points to focus for business culture enhancement ppt powerpoint presentation diagram graph charts pdf. This PPT design covers six stages, thus making it a great tool to use. It also caters to a variety of topics including empathy, training, transparency, flexibility, employee empowerment, employee recognition. Download this PPT design now to present a convincing pitch that not only emphasizes the topic but also showcases your presentation skills.
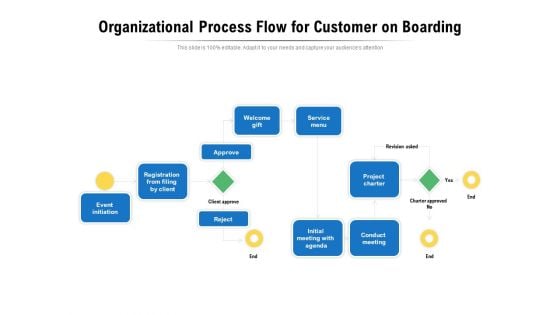
Organizational Process Flow For Customer On Boarding Ppt PowerPoint Presentation Diagram Graph Charts PDF
Persuade your audience using this organizational process flow for customer on boarding ppt powerpoint presentation diagram graph charts pdf. This PPT design covers one stages, thus making it a great tool to use. It also caters to a variety of topics including service menu, project charter, conduct meeting, initial meeting with agenda, registration from filing by client, approve. Download this PPT design now to present a convincing pitch that not only emphasizes the topic but also showcases your presentation skills.
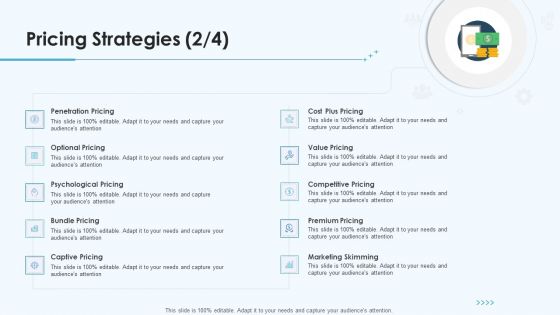
Product Pricing Strategies Pricing Strategies Skimming Ppt Diagram Graph Charts PDF
This is a product pricing strategies pricing strategies skimming ppt diagram graph charts pdf template with various stages. Focus and dispense information on ten stages using this creative set, that comes with editable features. It contains large content boxes to add your information on topics like psychological pricing, captive pricing, marketing skimming, premium pricing, value pricing. You can also showcase facts, figures, and other relevant content using this PPT layout. Grab it now.

Strategies And Tactics For Effective Growth Of Business Ppt PowerPoint Presentation Diagram Graph Charts PDF
Persuade your audience using this strategies and tactics for effective growth of business ppt powerpoint presentation diagram graph charts pdf. This PPT design covers three stages, thus making it a great tool to use. It also caters to a variety of topics including strategies and tactics for effective growth of business. Download this PPT design now to present a convincing pitch that not only emphasizes the topic but also showcases your presentation skills.


 Continue with Email

 Home
Home


