icons
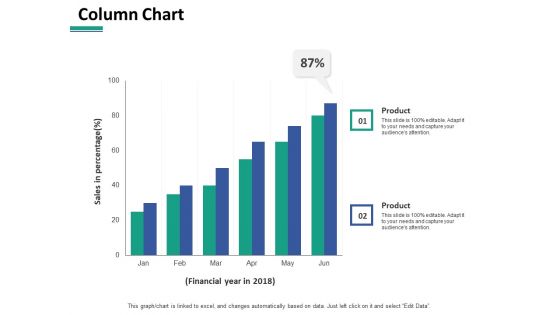
Column Chart Ppt PowerPoint Presentation Slides Example Topics
This is a column chart ppt powerpoint presentation slides example topics. This is a two stage process. The stages in this process are finance, marketing, management, investment, analysis.
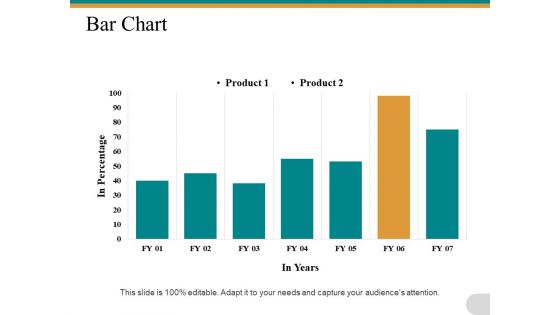
Bar Chart Marketing Ppt PowerPoint Presentation Outline Deck
This is a bar chart marketing ppt powerpoint presentation outline deck. This is a two stage process. The stages in this process are business, management, marketing, financial, sales.
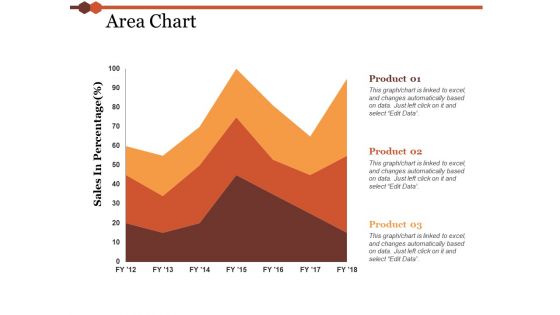
Area Chart Financial Ppt PowerPoint Presentation Layouts Slide
This is a area chart financial ppt powerpoint presentation layouts slide. This is a three stage process. The stages in this process are finance, marketing, management, investment, analysis.
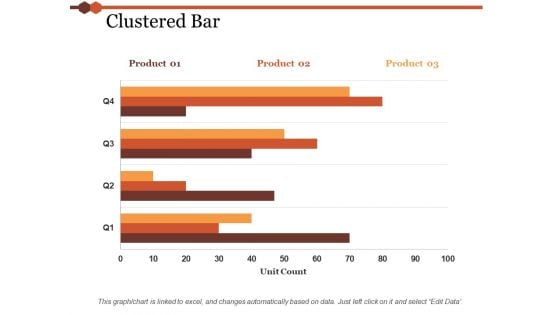
Clustered Bar Chart Ppt PowerPoint Presentation Layouts Infographics
This is a clustered bar chart ppt powerpoint presentation layouts infographics. This is a three stage process. The stages in this process are finance, marketing, management, investment, analysis.
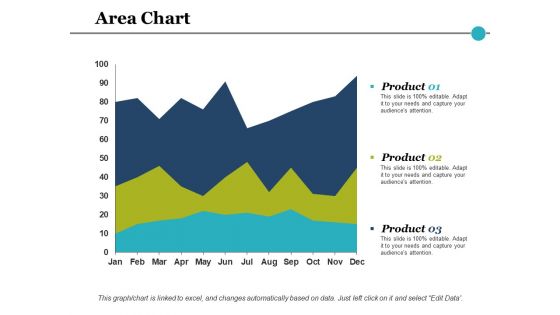
Area Chart Financial Ppt PowerPoint Presentation Inspiration Topics
This is a area chart financial ppt powerpoint presentation inspiration topics. This is a three stage process. The stages in this process are finance, marketing, management, investment, analysis.
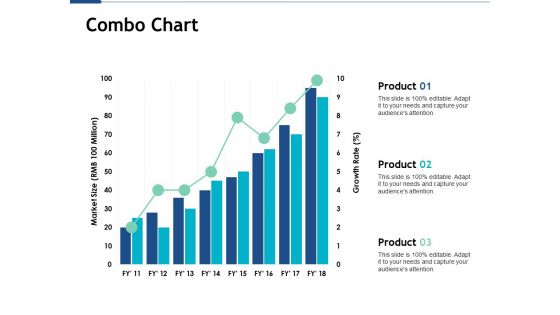
Combo Chart Ppt PowerPoint Presentation Visual Aids Pictures
This is a combo chart ppt powerpoint presentation visual aids pictures. This is a three stage process. The stages in this process are finance, marketing, management, investment, analysis.
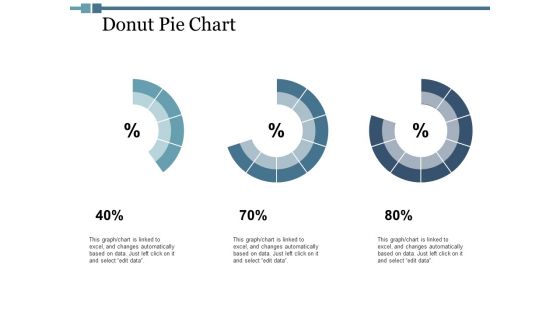
Donut Pie Chart Ppt PowerPoint Presentation Inspiration Brochure
This is a donut pie chart ppt powerpoint presentation inspiration brochure. This is a three stage process. The stages in this process are finance, marketing, management, investment, analysis.
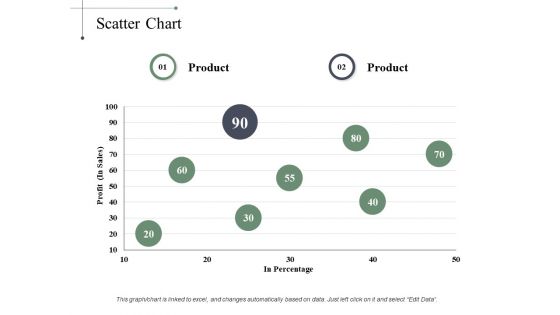
Scatter Chart Finance Ppt PowerPoint Presentation Ideas Show
This is a scatter chart finance ppt powerpoint presentation ideas show. This is a two stage process. The stages in this process are finance, marketing, analysis, business, investment.
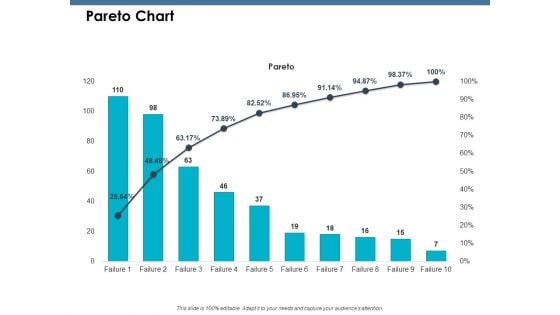
Pareto Chart Ppt PowerPoint Presentation Styles File Formats
This is a pareto chart ppt powerpoint presentation styles file formats. This is a ten stage process. The stages in this process are Product, Percentage, Business, Marketing.
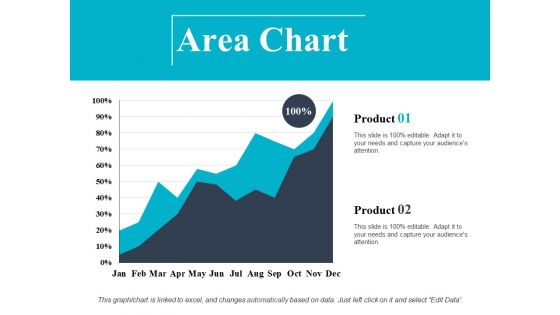
Area Chart Finance Ppt PowerPoint Presentation Slides Layout
This is a area chart finance ppt powerpoint presentation slides layout. This is a two stage process. The stages in this process are finance, marketing, management, investment, analysis.
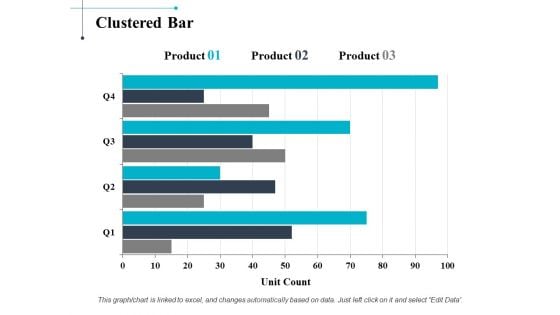
Clustered Bar Chart Ppt PowerPoint Presentation Professional Good
This is a clustered bar chart ppt powerpoint presentation professional good. This is a three stage process. The stages in this process are finance, marketing, management, investment, analysis.
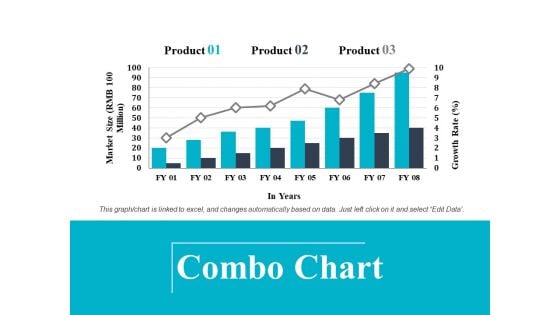
Combo Chart Ppt PowerPoint Presentation Visual Aids Files
This is a combo chart ppt powerpoint presentation visual aids files. This is a three stage process. The stages in this process are finance, marketing, management, investment, analysis.

Area Chart Financial Ppt PowerPoint Presentation Model Background
This is a area chart financial ppt powerpoint presentation model background. This is a two stage process. The stages in this process are finance, marketing, management, investment, analysis.
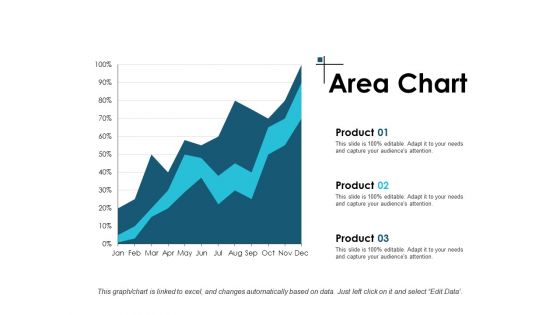
Area Chart Investment Ppt PowerPoint Presentation Infographics Summary
This is a area chart investment ppt powerpoint presentation infographics summary. This is a three stage process. The stages in this process are finance, marketing, management, investment, analysis.
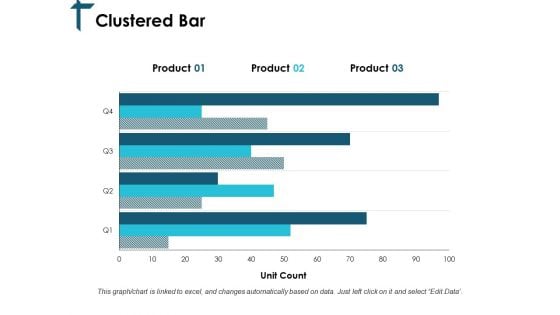
Clustered Bar Chart Ppt PowerPoint Presentation Summary Templates
This is a clustered bar chart ppt powerpoint presentation summary templates. This is a three stage process. The stages in this process are finance, marketing, management, investment, analysis.
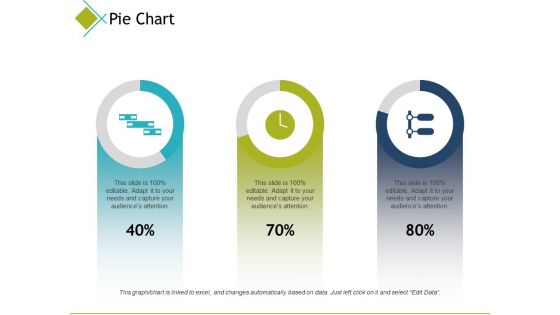
Pie Chart Finance Ppt PowerPoint Presentation Inspiration Introduction
This is a pie chart finance ppt powerpoint presentation inspiration introduction. This is a three stage process. The stages in this process are finance, marketing, analysis, business, investment.
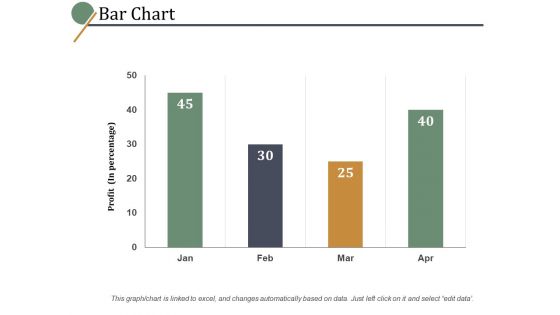
Bar Chart Slide Ppt PowerPoint Presentation Summary Example File
This is a bar chart slide ppt powerpoint presentation summary example file. This is a three stage process. The stages in this process are percentage, marketing, management, product.
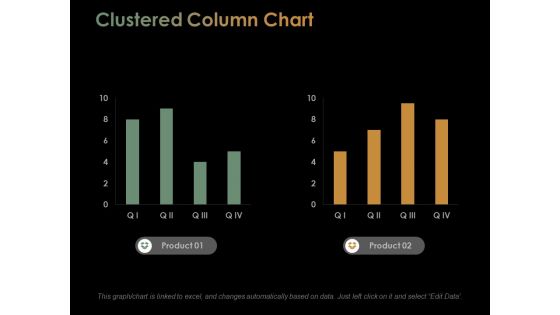
Clustered Column Chart Ppt PowerPoint Presentation Slides Information
This is a clustered column chart ppt powerpoint presentation slides information. This is a two stage process. The stages in this process are percentage, product, business, marketing.
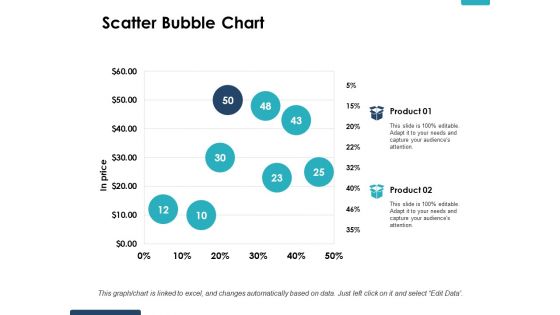
Scatter Bubble Chart Ppt PowerPoint Presentation Layouts Gridlines
This is a scatter bubble chart ppt powerpoint presentation layouts gridlines. This is a two stage process. The stages in this process are percentage, product, business, marketing.
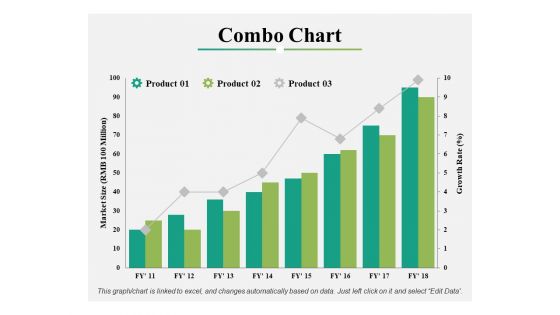
Combo Chart Ppt PowerPoint Presentation Styles Format Ideas
This is a combo chart ppt powerpoint presentation styles format ideas. This is a three stage process. The stages in this process are percentage, product, marketing.
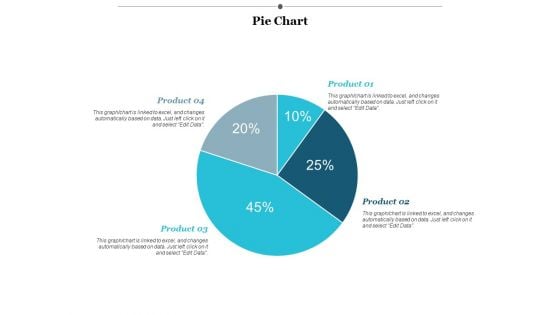
Pie Chart Finance Ppt PowerPoint Presentation Layouts Designs
This is a Pie Chart Finance Ppt PowerPoint Presentation Layouts Designs. This is a four stage process. The stages in this process are finance, marketing, management, investment, analysis.
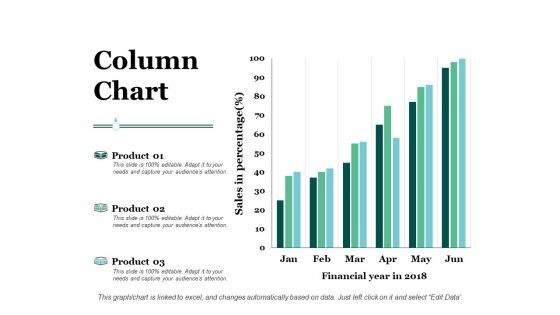
Column Chart Investment Ppt PowerPoint Presentation Professional Pictures
This is a column chart investment ppt powerpoint presentation professional pictures. This is a three stage process. The stages in this process are finance, analysis, business, investment, marketing.
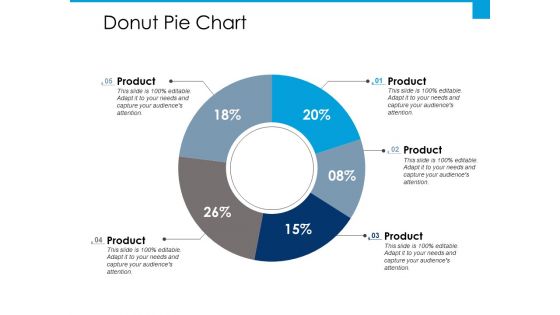
Donut Pie Chart Ppt PowerPoint Presentation Gallery Design Ideas
This is a donut pie chart ppt powerpoint presentation gallery design ideas. This is a five stage process. The stages in this process are business, marketing, percentage, product.
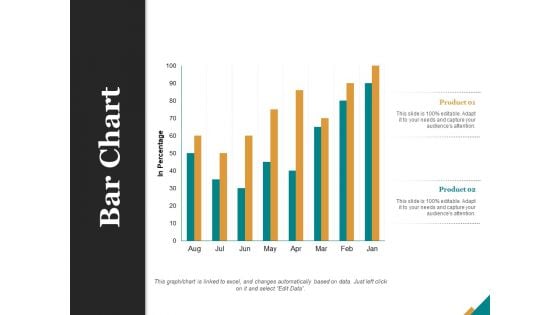
Bar Chart Finance Ppt PowerPoint Presentation Portfolio Model
This is a bar chart finance ppt powerpoint presentation portfolio model. This is a two stage process. The stages in this process are finance, marketing, management, investment, analysis.
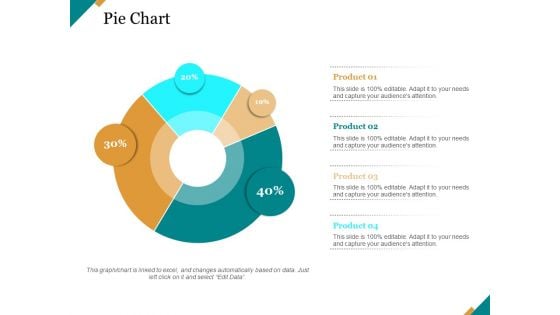
Pie Chart Finance Ppt PowerPoint Presentation Model Ideas
This is a pie chart finance ppt powerpoint presentation model ideas. This is a four stage process. The stages in this process are finance, marketing, management, investment, analysis.
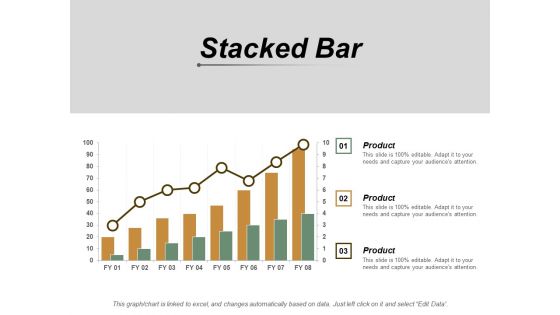
Stacked Bar Chart Ppt PowerPoint Presentation Gallery Outfit
This is a stacked bar chart ppt powerpoint presentation gallery outfit. This is a three stage process. The stages in this process are finance, marketing, management, investment, analysis.
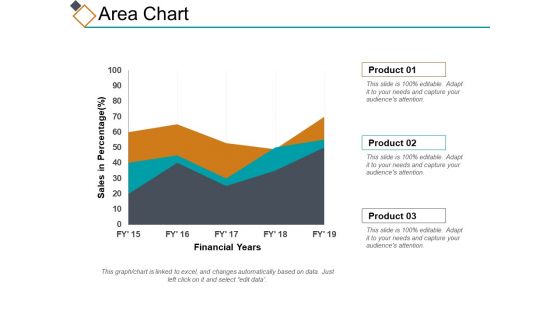
Area Chart Ppt PowerPoint Presentation File Design Inspiration
This is a area chart ppt powerpoint presentation file design inspiration. This is a three stage process. The stages in this process are percentage, product, business, management, marketing.
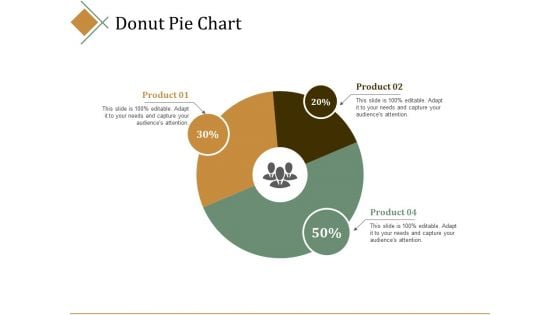
Donut Pie Chart Ppt PowerPoint Presentation Inspiration Elements
This is a donut pie chart ppt powerpoint presentation inspiration elements. This is a three stage process. The stages in this process are percentage, product, business, management, marketing.

Column Chart Finance Ppt PowerPoint Presentation Styles Backgrounds
This is a column chart finance ppt powerpoint presentation styles backgrounds. This is a three stage process. The stages in this process are finance, marketing, management, investment, analysis.

Combo Chart Financial Ppt PowerPoint Presentation Layouts Layouts
This is a combo chart financial ppt powerpoint presentation layouts layouts. This is a three stage process. The stages in this process are finance, marketing, management, investment, analysis.
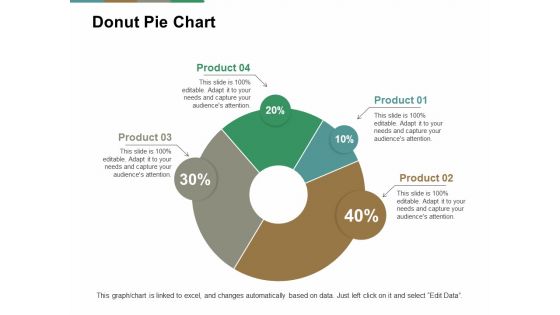
Donut Pie Chart Ppt PowerPoint Presentation Pictures Summary
This is a donut pie chart ppt powerpoint presentation pictures summary. This is a four stage process. The stages in this process are percentage, product, business, management, marketing.
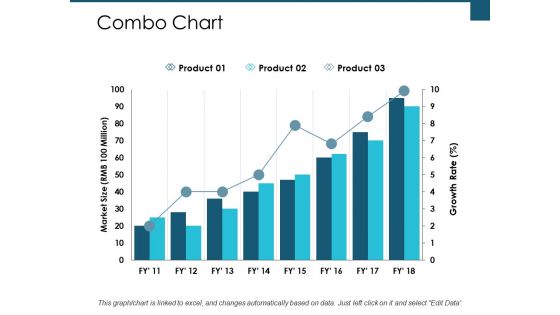
Combo Chart Finance Ppt PowerPoint Presentation Portfolio Templates
This is a combo chart finance ppt powerpoint presentation portfolio templates. This is a three stage process. The stages in this process are finance, analysis, business, investment, marketing.

Area Chart Financial Ppt PowerPoint Presentation Styles Templates
This is a area chart financial ppt powerpoint presentation styles templates. This is a two stage process. The stages in this process are finance, marketing, management, investment, analysis.
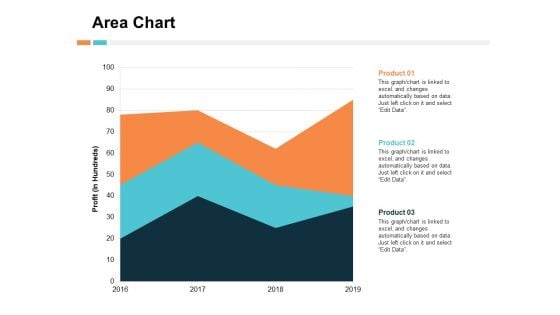
Area Chart Financial Ppt PowerPoint Presentation Outline Information
This is a area chart financial ppt powerpoint presentation outline information. This is a three stage process. The stages in this process are percentage, product, business, management, marketing.
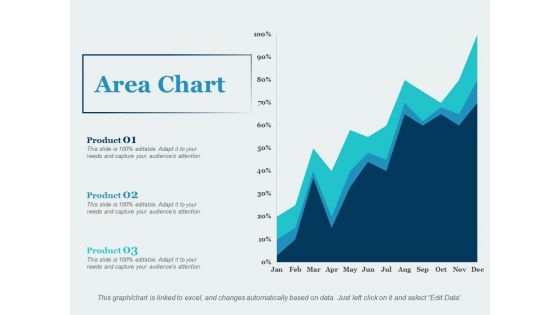
Area Chart Percentage Ppt PowerPoint Presentation Gallery Outline
This is a area chart percentage ppt powerpoint presentation gallery outline. This is a three stage process. The stages in this process are business, management, marketing, percentage, product.

Scatter Bubble Chart Ppt PowerPoint Presentation Outline Demonstration
This is a scatter bubble chart ppt powerpoint presentation outline demonstration. This is a three stage process. The stages in this process are percentage, product, management, marketing, business.
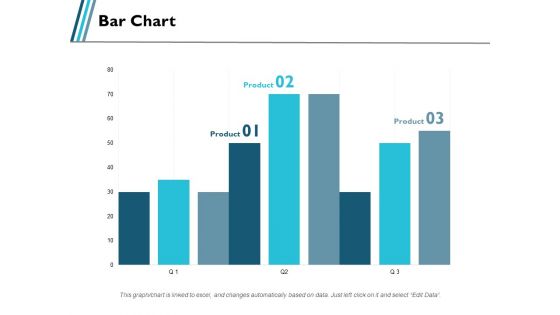
Bar Chart Product Ppt PowerPoint Presentation Portfolio Visuals
This is a bar chart product ppt powerpoint presentation portfolio visuals. This is a three stage process. The stages in this process are business, management, marketing, percentage, product.
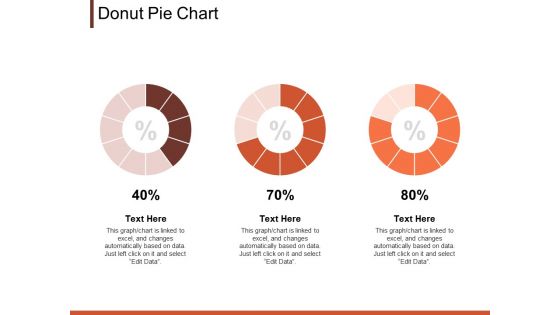
Donut Pie Chart Marketing Ppt PowerPoint Presentation Clipart
This is a donut pie chart marketing ppt powerpoint presentation clipart. This is a three stage process. The stages in this process are finance, analysis, business, investment, marketing.
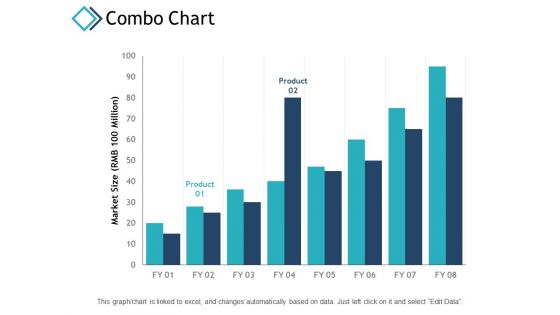
Combo Chart Finance Ppt PowerPoint Presentation Portfolio Gridlines
This is a combo chart finance ppt powerpoint presentation portfolio gridlines. This is a two stage process. The stages in this process are finance, analysis, business, investment, marketing.
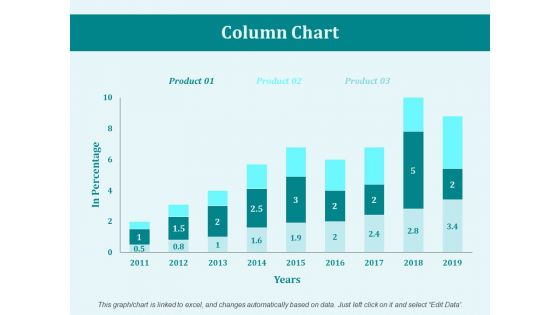
Column Chart Marketing Ppt PowerPoint Presentation Summary Images
This is a column chart marketing ppt powerpoint presentation summary images. This is a three stage process. The stages in this process are business, management, marketing, product, percentage.
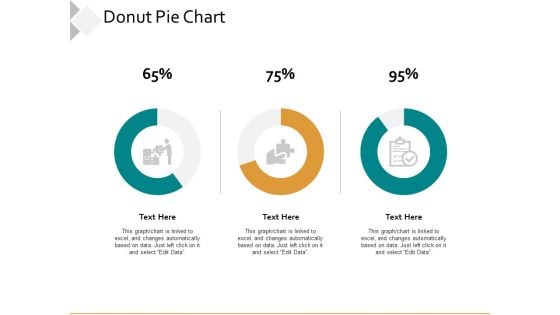
Donut Pie Chart Ppt PowerPoint Presentation Infographics Examples
This is a donut pie chart ppt powerpoint presentation infographics examples. This is a three stage process. The stages in this process are business, management, marketing, financial.
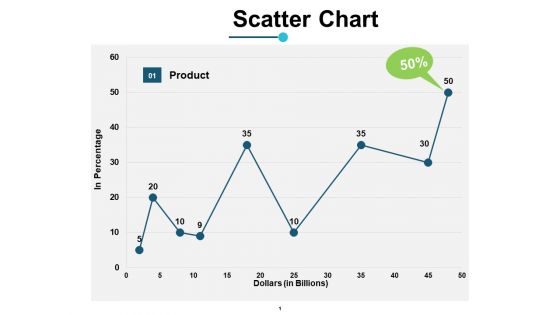
Scatter Chart Financial Ppt PowerPoint Presentation Model Deck
This is a scatter chart financial ppt powerpoint presentation model deck. This is a one stage process. The stages in this process are business, management, marketing, percentage, product.
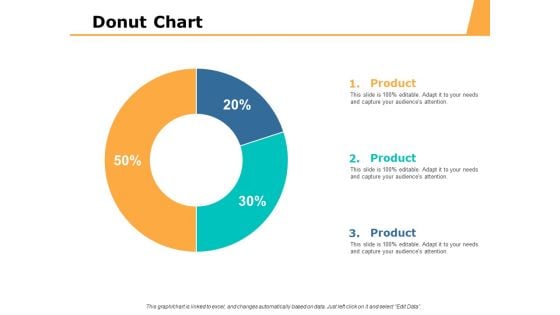
Pie Chart Percentage Ppt PowerPoint Presentation Inspiration Slides
This is a pie chart percentage ppt powerpoint presentation inspiration slides. This is a three stage process. The stages in this process are finance, marketing, management, investment, analysis.
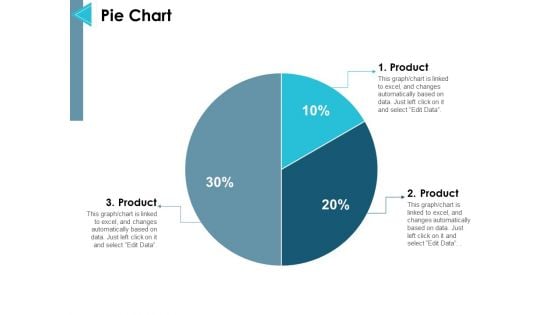
Pie Chart Finance Ppt PowerPoint Presentation Professional Styles
This is a pie chart finance ppt powerpoint presentation professional styles. This is a three stage process. The stages in this process are management, marketing, business, strategy, finance.
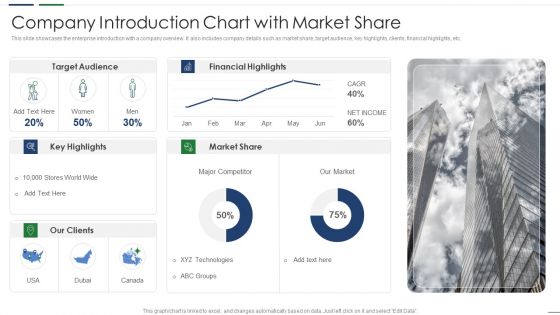
Company Introduction Chart With Market Share Portrait PDF
This slide showcases the enterprise introduction with a company overview. It also includes company details such as market share, target audience, key highlights, clients, financial highlights, etc. Showcasing this set of slides titled Company Introduction Chart With Market Share Portrait PDF. The topics addressed in these templates are Market Share, Financial Highlights, Target Audience. All the content presented in this PPT design is completely editable. Download it and make adjustments in color, background, font etc. as per your unique business setting.
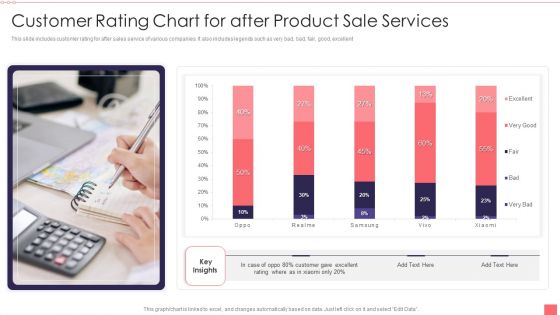
Customer Rating Chart For After Product Sale Services Download PDF
This slide includes customer rating for after sales service of various companies. It also includes legends such as very bad, bad, fair, good, excellent. Showcasing this set of slides titled Customer Rating Chart For After Product Sale Services Download PDF. The topics addressed in these templates are Customer, Product Sale Services. All the content presented in this PPT design is completely editable. Download it and make adjustments in color, background, font etc. as per your unique business setting.
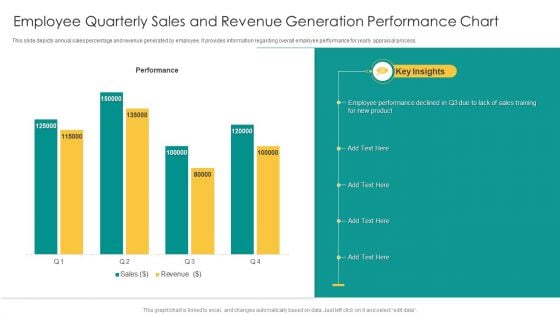
Employee Quarterly Sales And Revenue Generation Performance Chart Mockup PDF
This slide depicts annual sales percentage and revenue generated by employee. It provides information regarding overall employee performance for yearly appraisal process. Pitch your topic with ease and precision using this Employee Quarterly Sales And Revenue Generation Performance Chart Mockup PDF. This layout presents information on Performance, Sales, Revenue. It is also available for immediate download and adjustment. So, changes can be made in the color, design, graphics or any other component to create a unique layout.

Employees Quarter Wise Head Count Performance Chart Clipart PDF
This slide depicts number of existing and new hires in company. It provides details of total male and female employees for 4 quarters and key insights. Showcasing this set of slides titled Employees Quarter Wise Head Count Performance Chart Clipart PDF. The topics addressed in these templates are New Employees, Product Diversification, Advancement Opportunities. All the content presented in this PPT design is completely editable. Download it and make adjustments in color, background, font etc. as per your unique business setting.
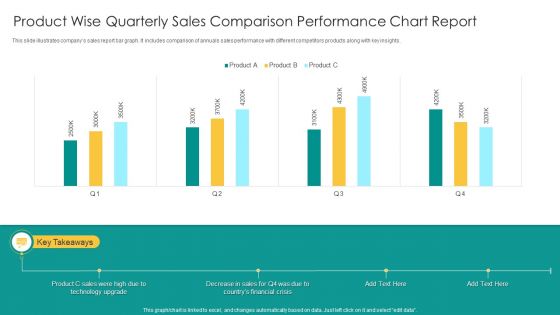
Product Wise Quarterly Sales Comparison Performance Chart Report Infographics PDF
This slide illustrates companys sales report bar graph. It includes comparison of annuals sales performance with different competitors products along with key insights. Showcasing this set of slides titled Product Wise Quarterly Sales Comparison Performance Chart Report Infographics PDF. The topics addressed in these templates are Product C Sales, Technology Upgrade, Financial Crisis. All the content presented in this PPT design is completely editable. Download it and make adjustments in color, background, font etc. as per your unique business setting.
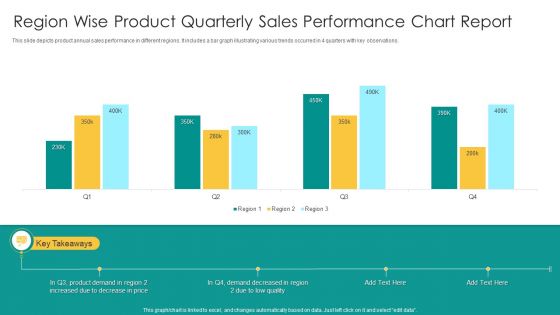
Region Wise Product Quarterly Sales Performance Chart Report Topics PDF
This slide depicts product annual sales performance in different regions. It includes a bar graph illustrating various trends occurred in 4 quarters with key observations. Showcasing this set of slides titled Region Wise Product Quarterly Sales Performance Chart Report Topics PDF. The topics addressed in these templates are Product Demand, Price, Low Quality. All the content presented in this PPT design is completely editable. Download it and make adjustments in color, background, font etc. as per your unique business setting.
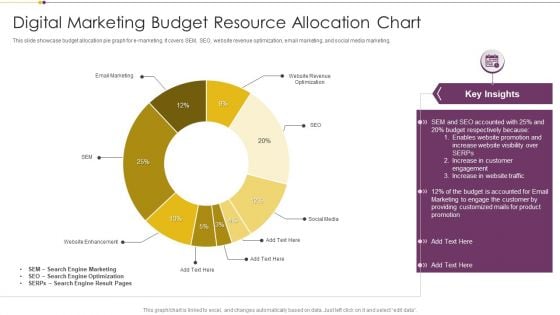
Digital Marketing Budget Resource Allocation Chart Download PDF
This slide showcase budget allocation pie graph for e marketing. It covers SEM, SEO, website revenue optimization, email marketing, and social media marketing. Pitch your topic with ease and precision using this Digital Marketing Budget Resource Allocation Chart Download PDF. This layout presents information on Search Engine Marketing, Search Engine Optimization, Budget. It is also available for immediate download and adjustment. So, changes can be made in the color, design, graphics or any other component to create a unique layout.
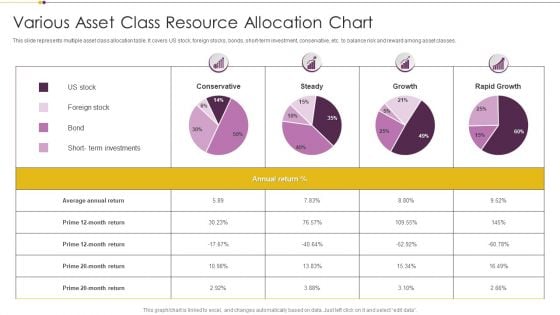
Various Asset Class Resource Allocation Chart Brochure PDF
This slide represents multiple asset class allocation table. It covers US stock, foreign stocks, bonds, short term investment, conservative, etc. to balance risk and reward among asset classes. Showcasing this set of slides titled Various Asset Class Resource Allocation Chart Brochure PDF. The topics addressed in these templates are Average Annual Return, Term Investments, Growth. All the content presented in this PPT design is completely editable. Download it and make adjustments in color, background, font etc. as per your unique business setting.
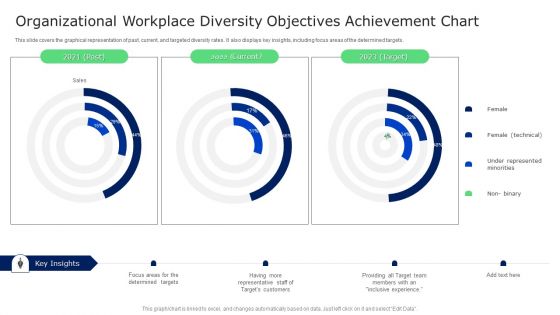
Organizational Workplace Diversity Objectives Achievement Chart Brochure PDF
This slide covers the graphical representation of past, current, and targeted diversity rates. It also displays key insights, including focus areas of the determined targets. Showcasing this set of slides titled Organizational Workplace Diversity Objectives Achievement Chart Brochure PDF. The topics addressed in these templates are Targets Customers, Determined Targets, Target Team. All the content presented in this PPT design is completely editable. Download it and make adjustments in color, background, font etc. as per your unique business setting.
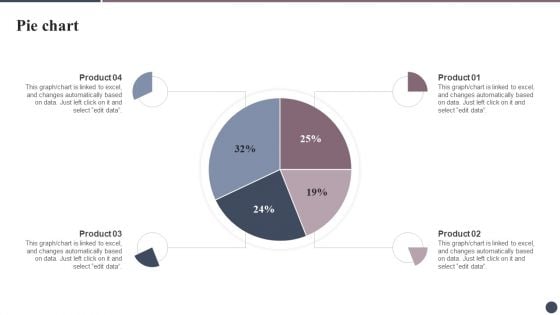
Expanding Target Audience With Cultural Branding Pie Chart Slides PDF
Slidegeeks is one of the best resources for PowerPoint templates. You can download easily and regulate Expanding Target Audience With Cultural Branding Pie Chart Slides PDF for your personal presentations from our wonderful collection. A few clicks is all it takes to discover and get the most relevant and appropriate templates. Use our Templates to add a unique zing and appeal to your presentation and meetings. All the slides are easy to edit and you can use them even for advertisement purposes.
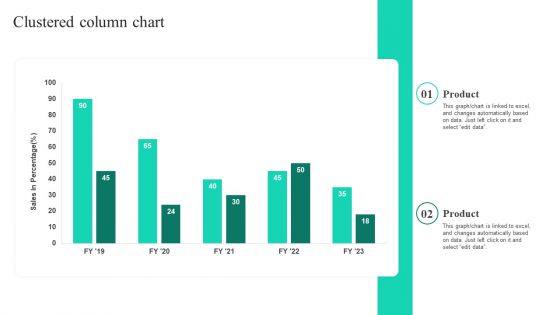
Adopting Flexible Work Policy Clustered Column Chart Clipart PDF
Slidegeeks is one of the best resources for PowerPoint templates. You can download easily and regulate Adopting Flexible Work Policy Clustered Column Chart Clipart PDF for your personal presentations from our wonderful collection. A few clicks is all it takes to discover and get the most relevant and appropriate templates. Use our Templates to add a unique zing and appeal to your presentation and meetings. All the slides are easy to edit and you can use them even for advertisement purposes.
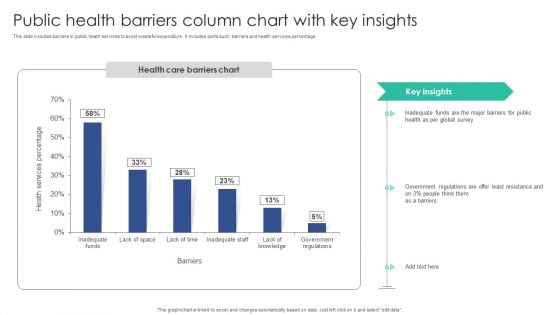
Public Health Barriers Column Chart With Key Insights Portrait PDF
This slide includes barriers in public heath services to avoid wasteful expenditure . It includes parts such barriers and health services percentage.Pitch your topic with ease and precision using this Public Health Barriers Column Chart With Key Insights Portrait PDF. This layout presents information on Inadequate Funds, Global Survey, Government Regulations. It is also available for immediate download and adjustment. So, changes can be made in the color, design, graphics or any other component to create a unique layout.
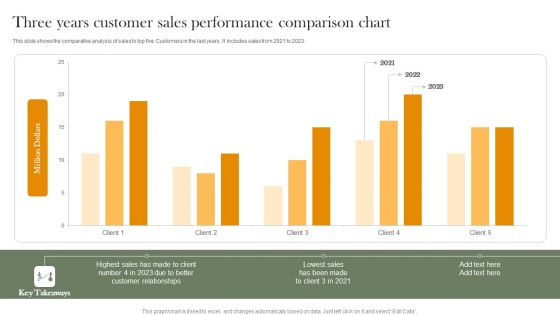
Three Years Customer Sales Performance Comparison Chart Professional PDF
This slide shows the comparative analysis of sales to top five Customers in the last years. It includes sales from 2021 to 2023. Pitch your topic with ease and precision using this Three Years Customer Sales Performance Comparison Chart Professional PDF. This layout presents information on Highest Sales, Customer Relationships, Lowest Sales. It is also available for immediate download and adjustment. So, changes can be made in the color, design, graphics or any other component to create a unique layout.
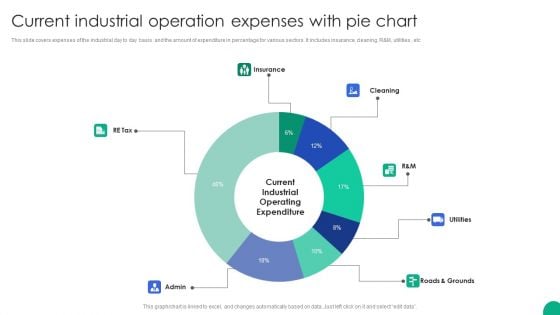
Current Industrial Operation Expenses With Pie Chart Download PDF
This slide covers expenses of the industrial day to day basis and the amount of expenditure in percentage for various sectors. It includes insurance, cleaning, R and M, utilities , etc.Showcasing this set of slides titled Current Industrial Operation Expenses With Pie Chart Download PDF. The topics addressed in these templates are Roads Grounds, Insurance, Utilities. All the content presented in this PPT design is completely editable. Download it and make adjustments in color, background, font etc. as per your unique business setting.
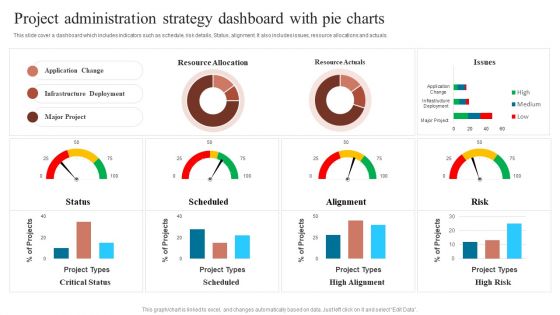
Project Administration Strategy Dashboard With Pie Charts Sample PDF
This slide cover a dashboard which includes indicators such as schedule, risk details, Status, alignment. It also includes issues, resource allocations and actuals. Pitch your topic with ease and precision using this Project Administration Strategy Dashboard With Pie Charts Sample PDF. This layout presents information on Communication Goal, Communication Tool, Increase Revenue. It is also available for immediate download and adjustment. So, changes can be made in the color, design, graphics or any other component to create a unique layout.
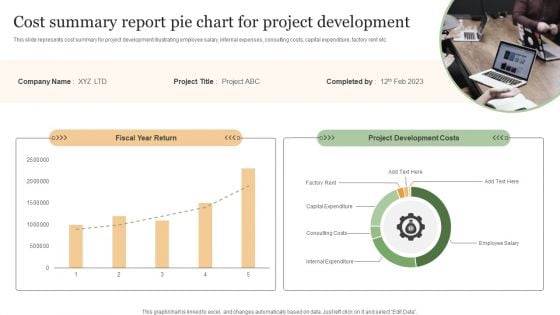
Cost Summary Report Pie Chart For Project Development Infographics PDF
This slide represents cost summary for project development illustrating employee salary, internal expenses, consulting costs, capital expenditure, factory rent etc. Showcasing this set of slides titled Cost Summary Report Pie Chart For Project Development Infographics PDF. The topics addressed in these templates are Fiscal Year Return, Project Development Costs. All the content presented in this PPT design is completely editable. Download it and make adjustments in color, background, font etc. as per your unique business setting.


 Continue with Email

 Home
Home


