icons

Man Push Pie Chart Steps To Growth PowerPoint Templates Ppt Backgrounds For Slides 0813
Our Man Push Pie Chart Steps To Growth PowerPoint Templates PPT Backgrounds For Slides allow you to do it with ease. Just like picking the low hanging fruit. Boil the ocean with your thoughts. Our Pie Charts PowerPoint Templates will help create waves. Make some dough with our Finance PowerPoint Templates. Your assets will rise significantly.

Business Graph And Chart In Folder PowerPoint Templates Ppt Backgrounds For Slides 0813
Our Business Graph And Chart In Folder PowerPoint Templates PPT Backgrounds For Slides make good beasts of burden. Place all your demands on them. Deliver the right dose with our Signs PowerPoint Templates. Your ideas will get the correct illumination. Your abilities have been lying dormant. Awaken them with our Pie Charts PowerPoint Templates.
Business Progress Graph And Pie Chart PowerPoint Templates Ppt Backgrounds For Slides 0813
Generate camaradarie with our Business Progress Graph And Pie Chart PowerPoint Templates PPT Backgrounds For Slides. Good wishes will come raining down. Good camaradarie is a key to teamwork. Our Pie Charts PowerPoint Templates can be a cementing force. Our Process and Flows PowerPoint Templates are an agent of change. Let your thoughts go down uncharted courses.
Team Efforts To Complete The Task Pie Chart PowerPoint Templates Ppt Backgrounds For Slides 0813
Double your chances with our Team Efforts To Complete The Task Pie Chart PowerPoint Templates PPT Backgrounds For Slides. The value of your thoughts will increase two-fold. Charm the audience with your thoughts. Add our Pie Charts PowerPoint Templates and they will be dotty for you. Double up our Teamwork PowerPoint Templates with your thoughts. They will make an awesome pair.
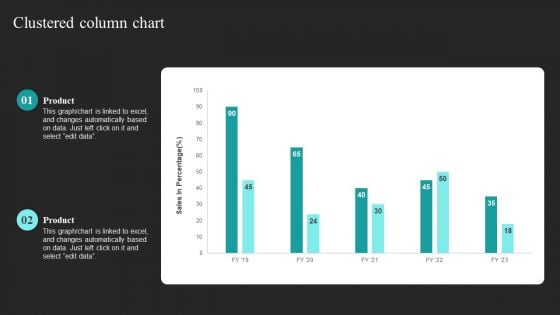
Strategic Promotional Guide For Restaurant Business Advertising Clustered Column Chart Infographics PDF
Presenting this PowerPoint presentation, titled Strategic Promotional Guide For Restaurant Business Advertising Clustered Column Chart Infographics PDF, with topics curated by our researchers after extensive research. This editable presentation is available for immediate download and provides attractive features when used. Download now and captivate your audience. Presenting this Strategic Promotional Guide For Restaurant Business Advertising Clustered Column Chart Infographics PDF. Our researchers have carefully researched and created these slides with all aspects taken into consideration. This is a completely customizable Strategic Promotional Guide For Restaurant Business Advertising Clustered Column Chart Infographics PDF that is available for immediate downloading. Download now and make an impact on your audience. Highlight the attractive features available with our PPTs.
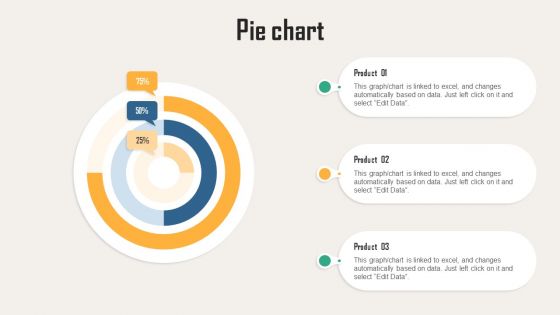
Creating Customer Personas For Customizing Pie Chart Ppt Professional Slides PDF
This graph or chart is linked to excel, and changes automatically based on data. Just left click on it and select Edit Data. Find highly impressive Creating Customer Personas For Customizing Pie Chart Ppt Professional Slides PDF on Slidegeeks to deliver a meaningful presentation. You can save an ample amount of time using these presentation templates. No need to worry to prepare everything from scratch because Slidegeeks experts have already done a huge research and work for you. You need to download Creating Customer Personas For Customizing Pie Chart Ppt Professional Slides PDF for your upcoming presentation. All the presentation templates are 100 percent editable and you can change the color and personalize the content accordingly. Download now.
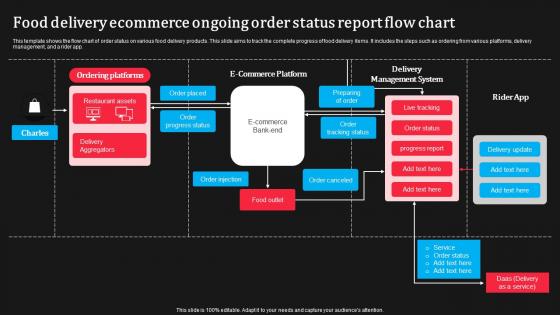
Food Delivery Ecommerce Ongoing Order Status Report Flow Chart Graphics Pdf
This template shows the flow chart of order status on various food delivery products. This slide aims to track the complete progress of food delivery items. It includes the steps such as ordering from various platforms, delivery management, and a rider app.Showcasing this set of slides titled Food Delivery Ecommerce Ongoing Order Status Report Flow Chart Graphics Pdf The topics addressed in these templates are Ordering Platforms, Restaurant Assets, Delivery Aggregators All the content presented in this PPT design is completely editable. Download it and make adjustments in color, background, font etc. as per your unique business setting. This template shows the flow chart of order status on various food delivery products. This slide aims to track the complete progress of food delivery items. It includes the steps such as ordering from various platforms, delivery management, and a rider app.
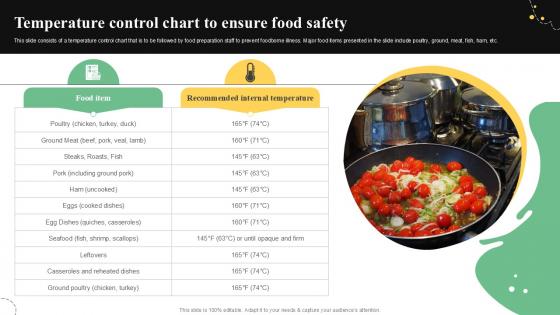
Temperature Control Chart To Quality Control Guide For Food PPT Example
This slide consists of a temperature control chart that is to be followed by food preparation staff to prevent foodborne illness. Major food items presented in the slide include poultry, ground, meat, fish, ham, etc. If your project calls for a presentation, then Slidegeeks is your go-to partner because we have professionally designed, easy-to-edit templates that are perfect for any presentation. After downloading, you can easily edit Temperature Control Chart To Quality Control Guide For Food PPT Example and make the changes accordingly. You can rearrange slides or fill them with different images. Check out all the handy templates This slide consists of a temperature control chart that is to be followed by food preparation staff to prevent foodborne illness. Major food items presented in the slide include poultry, ground, meat, fish, ham, etc.
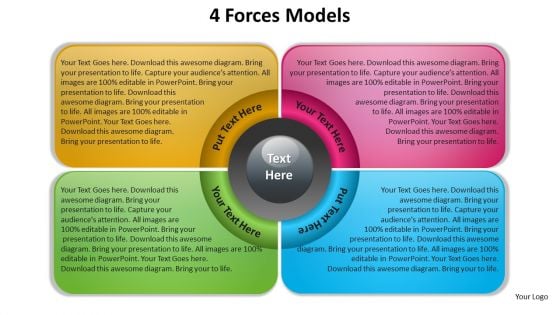
4 Forces Modelss PowerPoint Slides Presentation Diagrams Templates
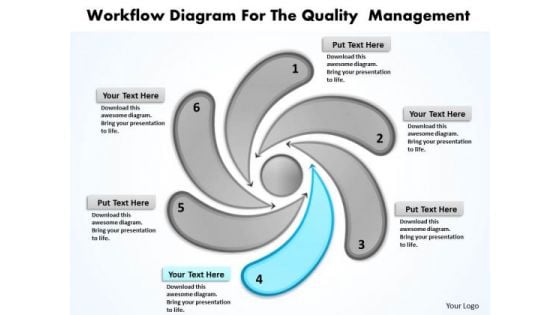
Business Analysis Diagrams Workflow For The Quality Management PowerPoint Slides
We present our business analysis diagrams workflow for the quality management PowerPoint Slides.Use our Advertising PowerPoint Templates because you have the right arrows in your quiver. Present our Business PowerPoint Templates because your ideas too are pinpointedly focused on you goals. Download and present our Marketing PowerPoint Templates because The marketplace is the merger of your dreams and your ability. Download and present our Finance PowerPoint Templates because Our Template designs are State of the Art. Use our Shapes PowerPoint Templates because with the help of our Slides you can Illustrate these thoughts with this slide.Use these PowerPoint slides for presentations relating to Action, Analysis, Attitude, Business, Chart, Classroom, Concept, Conceptual, Conference, Connection, Corporate, Design, Diagram, Direction, Element, Financial, Formula, Future, Management, Market, Marketing, Mind, Mind Map, Organization, Organize, Plan, Process, Product, Relation, Render, Solutions, Strategy, Success, Successful, Target, Text. The prominent colors used in the PowerPoint template are Blue, Gray, Black. PowerPoint presentation experts tell us our business analysis diagrams workflow for the quality management PowerPoint Slides will impress their bosses and teams. Professionals tell us our Chart PowerPoint templates and PPT Slides are Pleasant. People tell us our business analysis diagrams workflow for the quality management PowerPoint Slides are Breathtaking. We assure you our Conceptual PowerPoint templates and PPT Slides are Splendid. PowerPoint presentation experts tell us our business analysis diagrams workflow for the quality management PowerPoint Slides are visually appealing. Professionals tell us our Concept PowerPoint templates and PPT Slides are Romantic. Our Business Analysis Diagrams Workflow For The Quality Management PowerPoint Slides make great allies. They uphold your faith in them.
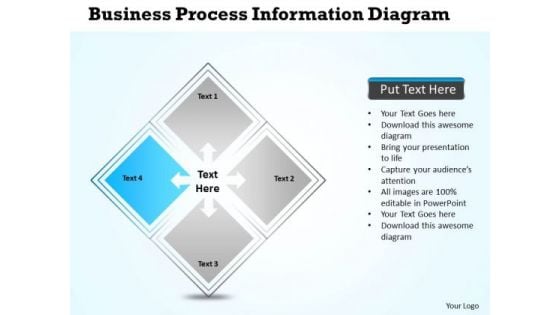
Business Process Diagram Vision Presentations Information PowerPoint Slides
We present our business process diagram vision presentations information PowerPoint Slides.Present our Competition PowerPoint Templates because you should Whip up a frenzy with our PowerPoint Templates and Slides. They will fuel the excitement of your team. Present our Arrows PowerPoint Templates because They will Put your wonderful verbal artistry on display. Our PowerPoint Templates and Slides will provide you the necessary glam and glitter. Use our Business PowerPoint Templates because Our PowerPoint Templates and Slides will let you Illuminate the road ahead to Pinpoint the important landmarks along the way. Download our Shapes PowerPoint Templates because Our PowerPoint Templates and Slides are the chords of your song. String them along and provide the lilt to your views. Download and present our Process and Flows PowerPoint Templates because It will get your audience in sync.Use these PowerPoint slides for presentations relating to Achievement, arrow, business, chart, communication, competition, concept, design, development, diagram, direction, financial, forward, goal, growth, increase, investment, leadership, marketing, moving, path, price, process, profit, progress, shape, sign, success, symbol, target, teamwork. The prominent colors used in the PowerPoint template are Blue, Gray, White. The feedback we get is that our business process diagram vision presentations information PowerPoint Slides effectively help you save your valuable time. The feedback we get is that our competition PowerPoint templates and PPT Slides look good visually. Professionals tell us our business process diagram vision presentations information PowerPoint Slides have awesome images to get your point across. Professionals tell us our development PowerPoint templates and PPT Slides will impress their bosses and teams. Presenters tell us our business process diagram vision presentations information PowerPoint Slides are aesthetically designed to attract attention. We guarantee that they will grab all the eyeballs you need. You can be sure our chart PowerPoint templates and PPT Slides are designed by a team of presentation professionals. Your ideas will flower with our Business Process Diagram Vision Presentations Information PowerPoint Slides. Your brilliance will begin to bloom.

Business Process Workflow Diagram Examples Templates 2010 PowerPoint
We present our business process workflow diagram examples templates 2010 PowerPoint.Download our Advertising PowerPoint Templates because It will let you Set new benchmarks with our PowerPoint Templates and Slides. They will keep your prospects well above par. Download and present our Arrows PowerPoint Templates because Our PowerPoint Templates and Slides are topically designed to provide an attractive backdrop to any subject. Present our Shapes PowerPoint Templates because our PowerPoint Templates and Slides will give your ideas the shape. Use our Process and Flows PowerPoint Templates because It will get your audience in sync. Use our Business PowerPoint Templates because You have belief amd faith in your futuristic plans. Chalk them out for your team with our PowerPoint Templates and Slides.Use these PowerPoint slides for presentations relating to Arrow, business, button, chart, circle, cycle, define, deploy, develop, diagram, eps10, flow, graphic, illustration, improvement, integrate, lifecycle, line, measure, ongoing, optimize, pattern, process, relationship, role, round, shape, text, transparency, vector, wave, wheel. The prominent colors used in the PowerPoint template are Green, Gray, Black. The feedback we get is that our business process workflow diagram examples templates 2010 PowerPoint effectively help you save your valuable time. The feedback we get is that our button PowerPoint templates and PPT Slides are topically designed to provide an attractive backdrop to any subject. Professionals tell us our business process workflow diagram examples templates 2010 PowerPoint will make you look like a winner. Professionals tell us our cycle PowerPoint templates and PPT Slides are second to none. Presenters tell us our business process workflow diagram examples templates 2010 PowerPoint are readymade to fit into any presentation structure. You can be sure our chart PowerPoint templates and PPT Slides effectively help you save your valuable time. Our Business Process Workflow Diagram Examples Templates 2010 PowerPoint are never a drag. The audience will be always attentive.
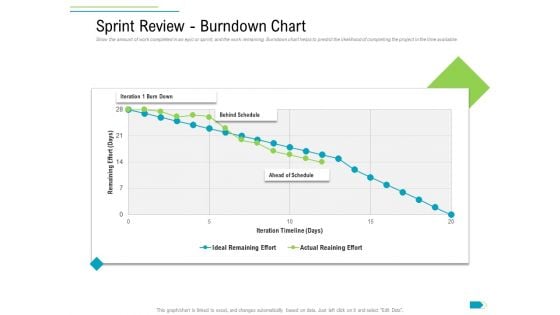
Agile Process Implementation For Marketing Program Sprint Review Burndown Chart Inspiration PDF
Show the amount of work completed in an epic or sprint, and the work remaining. Burndown chart helps to predict the likelihood of completing the project in the time available. Deliver an awe-inspiring pitch with this creative agile process implementation for marketing program sprint review burndown chart inspiration pdf bundle. Topics like iteration 1 burn down, behind schedule, ahead schedule, ideal remaining effort, actual reaining effort can be discussed with this completely editable template. It is available for immediate download depending on the needs and requirements of the user.
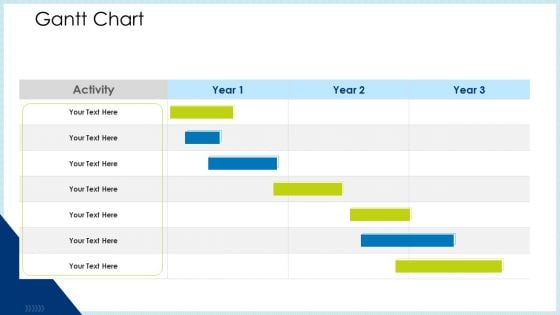
Technology Innovation Human Resource System Gantt Chart Ppt Show Deck PDF
Elucidate your project plan using our technology innovation human resource system gantt chart ppt show deck pdf. Capture the timeframe for every release by outlining crucial details like project beginning and end date, status, and assigned team. Establish coordination with other team members share your product plans, and discuss the project progress with the executives using this template. Furthermore, this task management chart helps you align your activities efficiently. Utilize the versatile nature of this template to initiate high-level resource planning and implement it flexibly for the benefit of your business. The slide is easy-to-edit so download it and schedule your projects resourcefully.
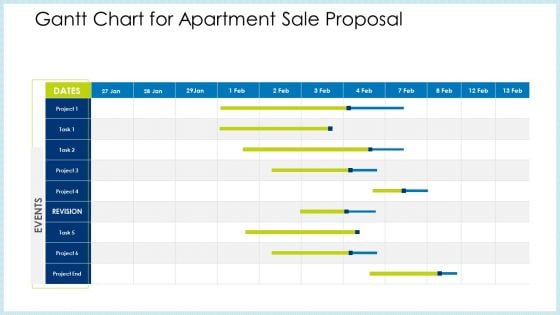
Technology Innovation Human Resource System Gantt Chart For Apartment Sale Proposal Template PDF
Elucidate your project plan using our technology innovation human resource system gantt chart for apartment sale proposal template pdf. Capture the timeframe for every release by outlining crucial details like project beginning and end date, status, and assigned team. Establish coordination with other team members share your product plans, and discuss the project progress with the executives using this template. Furthermore, this task management chart helps you align your activities efficiently. Utilize the versatile nature of this template to initiate high-level resource planning and implement it flexibly for the benefit of your business. The slide is easy-to-edit so download it and schedule your projects resourcefully.
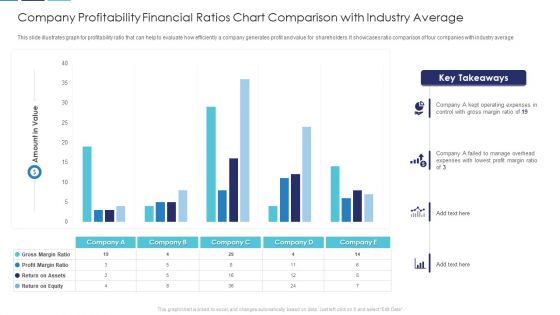
Company Profitability Financial Ratios Chart Comparison With Industry Average Download PDF
This slide illustrates graph for profitability ratio that can help to evaluate how efficiently a company generates profit and value for shareholders. It showcases ratio comparison of four companies with industry average Showcasing this set of slides titled company profitability financial ratios chart comparison with industry average download pdf. The topics addressed in these templates are company profitability financial ratios chart comparison with industry average. All the content presented in this PPT design is completely editable. Download it and make adjustments in color, background, font etc. as per your unique business setting.
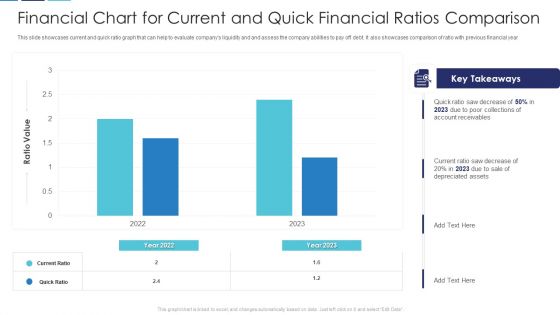
Financial Chart For Current And Quick Financial Ratios Comparison Brochure PDF
This slide showcases current and quick ratio graph that can help to evaluate companys liquidity and and assess the company abilities to pay off debt. It also showcases comparison of ratio with previous financial year Pitch your topic with ease and precision using this financial chart for current and quick financial ratios comparison brochure pdf. This layout presents information on financial chart for current and quick financial ratios comparison. It is also available for immediate download and adjustment. So, changes can be made in the color, design, graphics or any other component to create a unique layout.
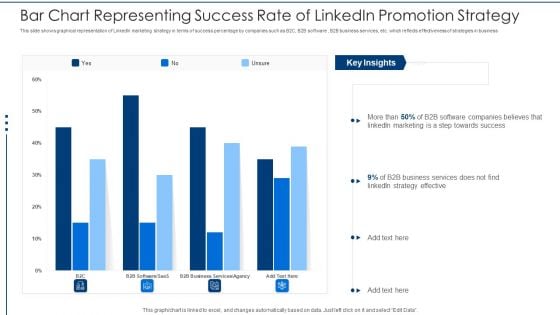
Bar Chart Representing Success Rate Of Linkedin Promotion Strategy Rules PDF
This slide shows graphical representation of LinkedIn marketing strategy in terms of success percentage by companies such as B2C, B2B software , B2B business services, etc. which reflects effectiveness of strategies in business Pitch your topic with ease and precision using this bar chart representing success rate of linkedin promotion strategy rules pdf. This layout presents information on bar chart representing success rate of linkedin promotion strategy. It is also available for immediate download and adjustment. So, changes can be made in the color, design, graphics or any other component to create a unique layout.
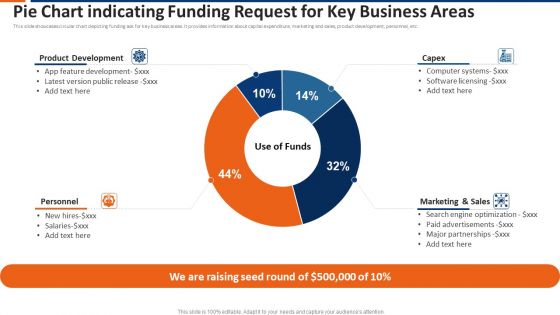
Pie Chart Indicating Funding Request For Key Business Areas Ppt Show Topics PDF
This slide showcases circular chart depicting funding ask for key business areas. It provides information about capital expenditure, marketing and sales, product development, personnel, etc. Pitch your topic with ease and precision using this pie chart indicating funding request for key business areas ppt show topics pdf. This layout presents information on product development, capex, marketing and sales, personnel. It is also available for immediate download and adjustment. So, changes can be made in the color, design, graphics or any other component to create a unique layout.
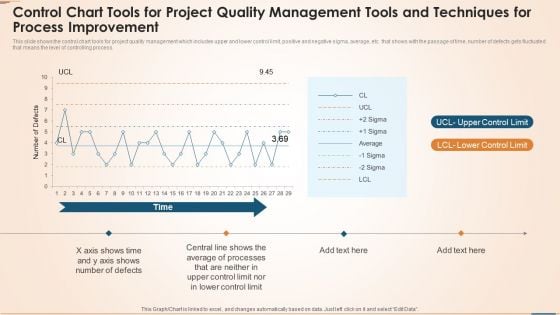
Control Chart Tools For Project Quality Management Tools And Techniques For Process Improvement Topics PDF
This slide shows the control chart tools for project quality management which includes upper and lower control limit, positive and negative sigma, average, etc. that shows with the passage of time, number of defects gets fluctuated that means the level of controlling process. Pitch your topic with ease and precision using this control chart tools for project quality management tools and techniques for process improvement topics pdf. This layout presents information on time, upper control limit, lower control limit. It is also available for immediate download and adjustment. So, changes can be made in the color, design, graphics or any other component to create a unique layout.
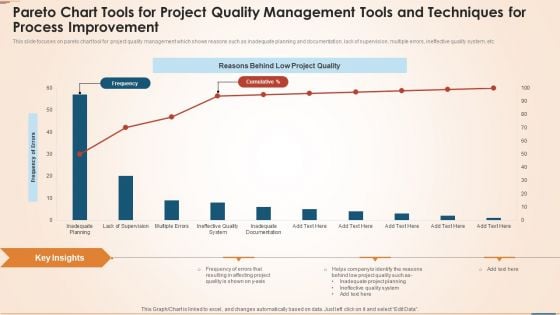
Pareto Chart Tools For Project Quality Management Tools And Techniques For Process Improvement Elements PDF
This slide focuses on pareto chart tool for project quality management which shows reasons such as inadequate planning and documentation, lack of supervision, multiple errors, ineffective quality system, etc. Pitch your topic with ease and precision using this pareto chart tools for project quality management tools and techniques for process improvement elements pdf. This layout presents information on frequency, reasons behind low project quality, frequency of errors, planning. It is also available for immediate download and adjustment. So, changes can be made in the color, design, graphics or any other component to create a unique layout.
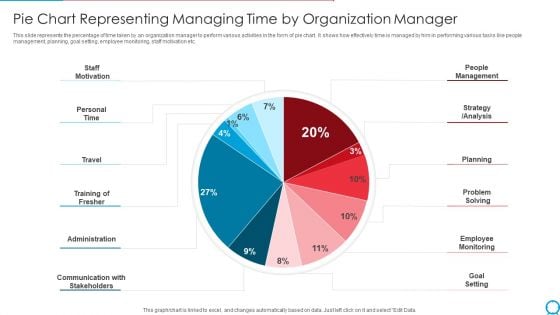
Pie Chart Representing Managing Time By Organization Manager Ppt PowerPoint Presentation Gallery Template PDF
This slide represents the percentage of time taken by an organization manager to perform various activities in the form of pie chart. It shows how effectively time is managed by him in performing various tasks like people management, planning, goal setting, employee monitoring, staff motivation etc. Pitch your topic with ease and precision using this pie chart representing managing time by organization manager ppt powerpoint presentation gallery template pdf. This layout presents information on staff motivation, personal time, travel training of fresher, administration. It is also available for immediate download and adjustment. So, changes can be made in the color, design, graphics or any other component to create a unique layout.
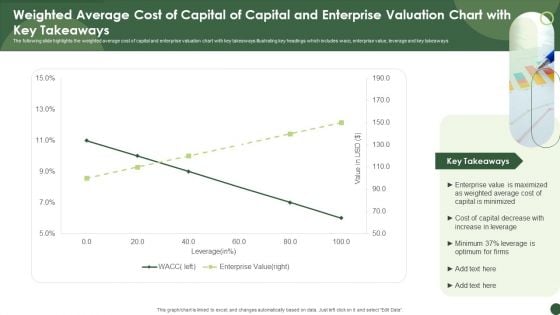
Weighted Average Cost Of Capital Of Capital And Enterprise Valuation Chart With Key Takeaways Inspiration PDF
The following slide highlights the weighted average cost of capital and enterprise valuation chart with key takeaways illustrating key headings which includes wacc, enterprise value, leverage and key takeaways. Pitch your topic with ease and precision using this Weighted Average Cost Of Capital Of Capital And Enterprise Valuation Chart With Key Takeaways Inspiration PDF. This layout presents information on Enterprise Value, Weighted Average, Capital Is Minimized. It is also available for immediate download and adjustment. So, changes can be made in the color, design, graphics or any other component to create a unique layout.
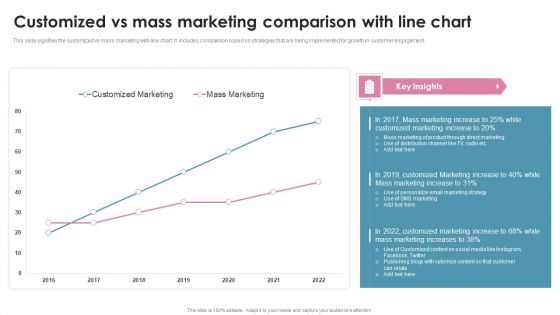
Customized Vs Mass Marketing Comparison With Line Chart Ppt PowerPoint Presentation File Ideas PDF
This slide signifies the customized vs mass marketing with line chart. It includes comparison based on strategies that are being implemented for growth in customer engagement. Pitch your topic with ease and precision using this Customized Vs Mass Marketing Comparison With Line Chart Ppt PowerPoint Presentation File Ideas PDF. This layout presents information on Customized Marketing, Mass Marketing, 2016 To 2022. It is also available for immediate download and adjustment. So, changes can be made in the color, design, graphics or any other component to create a unique layout.
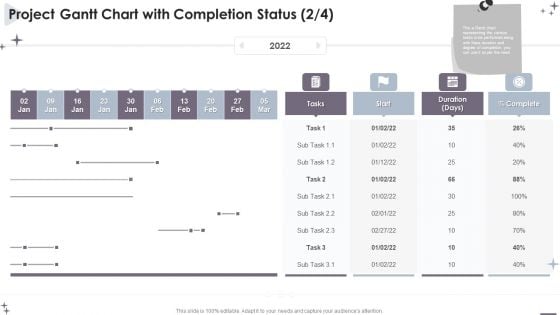
Project Administration Bundle Project Gantt Chart With Completion Status Designs PDF
Introducing our Project Administration Bundle Project Gantt Chart With Completion Status Designs PDF that is designed to showcase some of the vital components that will help you create timelines, roadmaps, and project plans. In addition, also communicate your project durations, milestones, tasks, subtasks, dependencies, and other attributes using this well structured Project Administration Bundle Project Gantt Chart With Completion Status Designs PDF template. You can also exhibit preeminence against time by deploying this easily adaptable slide to your business presentation. Our experts have designed this template in such a way that it is sure to impress your audience. Thus, download it and steer your project meetings, meetups, and conferences.

Pie Chart Showing Factors Impacting Elements Of Successful Project And Failure Graphics PDF
The following slide depicts the major reasons for project failure to avoid future reoccurrence. It includes elements such as ineffective management practices, poorly defined objectives, technical glitches etc. Showcasing this set of slides titled Pie Chart Showing Factors Impacting Elements Of Successful Project And Failure Graphics PDF. The topics addressed in these templates are Pie Chart Showing Factors, Impacting Elements, Successful Project And Failure. All the content presented in this PPT design is completely editable. Download it and make adjustments in color, background, font etc. as per your unique business setting.
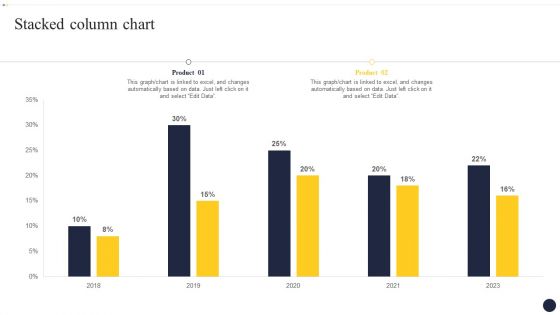
Integrating Naas Service Model To Enhance Stacked Column Chart Infographics PDF
Find highly impressive Integrating Naas Service Model To Enhance Stacked Column Chart Infographics PDF on Slidegeeks to deliver a meaningful presentation. You can save an ample amount of time using these presentation templates. No need to worry to prepare everything from scratch because Slidegeeks experts have already done a huge research and work for you. You need to download Integrating Naas Service Model To Enhance Stacked Column Chart Infographics PDF for your upcoming presentation. All the presentation templates are 100 percent editable and you can change the color and personalize the content accordingly. Download now.
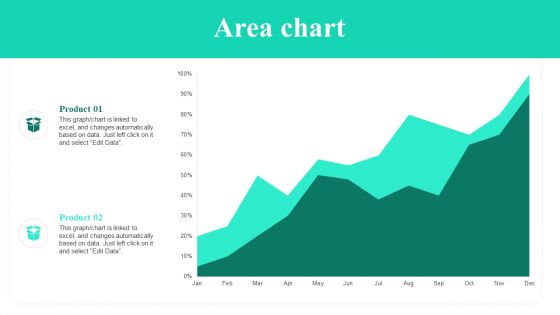
Adopting Flexible Work Policy Area Chart Ppt PowerPoint Presentation File Slideshow PDF
Do you have to make sure that everyone on your team knows about any specific topic I yes, then you should give Adopting Flexible Work Policy Area Chart Ppt PowerPoint Presentation File Slideshow PDF a try. Our experts have put a lot of knowledge and effort into creating this impeccable Adopting Flexible Work Policy Area Chart Ppt PowerPoint Presentation File Slideshow PDF. You can use this template for your upcoming presentations, as the slides are perfect to represent even the tiniest detail. You can download these templates from the Slidegeeks website and these are easy to edit. So grab these today.
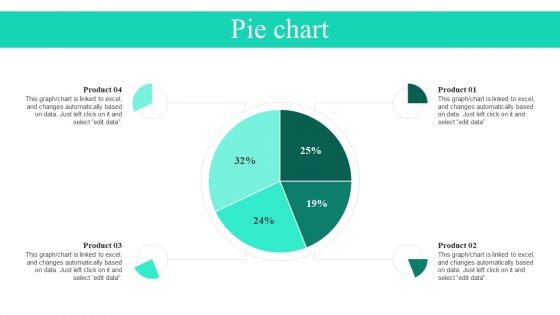
Adopting Flexible Work Policy Pie Chart Ppt PowerPoint Presentation File Layouts PDF
Do you have an important presentation coming up Are you looking for something that will make your presentation stand out from the rest Look no further than Adopting Flexible Work Policy Pie Chart Ppt PowerPoint Presentation File Layouts PDF. With our professional designs, you can trust that your presentation will pop and make delivering it a smooth process. And with Slidegeeks, you can trust that your presentation will be unique and memorable. So why wait Grab Adopting Flexible Work Policy Pie Chart Ppt PowerPoint Presentation File Layouts PDF today and make your presentation stand out from the rest.
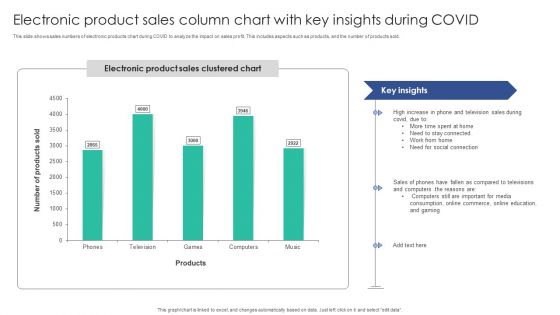
Electronic Product Sales Column Chart With Key Insights During COVID Microsoft PDF
This slide shows sales numbers of electronic products chart during COVID to analyze the impact on sales profit. This includes aspects such as products, and the number of products sold. Pitch your topic with ease and precision using this Electronic Product Sales Column Chart With Key Insights During COVID Microsoft PDF. This layout presents information on Stay Connected, Social Connection, Compared Televisions. It is also available for immediate download and adjustment. So, changes can be made in the color, design, graphics or any other component to create a unique layout.
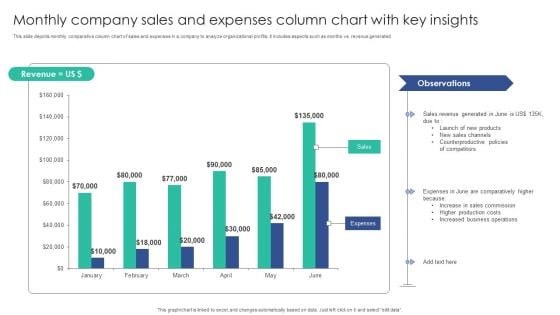
Monthly Company Sales And Expenses Column Chart With Key Insights Mockup PDF
This slide depicts monthly comparative column chart of sales and expenses in a company to analyze organizational profits. It includes aspects such as months vs. revenue generatedPitch your topic with ease and precision using this Monthly Company Sales And Expenses Column Chart With Key Insights Mockup PDF. This layout presents information on Sales Channels, Counterproductive Policies, Sales Commission. It is also available for immediate download and adjustment. So, changes can be made in the color, design, graphics or any other component to create a unique layout.
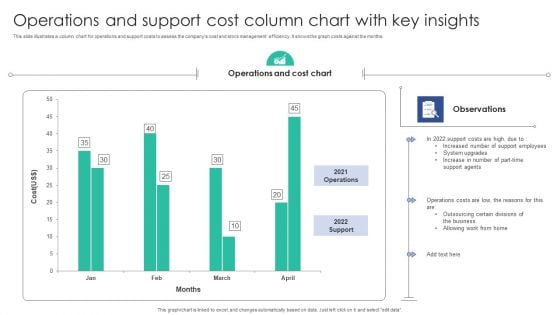
Operations And Support Cost Column Chart With Key Insights Background PDF
This slide illustrates a column chart for operations and support costs to assess the companys cost and stock management efficiency. It shows the graph costs against the months.Showcasing this set of slides titled Operations And Support Cost Column Chart With Key Insights Background PDF. The topics addressed in these templates are Operations Cost, Support Agents, Support Employees. All the content presented in this PPT design is completely editable. Download it and make adjustments in color, background, font etc. as per your unique business setting.
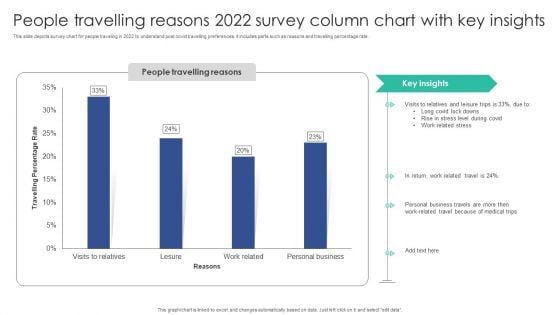
People Travelling Reasons 2022 Survey Column Chart With Key Insights Sample PDF
This slide depicts survey chart for people traveling in 2022 to understand post covid travelling preferences. It includes parts such as reasons and travelling percentage rate.Pitch your topic with ease and precision using this People Travelling Reasons 2022 Survey Column Chart With Key Insights Sample PDF. This layout presents information on Visits Relatives, Leisure Trips, Personal Business. It is also available for immediate download and adjustment. So, changes can be made in the color, design, graphics or any other component to create a unique layout.
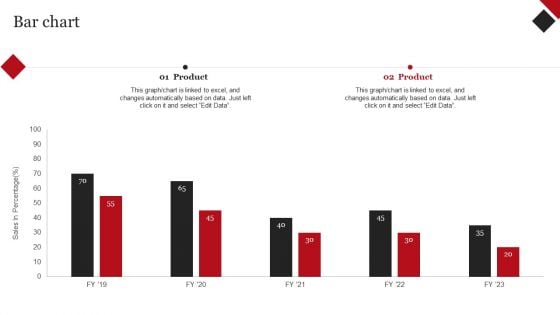
Coca Cola Emotional Marketing Strategy Bar Chart Ppt Professional Picture PDF
This Coca Cola Emotional Marketing Strategy Bar Chart Ppt Professional Picture PDF is perfect for any presentation, be it in front of clients or colleagues. It is a versatile and stylish solution for organizing your meetings. The Coca Cola Emotional Marketing Strategy Bar Chart Ppt Professional Picture PDF features a modern design for your presentation meetings. The adjustable and customizable slides provide unlimited possibilities for acing up your presentation. Slidegeeks has done all the homework before launching the product for you. So, dont wait, grab the presentation templates today
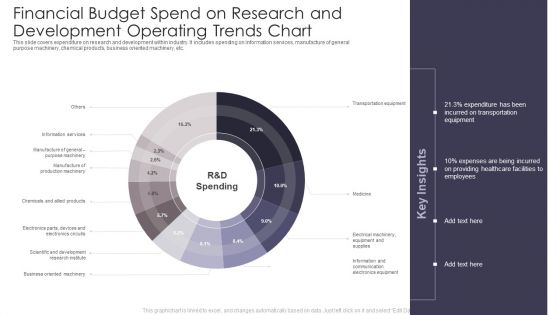
Financial Budget Spend On Research And Development Operating Trends Chart Professional PDF
This slide covers expenditure on research and development within industry. It includes spending on information services, manufacture of general purpose machinery, chemical products, business oriented machinery, etc. Pitch your topic with ease and precision using this Financial Budget Spend On Research And Development Operating Trends Chart Professional PDF. This layout presents information on Transportation Equipment, Healthcare Facilities, Trends Chart. It is also available for immediate download and adjustment. So, changes can be made in the color, design, graphics or any other component to create a unique layout.
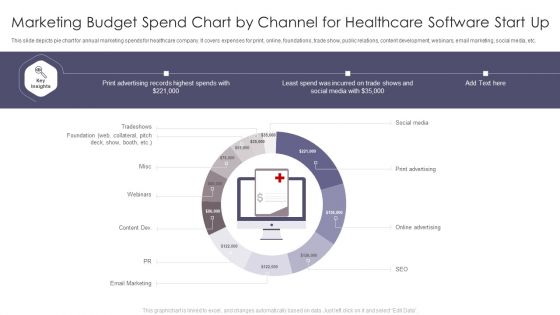
Marketing Budget Spend Chart By Channel For Healthcare Software Start Up Summary PDF
This slide depicts pie chart for annual marketing spends for healthcare company. It covers expenses for print, online, foundations, trade show, public relations, content development, webinars, email marketing, social media, etc. Showcasing this set of slides titled Marketing Budget Spend Chart By Channel For Healthcare Software Start Up Summary PDF. The topics addressed in these templates areTradeshows, Social Media, Print Advertising. All the content presented in this PPT design is completely editable. Download it and make adjustments in color, background, font etc. as per your unique business setting.
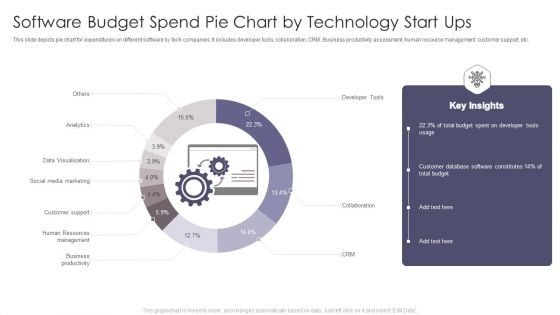
Software Budget Spend Pie Chart By Technology Start Ups Designs PDF
This slide depicts pie chart for expenditures on different software by tech companies. It includes developer tools, collaboration, CRM, Business productivity assessment, human resource management, customer support, etc. Showcasing this set of slides titled Software Budget Spend Pie Chart By Technology Start Ups Designs PDF. The topics addressed in these templates are Total Budget, Developer Tools, Total Budget. All the content presented in this PPT design is completely editable. Download it and make adjustments in color, background, font etc. as per your unique business setting.
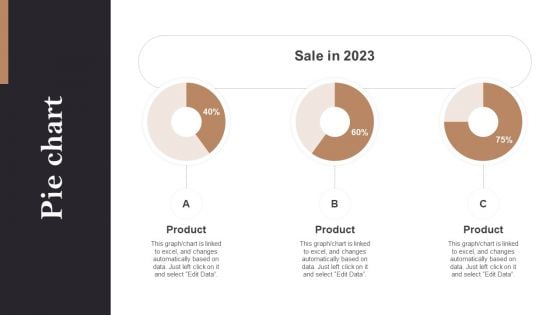
Pie Chart Opening Retail Store In Untapped Industry For Sales Growth Information PDF
Do you have an important presentation coming up Are you looking for something that will make your presentation stand out from the rest Look no further than Pie Chart Opening Retail Store In Untapped Industry For Sales Growth Information PDF. With our professional designs, you can trust that your presentation will pop and make delivering it a smooth process. And with Slidegeeks, you can trust that your presentation will be unique and memorable. So why wait Grab Pie Chart Opening Retail Store In Untapped Industry For Sales Growth Information PDF today and make your presentation stand out from the rest.
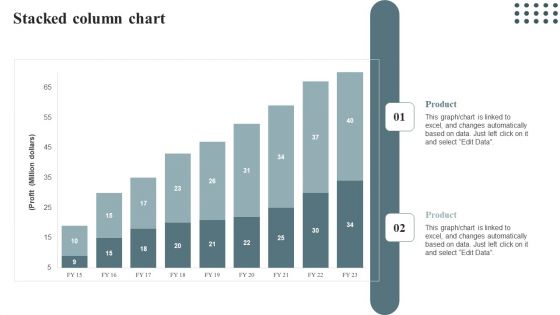
Stacked Column Chart Techniques For Enhancing Buyer Acquisition Approach Ideas PDF
Get a simple yet stunning designed Stacked Column Chart Techniques For Enhancing Buyer Acquisition Approach Ideas PDF. It is the best one to establish the tone in your meetings. It is an excellent way to make your presentations highly effective. So, download this PPT today from Slidegeeks and see the positive impacts. Our easy-to-edit Stacked Column Chart Techniques For Enhancing Buyer Acquisition Approach Ideas PDF can be your go-to option for all upcoming conferences and meetings. So, what are you waiting for Grab this template today.
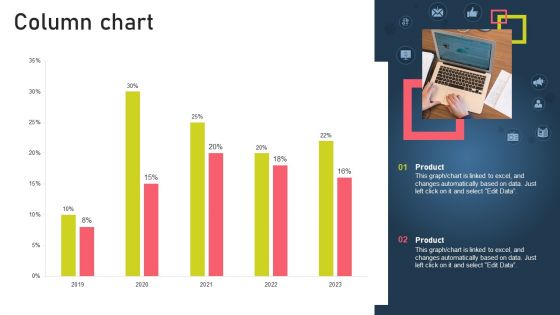
Strategies For Acquiring Online And Offline Clients Column Chart Clipart PDF
Find highly impressive Strategies For Acquiring Online And Offline Clients Column Chart Clipart PDF on Slidegeeks to deliver a meaningful presentation. You can save an ample amount of time using these presentation templates. No need to worry to prepare everything from scratch because Slidegeeks experts have already done a huge research and work for you. You need to download Strategies For Acquiring Online And Offline Clients Column Chart Clipart PDF for your upcoming presentation. All the presentation templates are 100 percent editable and you can change the color and personalize the content accordingly. Download now.
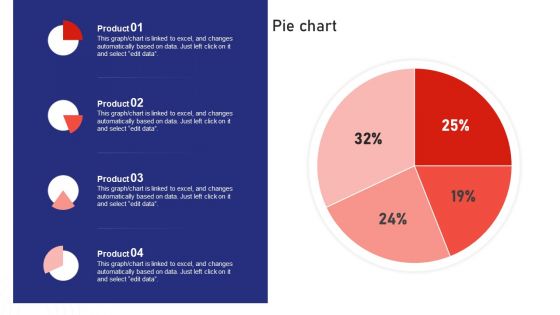
Sales Risk Assessment Profit Maximization Team Performance Enhancement Pie Chart Clipart PDF
Do you have an important presentation coming up Are you looking for something that will make your presentation stand out from the rest Look no further than Sales Risk Assessment Profit Maximization Team Performance Enhancement Pie Chart Clipart PDF. With our professional designs, you can trust that your presentation will pop and make delivering it a smooth process. And with Slidegeeks, you can trust that your presentation will be unique and memorable. So why wait Grab Sales Risk Assessment Profit Maximization Team Performance Enhancement Pie Chart Clipart PDF today and make your presentation stand out from the rest.
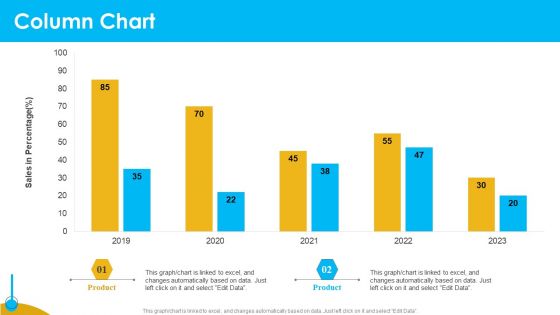
Approaches To Targeting New Customers In Various Markets Column Chart Mockup PDF
Here you can discover an assortment of the finest PowerPoint and Google Slides templates. With these templates, you can create presentations for a variety of purposes while simultaneously providing your audience with an eye catching visual experience. Download Approaches To Targeting New Customers In Various Markets Column Chart Mockup PDF to deliver an impeccable presentation. These templates will make your job of preparing presentations much quicker, yet still, maintain a high level of quality. Slidegeeks has experienced researchers who prepare these templates and write high quality content for you. Later on, you can personalize the content by editing the Approaches To Targeting New Customers In Various Markets Column Chart Mockup PDF.
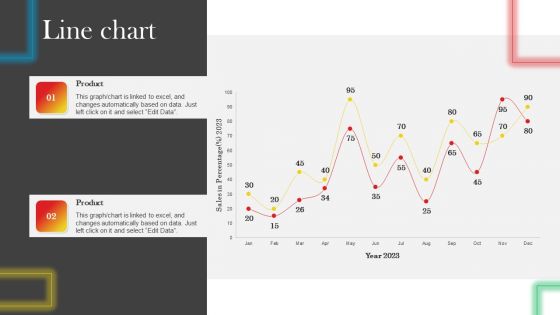
Line Chart Data Driven Promotional Guide To Increase Return On Investment Slides PDF
Find highly impressive Line Chart Data Driven Promotional Guide To Increase Return On Investment Slides PDF on Slidegeeks to deliver a meaningful presentation. You can save an ample amount of time using these presentation templates. No need to worry to prepare everything from scratch because Slidegeeks experts have already done a huge research and work for you. You need to download Line Chart Data Driven Promotional Guide To Increase Return On Investment Slides PDF for your upcoming presentation. All the presentation templates are 100 percent editable and you can change the color and personalize the content accordingly. Download now
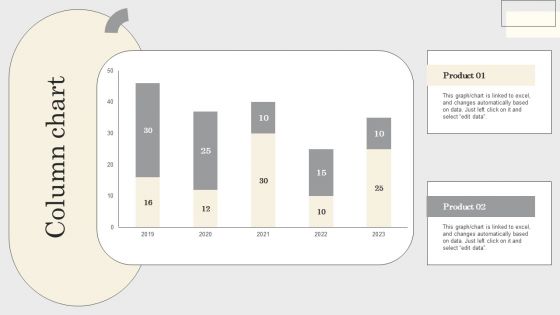
Steps To Conduct Competitor Analysis Column Chart Ppt Model Gridlines PDF
This graph or chart is linked to excel, and changes automatically based on data. Just left click on it and select edit data. If your project calls for a presentation, then Slidegeeks is your go-to partner because we have professionally designed, easy-to-edit templates that are perfect for any presentation. After downloading, you can easily edit Steps To Conduct Competitor Analysis Column Chart Ppt Model Gridlines PDF and make the changes accordingly. You can rearrange slides or fill them with different images. Check out all the handy templates
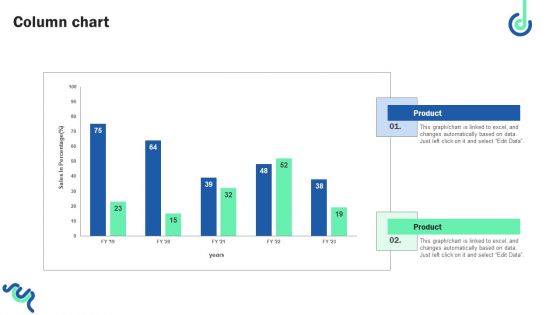
Digital Shopper Marketing Strategy To Capture Customer Interest Column Chart Introduction PDF
Create an editable Digital Shopper Marketing Strategy To Capture Customer Interest Column Chart Introduction PDF that communicates your idea and engages your audience. Whether you are presenting a business or an educational presentation, pre designed presentation templates help save time. Digital Shopper Marketing Strategy To Capture Customer Interest Column Chart Introduction PDF is highly customizable and very easy to edit, covering many different styles from creative to business presentations. Slidegeeks has creative team members who have crafted amazing templates. So, go and get them without any delay.
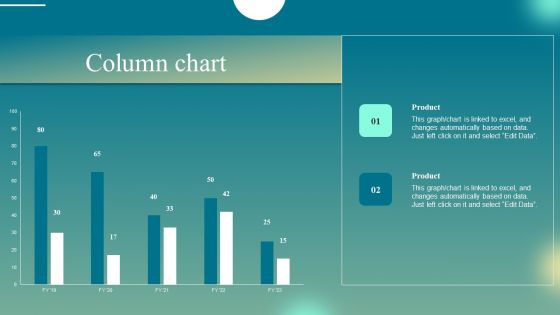
Deploying Iot Solutions In The Retail Market Column Chart Information PDF
Explore a selection of the finest Deploying Iot Solutions In The Retail Market Column Chart Information PDF here. With a plethora of professionally designed and pre-made slide templates, you can quickly and easily find the right one for your upcoming presentation. You can use our Deploying Iot Solutions In The Retail Market Column Chart Information PDF to effectively convey your message to a wider audience. Slidegeeks has done a lot of research before preparing these presentation templates. The content can be personalized and the slides are highly editable. Grab templates today from Slidegeeks.
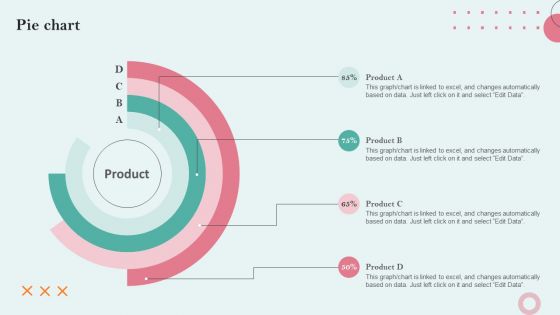
Strategies Employing PPC Advertising To Generate High Quality Leads Pie Chart Information PDF
Here you can discover an assortment of the finest PowerPoint and Google Slides templates. With these templates, you can create presentations for a variety of purposes while simultaneously providing your audience with an eye catching visual experience. Download Strategies Employing PPC Advertising To Generate High Quality Leads Pie Chart Information PDF to deliver an impeccable presentation. These templates will make your job of preparing presentations much quicker, yet still, maintain a high level of quality. Slidegeeks has experienced researchers who prepare these templates and write high quality content for you. Later on, you can personalize the content by editing the Strategies Employing PPC Advertising To Generate High Quality Leads Pie Chart Information PDF.
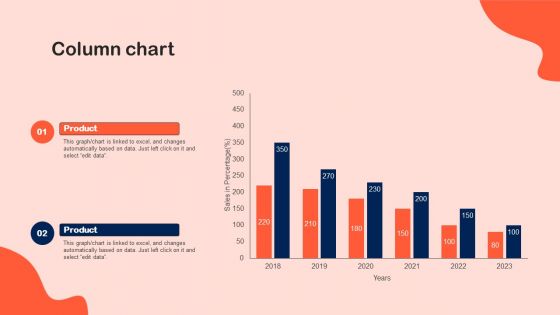
Column Chart Shopper Marketing Initiatives To Boost Retail Store Performance Brochure PDF
Here you can discover an assortment of the finest PowerPoint and Google Slides templates. With these templates, you can create presentations for a variety of purposes while simultaneously providing your audience with an eye catching visual experience. Download Column Chart Shopper Marketing Initiatives To Boost Retail Store Performance Brochure PDF to deliver an impeccable presentation. These templates will make your job of preparing presentations much quicker, yet still, maintain a high level of quality. Slidegeeks has experienced researchers who prepare these templates and write high quality content for you. Later on, you can personalize the content by editing the Column Chart Shopper Marketing Initiatives To Boost Retail Store Performance Brochure PDF.
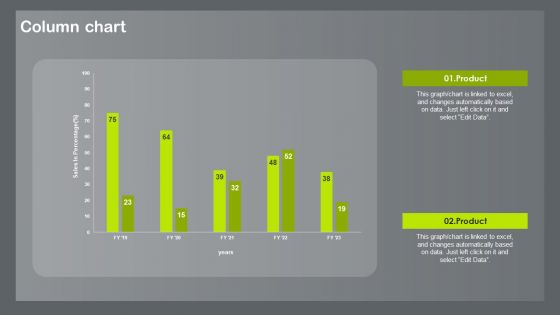
Shopper And Client Marketing Plan To Boost Sales Column Chart Inspiration PDF
Do you have to make sure that everyone on your team knows about any specific topic I yes, then you should give Shopper And Client Marketing Plan To Boost Sales Column Chart Inspiration PDF a try. Our experts have put a lot of knowledge and effort into creating this impeccable Shopper And Client Marketing Plan To Boost Sales Column Chart Inspiration PDF. You can use this template for your upcoming presentations, as the slides are perfect to represent even the tiniest detail. You can download these templates from the Slidegeeks website and these are easy to edit. So grab these today.
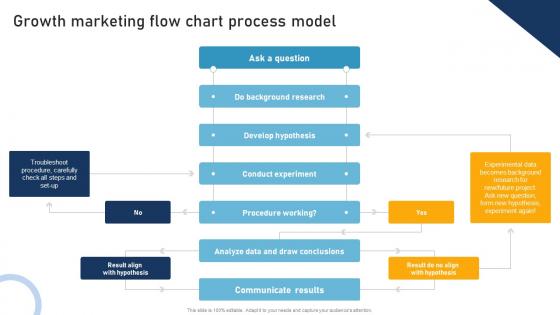
A Comprehensive Approach To Growth Marketing Flow Chart Process Model MKT SS V
From laying roadmaps to briefing everything in detail, our templates are perfect for you. You can set the stage with your presentation slides. All you have to do is download these easy-to-edit and customizable templates. A Comprehensive Approach To Growth Marketing Flow Chart Process Model MKT SS V will help you deliver an outstanding performance that everyone would remember and praise you for. Do download this presentation today. Our A Comprehensive Approach To Growth Marketing Flow Chart Process Model MKT SS V are topically designed to provide an attractive backdrop to any subject. Use them to look like a presentation pro.
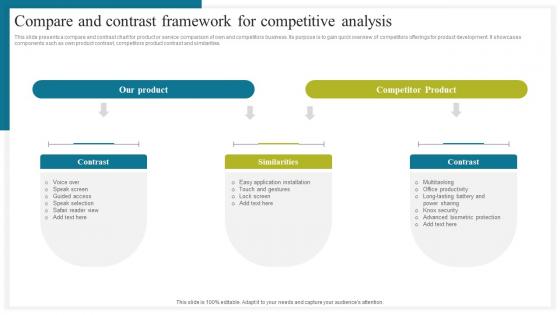
Compare And Contrast Framework How To Conduct Competitive Assessment Themes Pdf
This slide presents a compare and contrast chart for product or service comparison of own and competitors business. Its purpose is to gain quick overview of competitors offerings for product development. It showcases components such as own product contrast, competitors product contrast and similarities. Slidegeeks is here to make your presentations a breeze with Compare And Contrast Framework How To Conduct Competitive Assessment Themes Pdf With our easy to use and customizable templates, you can focus on delivering your ideas rather than worrying about formatting. With a variety of designs to choose from, you are sure to find one that suits your needs. And with animations and unique photos, illustrations, and fonts, you can make your presentation pop. So whether you are giving a sales pitch or presenting to the board, make sure to check out Slidegeeks first. This slide presents a compare and contrast chart for product or service comparison of own and competitors business. Its purpose is to gain quick overview of competitors offerings for product development. It showcases components such as own product contrast, competitors product contrast and similarities.
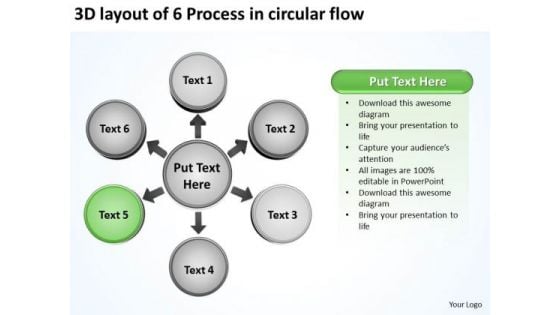
3d Layout Of 6 Process In Circular Flow Ppt Chart PowerPoint Templates
We present our 3d layout of 6 process in circular flow ppt Chart PowerPoint templates.Download and present our Circle Charts PowerPoint Templates because educate your staff on the means to provide the required support for speedy recovery. Use our Process and Flows PowerPoint Templates because our PowerPoint templates designed for your ideas to sell. Download and present our Success PowerPoint Templates because your quest has taken you well onto the path of success. Download and present our Business PowerPoint Templates because The foundation of the structure of your business is resilient and dependable. Convey this confidence to your colleagues and assure them of a great and enduring future. Present our Marketing PowerPoint Templates because educate your staff on the means to provide the required support for speedy recovery.Use these PowerPoint slides for presentations relating to Access, arrow, background, blue, bright, business, chart,circle, color, colorful, concept,conceptual, connection, corporate,creative, cycle, design, different, element,empty, flower, form, frame, graphic,green, group, idea, illustration, match,message, order, part, piece, place,process, red, shape, solution, special,speech, strategy, symbol. The prominent colors used in the PowerPoint template are Green dark , Gray, Black. The feedback we get is that our 3d layout of 6 process in circular flow ppt Chart PowerPoint templates are Amazing. The feedback we get is that our background PowerPoint templates and PPT Slides are Fashionable. Presenters tell us our 3d layout of 6 process in circular flow ppt Chart PowerPoint templates are Upbeat. The feedback we get is that our blue PowerPoint templates and PPT Slides are Stylish. PowerPoint presentation experts tell us our 3d layout of 6 process in circular flow ppt Chart PowerPoint templates are readymade to fit into any presentation structure. Customers tell us our background PowerPoint templates and PPT Slides are Clever. Collect feedback with our 3d Layout Of 6 Process In Circular Flow Ppt Chart PowerPoint Templates. Download without worries with our money back guaranteee.
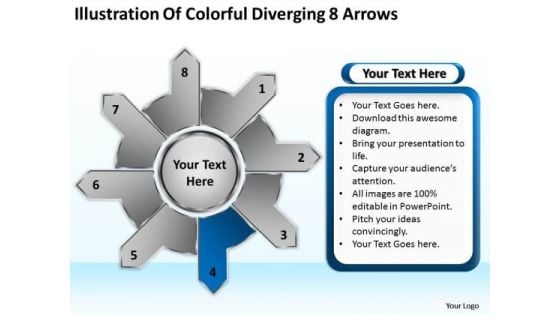
Illustration Of Colorful Diverging 8 Arrows Chart Circular Flow Process PowerPoint Slides
We present our illustration of colorful diverging 8 arrows chart Circular Flow Process PowerPoint Slides.Download and present our Process and Flows PowerPoint Templates because the world over it is a priority for many. Along with it there are so many oppurtunities waiting to be utilised. Download our Success PowerPoint Templates because it have all to represent to your viewers. Download our Arrows PowerPoint Templates because Communicating your ideas may help your venture profit from this interaction. Download and present our Flow charts PowerPoint Templates because the fruit of your labour is about to ripen. Download our Shapes PowerPoint Templates because Our PowerPoint Templates and Slides help you meet the demand of the Market. Just browse and pick the slides that appeal to your intuitive senses.Use these PowerPoint slides for presentations relating to Access, arrow, background,banner, blue, bright, business, chart,circle, color, colorful, concept,conceptual, connection, corporate,creative, cycle, design, different, element,empty, form, frame, graphic, green,group, idea, illustration, match,message, order, part, piece, place,process, red, shape, solution, special,speech, strategy, symbol. The prominent colors used in the PowerPoint template are Blue navy, White, Black. People tell us our illustration of colorful diverging 8 arrows chart Circular Flow Process PowerPoint Slides are Spectacular. Customers tell us our bright PowerPoint templates and PPT Slides are Excellent. Professionals tell us our illustration of colorful diverging 8 arrows chart Circular Flow Process PowerPoint Slides are Wistful. Presenters tell us our circle PowerPoint templates and PPT Slides are Flirty. Use our illustration of colorful diverging 8 arrows chart Circular Flow Process PowerPoint Slides are Colorful. Presenters tell us our business PowerPoint templates and PPT Slides are Vintage. Exert some pressure with our Illustration Of Colorful Diverging 8 Arrows Chart Circular Flow Process PowerPoint Slides. Get the decision in your favour.
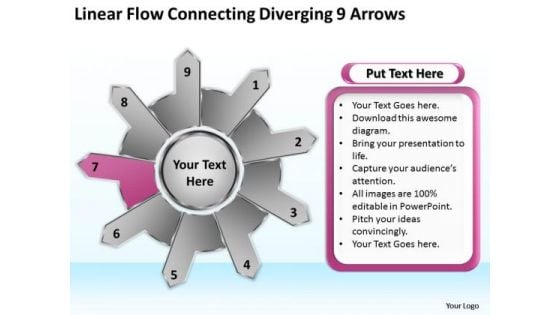
Linear Flow Connecting Diverging 9 Arrows Flow Circular Process Chart PowerPoint Templates
We present our linear flow connecting diverging 9 arrows flow Circular Process Chart PowerPoint templates.Present our Process and Flows PowerPoint Templates because they are Gauranteed to focus the minds of your team. Download and present our Business PowerPoint Templates because you can see clearly through to the bigger bowl ahead. Time your jump to perfection and hit the nail on the head. Use our Arrows PowerPoint Templates because there is a very good saying that prevention is better than cure, either way you have a store of knowledge for sure. Download our Signs PowerPoint Templates because you know that the core of any organisation is the people who work for it. Download our Flow charts PowerPoint Templates because business ethics is an essential element in your growth.Use these PowerPoint slides for presentations relating to Abstract, access, arrow, blue, bright, business, chart,circle, color, colorful, concept,conceptual, connection, corporate,creative, cycle, design, different, element,empty, form, frame, graphic, green,group, idea, illustration, order, part, piece, place,process, red, shape, solution, special,speech, strategy, symbol. The prominent colors used in the PowerPoint template are Pink, Black, White. People tell us our linear flow connecting diverging 9 arrows flow Circular Process Chart PowerPoint templates are Dynamic. Customers tell us our color PowerPoint templates and PPT Slides are Beautiful. Professionals tell us our linear flow connecting diverging 9 arrows flow Circular Process Chart PowerPoint templates are Bright. Presenters tell us our bright PowerPoint templates and PPT Slides are Charming. Use our linear flow connecting diverging 9 arrows flow Circular Process Chart PowerPoint templates are Wonderful. Presenters tell us our bright PowerPoint templates and PPT Slides are Great. Create the right environment for prosperity. Fashion the right conditions with our Linear Flow Connecting Diverging 9 Arrows Flow Circular Process Chart PowerPoint Templates.
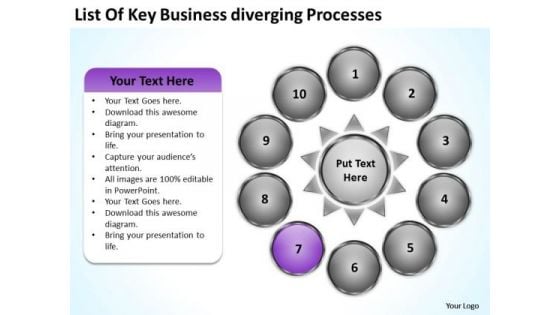
Nine Stages Diverging Factors Flow Chart Ppt Circular Network PowerPoint Templates
We present our nine stages diverging factors flow chart ppt Circular Network PowerPoint templates.Download our Success PowerPoint Templates because iT outlines the entire thought process for the benefit of others. Tell it to the world with your characteristic aplomb. Use our Arrows PowerPoint Templates because if making a mark is your obsession, then let others get Obsessed with you. Download our Flow charts PowerPoint Templates because you can Educate your listeners on the means to keep it ticking over. Download and present our Process and Flows PowerPoint Templates because this slide can help to bullet point your views. Download our Shapes PowerPoint Templates because the graphic is a symbol of growth and success.Use these PowerPoint slides for presentations relating to Access, arrow,blue, bright, business, chart,circle, color, colorful, concept,conceptual, connection, corporate,creative, cycle, design, different, element,empty, form, frame, graphic, green,group, idea, illustration, order, part, piece, place,process, red, shape, solution, special,speech, strategy, symbol. The prominent colors used in the PowerPoint template are Purple, Gray, Black. People tell us our nine stages diverging factors flow chart ppt Circular Network PowerPoint templates are Dazzling. Customers tell us our blue PowerPoint templates and PPT Slides are Ritzy. Professionals tell us our nine stages diverging factors flow chart ppt Circular Network PowerPoint templates are Cheerful. Presenters tell us our business PowerPoint templates and PPT Slides are Nostalgic. Use our nine stages diverging factors flow chart ppt Circular Network PowerPoint templates are Lush. Presenters tell us our circle PowerPoint templates and PPT Slides will make the presenter successul in his career/life. Achieve productivity improvement with our Nine Stages Diverging Factors Flow Chart Ppt Circular Network PowerPoint Templates. They will make you look good.
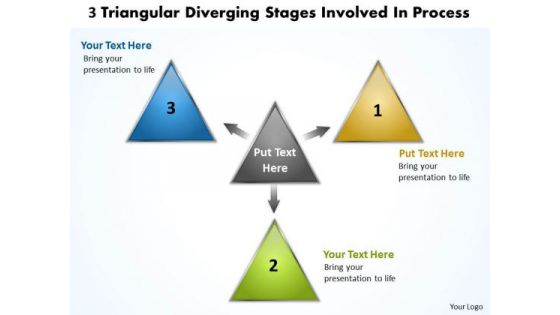
3 Triangular Diverging Stages Involved Process Circular Flow Chart PowerPoint Slides
We present our 3 triangular diverging stages involved process Circular Flow Chart PowerPoint Slides.Use our Triangles PowerPoint Templates because Communicating your ideas may help your venture profit from this interaction. Download our Arrows PowerPoint Templates because the graphic is a symbol of growth and success. Download and present our Business PowerPoint Templates because like the famed William Tell, they put aside all emotions and concentrate on the target. Download and present our Shapes PowerPoint Templates because Our PowerPoint Templates and Slides will let you Leave a lasting impression to your audiences. They possess an inherent longstanding recall factor. Use our Flow Charts PowerPoint Templates because this one depicts the popular chart.Use these PowerPoint slides for presentations relating to abstract, act, arrow, art, artistic, background, banner, bio, bloom, blossom, blue, boost, circle, cleaning, concept, creative, decide, decision, design, direction, eco, effect, floral, flourish, flower, fresh, function, graphic, idea, illustration, increase, journey, label, modern, operate, path, pattern, process, round, sale, silhouette, single, sticker, stylish, template, thrive, triangle, triangular, wallpaper, way. The prominent colors used in the PowerPoint template are Brown, Green, Blue. Presenters tell us our 3 triangular diverging stages involved process Circular Flow Chart PowerPoint Slides are Tranquil. You can be sure our banner PowerPoint templates and PPT Slides are Fabulous. Professionals tell us our 3 triangular diverging stages involved process Circular Flow Chart PowerPoint Slides are Magical. People tell us our art PowerPoint templates and PPT Slides are Majestic. People tell us our 3 triangular diverging stages involved process Circular Flow Chart PowerPoint Slides are effectively colour coded to prioritise your plans They automatically highlight the sequence of events you desire. Professionals tell us our bio PowerPoint templates and PPT Slides will impress their bosses and teams. Prepare to take-off with our 3 Triangular Diverging Stages Involved Process Circular Flow Chart PowerPoint Slides. Fasten your seat belt for a fantastic journey.
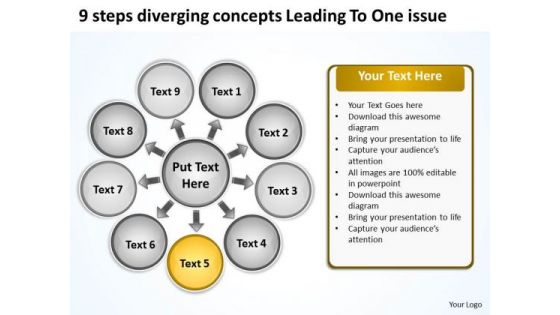
Steps Diverging Concepts Leading To One Issue Circular Flow Arrow Chart PowerPoint Templates
We present our steps diverging concepts leading to one issue Circular Flow Arrow Chart PowerPoint templates.Download and present our Business PowerPoint Templates because like the famed William Tell, they put aside all emotions and concentrate on the target. Download our Success PowerPoint Templates because it is the time to bond with family, friends, colleagues and any other group of your choice. Present our Flow Charts PowerPoint Templates because educate your staff on the means to provide the required support for speedy recovery. Use our Shapes PowerPoint Templates because you can Transmit your passion via our creative templates. Download and present our Arrows PowerPoint Templates because it shows the pyramid which is a symbol of the desire to reach the top in a steady manner.Use these PowerPoint slides for presentations relating to Access, Arrow, Background, Bright, Business, Chart, Colorful, Concept, Connection, Creative, Design, Different, Graphic, Group, Idea, Illustration, Part, Process, Shape, Strategy, Symbol, Template, Usable, Vector, Web, Website. The prominent colors used in the PowerPoint template are Yellow, White, Gray. People tell us our steps diverging concepts leading to one issue Circular Flow Arrow Chart PowerPoint templates are Splendid. People tell us our Business PowerPoint templates and PPT Slides are Graceful. The feedback we get is that our steps diverging concepts leading to one issue Circular Flow Arrow Chart PowerPoint templates are Colorful. Presenters tell us our Background PowerPoint templates and PPT Slides are Clever. Customers tell us our steps diverging concepts leading to one issue Circular Flow Arrow Chart PowerPoint templates will help them to explain complicated concepts. The feedback we get is that our Business PowerPoint templates and PPT Slides are Clever. Run your eyes over our Steps Diverging Concepts Leading To One Issue Circular Flow Arrow Chart PowerPoint Templates. They will appeal at the first examination.
Gears Industrial PowerPoint Themes And PowerPoint Slides 0511
Microsoft PowerPoint Slide and Theme with business technology Theme Your ideas will raise the stocks. Gain equity with our Gears Industrial PowerPoint Themes And PowerPoint Slides 0511.
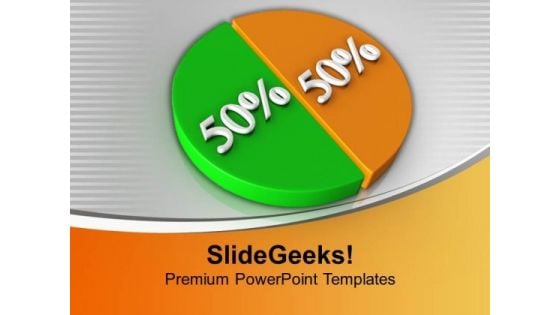
Pie Chart Showing 50 50 Factors Growth PowerPoint Templates Ppt Backgrounds For Slides 0213
We present our Pie Chart Showing 50 50 Factors Growth PowerPoint Templates PPT Backgrounds For Slides 0213.Download and present our Business PowerPoint Templates because Our PowerPoint Templates and Slides are specially created by a professional team with vast experience. They diligently strive to come up with the right vehicle for your brilliant Ideas. Present our Finance PowerPoint Templates because Our PowerPoint Templates and Slides offer you the widest possible range of options. Download and present our Signs PowerPoint Templates because You should Press the right buttons with our PowerPoint Templates and Slides. They will take your ideas down the perfect channel. Download and present our Circle Charts PowerPoint Templates because You are working at that stage with an air of royalty. Let our PowerPoint Templates and Slides be the jewels in your crown. Present our Marketing PowerPoint Templates because You can Create a matrix with our PowerPoint Templates and Slides. Feel the strength of your ideas click into place.Use these PowerPoint slides for presentations relating to Pie chart with fifty fifty percent, business, finance, marketing, circle charts, signs. The prominent colors used in the PowerPoint template are Green, Orange, White. Our Pie Chart Showing 50 50 Factors Growth PowerPoint Templates Ppt Backgrounds For Slides 0213 are like field glasses. Get a clearer view of events in the distance.

Pie Chart 80 20 Percent Growth PowerPoint Templates Ppt Backgrounds For Slides 0213
We present our Pie Chart 80 20 Percent Growth PowerPoint Templates PPT Backgrounds For Slides 0213.Download and present our Business PowerPoint Templates because It can Conjure up grand ideas with our magical PowerPoint Templates and Slides. Leave everyone awestruck by the end of your presentation. Use our Marketing PowerPoint Templates because You aspire to touch the sky with glory. Let our PowerPoint Templates and Slides provide the fuel for your ascent. Download and present our Finance PowerPoint Templates because You will get more than you ever bargained for. Download our Circle Charts PowerPoint Templates because It can Bubble and burst with your ideas. Present our Success PowerPoint Templates because Timeline crunches are a fact of life. Meet all deadlines using our PowerPoint Templates and Slides.Use these PowerPoint slides for presentations relating to Pie Chart 80 20 Percent, business, marketing, finance, circle charts, success. The prominent colors used in the PowerPoint template are Green, Yellow, White. Achieve high-performance with our Pie Chart 80 20 Percent Growth PowerPoint Templates Ppt Backgrounds For Slides 0213. They will make you look good.


 Continue with Email

 Home
Home


