key performance indicators
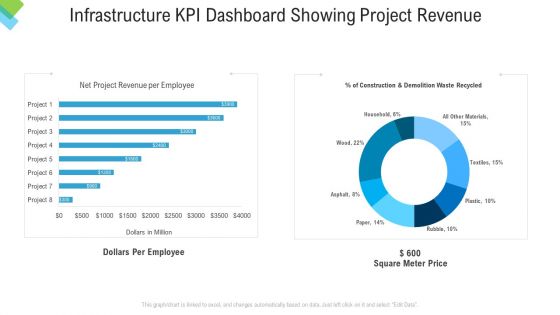
Construction Management Services Infrastructure KPI Dashboard Showing Project Revenue Ideas PDF
Deliver and pitch your topic in the best possible manner with this construction management services infrastructure kpi dashboard showing project revenue ideas pdf. Use them to share invaluable insights on infrastructure kpi dashboard showing project revenue and impress your audience. This template can be altered and modified as per your expectations. So, grab it now.
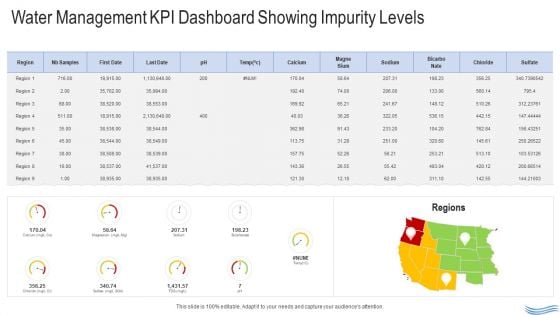
Water Quality Management Water Management KPI Dashboard Showing Impurity Levels Download PDF
Deliver an awe inspiring pitch with this creative water quality management water management kpi dashboard showing impurity levels download pdf bundle. Topics like water management kpi dashboard showing impurity levels can be discussed with this completely editable template. It is available for immediate download depending on the needs and requirements of the user.
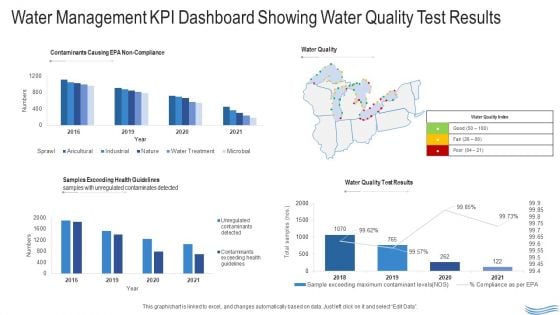
Water Quality Management Water Management KPI Dashboard Showing Water Quality Test Results Formats PDF
Deliver and pitch your topic in the best possible manner with this water quality management water management kpi dashboard showing water quality test results formats pdf. Use them to share invaluable insights on water management kpi dashboard showing water quality test results and impress your audience. This template can be altered and modified as per your expectations. So, grab it now.
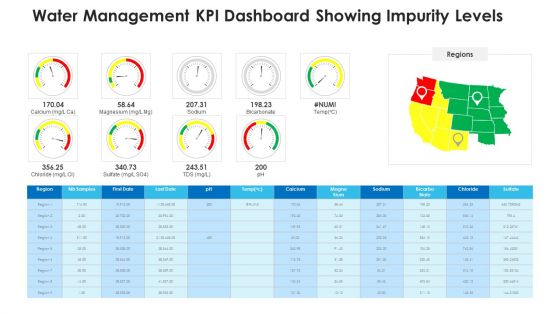
Non Rural Water Resource Administration Water Management KPI Dashboard Showing Impurity Levels Professional PDF
Deliver an awe inspiring pitch with this creative non rural water resource administration water management kpi dashboard showing impurity levels professional pdf bundle. Topics like water management kpi dashboard showing impurity levels can be discussed with this completely editable template. It is available for immediate download depending on the needs and requirements of the user.
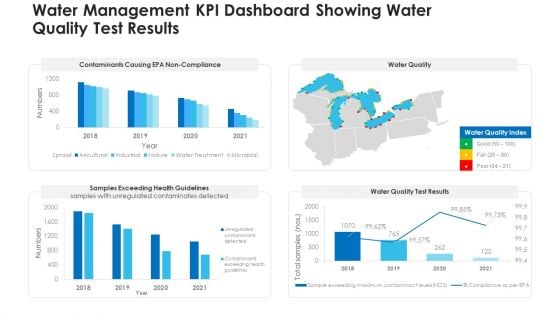
Non Rural Water Resource Administration Water Management KPI Dashboard Showing Water Quality Test Results Clipart PDF
Deliver and pitch your topic in the best possible manner with this non rural water resource administration water management kpi dashboard showing water quality test results clipart pdf. Use them to share invaluable insights on water management kpi dashboard showing water quality test results and impress your audience. This template can be altered and modified as per your expectations. So, grab it now.
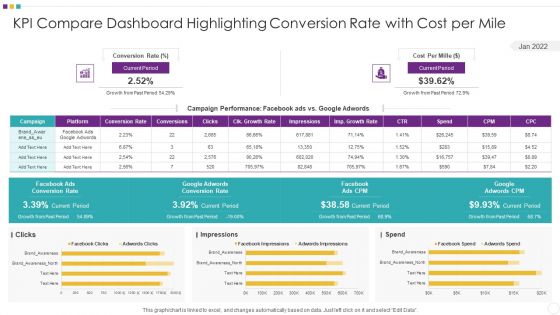
KPI Compare Dashboard Highlighting Conversion Rate With Cost Per Mile Themes PDF
Showcasing this set of slides titled KPI Compare Dashboard Highlighting Conversion Rate With Cost Per Mile Themes PDF The topics addressed in these templates are KPI Compare Dashboard Highlighting Conversion Rate With Cost Per Mile All the content presented in this PPT design is completely editable. Download it and make adjustments in color, background, font etc. as per your unique business setting.
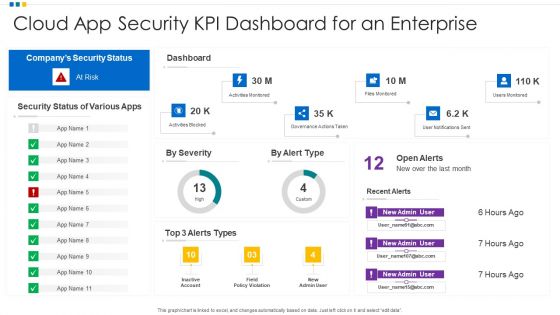
Cloud App Security KPI Dashboard For An Enterprise Ppt Model Template PDF
Showcasing this set of slides titled Cloud App Security KPI Dashboard For An Enterprise Ppt Model Template PDF. The topics addressed in these templates are Cloud App Security, KPI Dashboard, Enterprise. All the content presented in this PPT design is completely editable. Download it and make adjustments in color, background, font etc. as per your unique business setting.
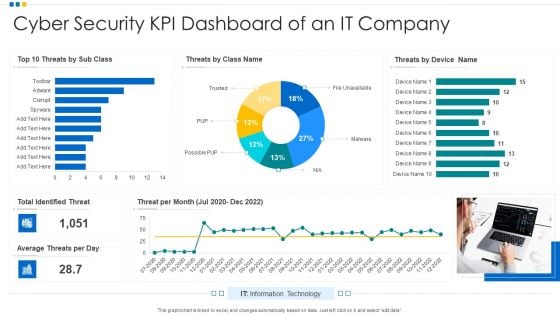
Cyber Security KPI Dashboard Of An IT Company Ppt Show Introduction PDF
Showcasing this set of slides titled Cyber Security KPI Dashboard Of An IT Company Ppt Show Introduction PDF. The topics addressed in these templates are Cyber Security, KPI Dashboard, Average Threats. All the content presented in this PPT design is completely editable. Download it and make adjustments in color, background, font etc. as per your unique business setting.
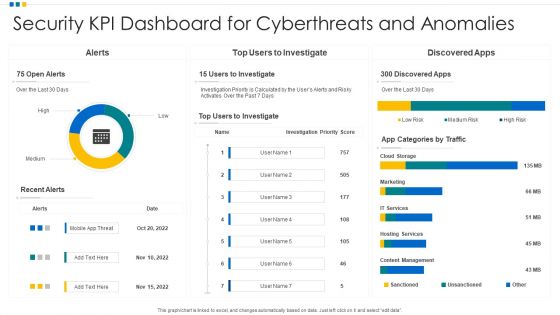
Security KPI Dashboard For Cyberthreats And Anomalies Ppt Professional Gridlines PDF
Showcasing this set of slides titled Security KPI Dashboard For Cyberthreats And Anomalies Ppt Professional Gridlines PDF. The topics addressed in these templates are Security KPI Dashboard, Cyberthreats And Anomalies. All the content presented in this PPT design is completely editable. Download it and make adjustments in color, background, font etc. as per your unique business setting.

Security KPI Dashboard Of Shadow It Services Ppt Ideas Deck PDF
Pitch your topic with ease and precision using this Security KPI Dashboard Of Shadow It Services Ppt Ideas Deck PDF. This layout presents information on Security KPI Dashboard, Shadow It Services, Risk Levels. It is also available for immediate download and adjustment. So, changes can be made in the color, design, graphics or any other component to create a unique layout.
Security KPI Dashboard To Identify The Risk Of Application Ppt Icon Show PDF
Showcasing this set of slides titled Security KPI Dashboard To Identify The Risk Of Application Ppt Icon Show PDF. The topics addressed in these templates are Risk Levels, Security KPI Dashboard, Risk Of Application. All the content presented in this PPT design is completely editable. Download it and make adjustments in color, background, font etc. as per your unique business setting.
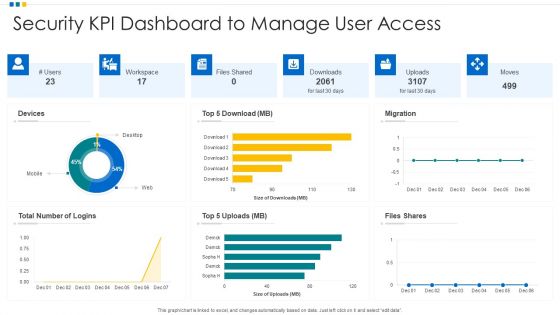
Security KPI Dashboard To Manage User Access Ppt Infographic Template Graphics Pictures PDF
Pitch your topic with ease and precision using this Security KPI Dashboard To Manage User Access Ppt Infographic Template Graphics Pictures PDF. This layout presents information on Devices, Security KPI Dashboard, Workspace. It is also available for immediate download and adjustment. So, changes can be made in the color, design, graphics or any other component to create a unique layout.
Firm KPI Dashboard Icon With Graph And 3 Dots Ppt Professional Slide PDF
Presenting Firm KPI Dashboard Icon With Graph And 3 Dots Ppt Professional Slide PDF to dispense important information. This template comprises three stages. It also presents valuable insights into the topics including Firm KPI Dashboard, Icon With Graph, 3 Dots. This is a completely customizable PowerPoint theme that can be put to use immediately. So, download it and address the topic impactfully.
Service Level Agreement KPI Dashboard Icon With Analytics And Interfaces Download PDF
Presenting Service Level Agreement KPI Dashboard Icon With Analytics And Interfaces Download PDF to dispense important information. This template comprises three stages. It also presents valuable insights into the topics including Service Level Agreement, KPI Dashboard Icon, Analytics And Interfaces. This is a completely customizable PowerPoint theme that can be put to use immediately. So, download it and address the topic impactfully.
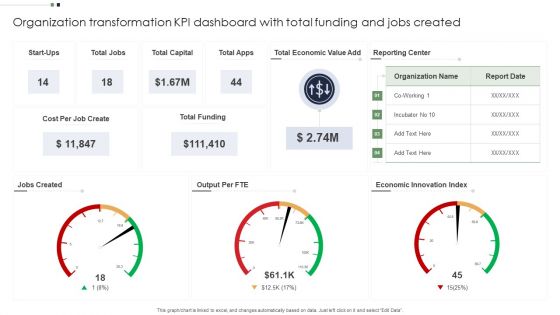
Organization Transformation KPI Dashboard With Total Funding And Jobs Created Information PDF
Pitch your topic with ease and precision using this Organization Transformation KPI Dashboard With Total Funding And Jobs Created Information PDF. This layout presents information on Organization Transformation KPI Dashboard, Economic, Capital. It is also available for immediate download and adjustment. So, changes can be made in the color, design, graphics or any other component to create a unique layout.
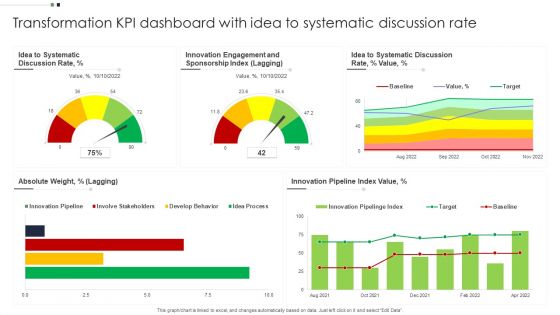
Transformation KPI Dashboard With Idea To Systematic Discussion Rate Inspiration PDF
Showcasing this set of slides titled Transformation KPI Dashboard With Idea To Systematic Discussion Rate Inspiration PDF. The topics addressed in these templates are Transformation KPI Dashboard, Systematic Discussion Rate. All the content presented in this PPT design is completely editable. Download it and make adjustments in color, background, font etc. as per your unique business setting.
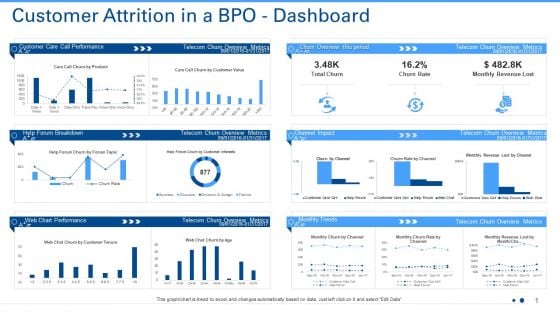
Customer Attrition In A BPO Dashboard Ppt Show File Formats PDF
Deliver an awe-inspiring pitch with this creative customer attrition in a bpo dashboard ppt show file formats pdf. bundle. Topics like customer care call performance, telecom churn overview metrics, telecom churn overview metrics can be discussed with this completely editable template. It is available for immediate download depending on the needs and requirements of the user.

Product Cost Management PCM Cost Management KPI Metrics Showing Return On Investment Ppt Visual Aids Inspiration PDF
This is a product cost management pcm cost management kpi metrics showing return on investment ppt visual aids inspiration pdf template with various stages. Focus and dispense information on four stages using this creative set, that comes with editable features. It contains large content boxes to add your information on topics like performed, cost, investment, variance, return. You can also showcase facts, figures, and other relevant content using this PPT layout. Grab it now.
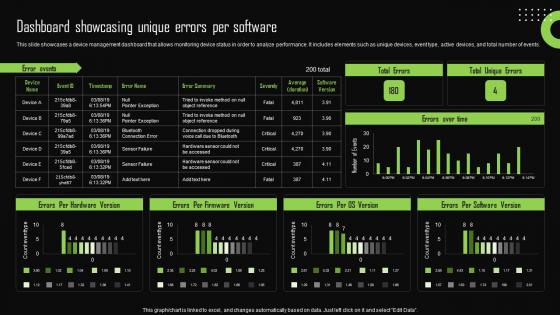
Dashboard Showcasing Unique Errors Per Software Iot Device Management Infographics Pdf
This slide showcases a device management dashboard that allows monitoring device status in order to analyze performance. It includes elements such as unique devices, event type, active devices, and total number of events. If you are looking for a format to display your unique thoughts, then the professionally designed Dashboard Showcasing Unique Errors Per Software Iot Device Management Infographics Pdf is the one for you. You can use it as a Google Slides template or a PowerPoint template. Incorporate impressive visuals, symbols, images, and other charts. Modify or reorganize the text boxes as you desire. Experiment with shade schemes and font pairings. Alter, share or cooperate with other people on your work. Download Dashboard Showcasing Unique Errors Per Software Iot Device Management Infographics Pdf and find out how to give a successful presentation. Present a perfect display to your team and make your presentation unforgettable. This slide showcases a device management dashboard that allows monitoring device status in order to analyze performance. It includes elements such as unique devices, event type, active devices, and total number of events.
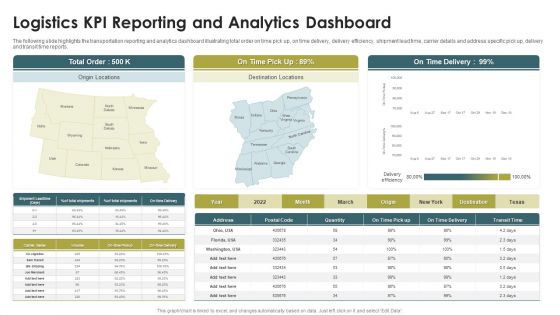
Logistics KPI Reporting And Analytics Dashboard Ppt Infographic Template Background PDF
The following slide highlights the transportation reporting and analytics dashboard illustrating total order on time pick up, on time delivery, delivery efficiency, shipment lead time, carrier details and address specific pick up, delivery and transit time reports. Presenting Logistics KPI Reporting And Analytics Dashboard Ppt Infographic Template Background PDF to dispense important information. This template comprises one stages. It also presents valuable insights into the topics including On Time Delivery, Total Order, Origin Locations. This is a completely customizable PowerPoint theme that can be put to use immediately. So, download it and address the topic impactfully.

KPI Dashboard Highlighting Automation Results In Supply Achieving Operational Efficiency Graphics PDF
The following slide outlines a comprehensive dashboard depicting the business process automation BPA results in the supply chain. Information covered in the slide is related to average order processing days, average shipping days, etc.Deliver and pitch your topic in the best possible manner with this KPI Dashboard Highlighting Automation Results In Supply Achieving Operational Efficiency Graphics PDF. Use them to share invaluable insights on Orders Progress, Late Deliveries, Deliveries Warehouse and impress your audience. This template can be altered and modified as per your expectations. So, grab it now.
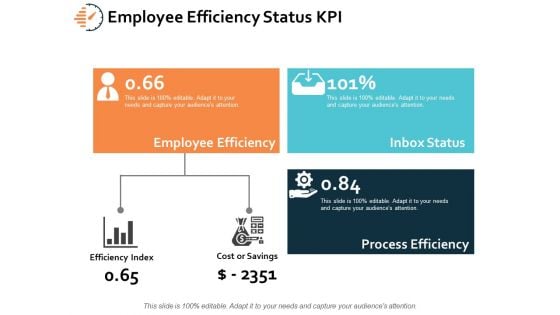
Employee Efficiency Status KPI Ppt PowerPoint Presentation Infographics Images
This is a employee efficiency status kpi ppt powerpoint presentation infographics images. This is a three stage process. The stages in this process are employee efficiency, process efficiency, efficiency index, planning, marketing.
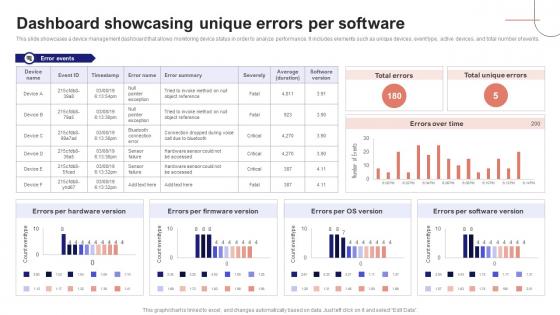
IoT Device Management Fundamentals Dashboard Showcasing Unique Errors Per Software IoT Ss V
This slide showcases a device management dashboard that allows monitoring device status in order to analyze performance. It includes elements such as unique devices, event type, active devices, and total number of events. Are you in need of a template that can accommodate all of your creative concepts This one is crafted professionally and can be altered to fit any style. Use it with Google Slides or PowerPoint. Include striking photographs, symbols, depictions, and other visuals. Fill, move around, or remove text boxes as desired. Test out color palettes and font mixtures. Edit and save your work, or work with colleagues. Download IoT Device Management Fundamentals Dashboard Showcasing Unique Errors Per Software IoT SS V and observe how to make your presentation outstanding. Give an impeccable presentation to your group and make your presentation unforgettable. This slide showcases a device management dashboard that allows monitoring device status in order to analyze performance. It includes elements such as unique devices, event type, active devices, and total number of events.
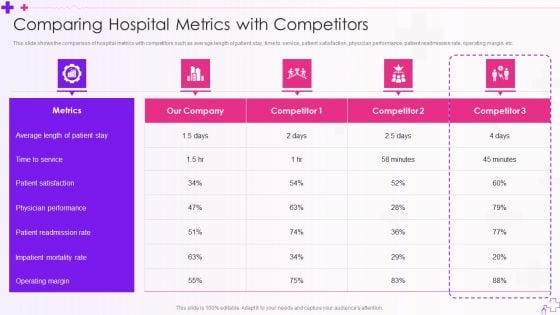
Integration Of Healthcare Center Administration System Comparing Hospital Metrics With Competitors Sample PDF
This slide shows the comparison of hospital metrics with competitors such as average length of patient stay, time to service, patient satisfaction, physician performance, patient readmission rate, operating margin, etc.Deliver and pitch your topic in the best possible manner with this Integration Of Healthcare Center Administration System Comparing Hospital Metrics With Competitors Sample PDF Use them to share invaluable insights on Physician Performance, Patient Readmission, Impatient Mortality and impress your audience. This template can be altered and modified as per your expectations. So, grab it now.
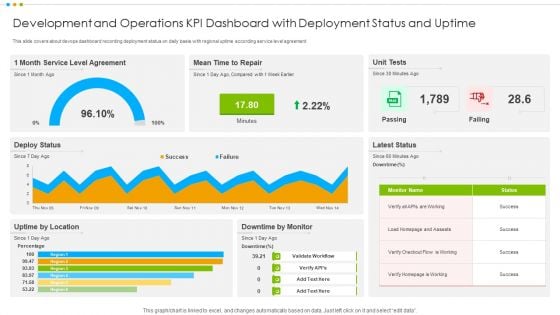
Development And Operations KPI Dashboard With Deployment Status And Uptime Structure PDF
This slide covers about devops dashboard recording deployment status on daily basis with regional uptime according service level agreement.Showcasing this set of slides titled Development And Operations KPI Dashboard With Deployment Status And Uptime Structure PDF The topics addressed in these templates are Development Operations, Kpi Dashboard, Deployment Uptime All the content presented in this PPT design is completely editable. Download it and make adjustments in color, background, font etc. as per your unique business setting.
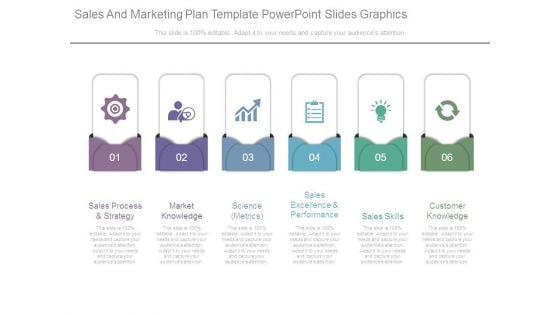
Sales And Marketing Plan Template Powerpoint Slides Graphics
This is a sales and marketing plan template powerpoint slides graphics. This is a six stage process. The stages in this process are sales process and strategy, market knowledge, science metrics, sales excellence and performance, sales skills, customer knowledge.
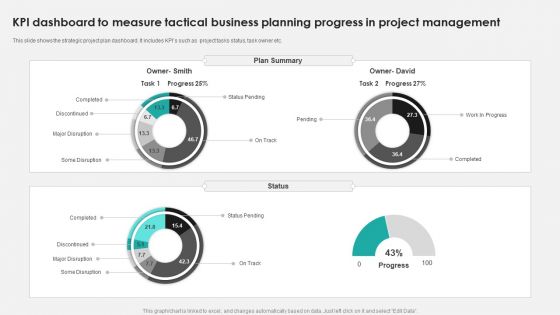
KPI Dashboard To Measure Tactical Business Planning Progress In Project Management Ppt PowerPoint Presentation File Example File PDF
This slide shows the strategic project plan dashboard. It includes KPIs such as project tasks status, task owner etc. Showcasing this set of slides titled KPI Dashboard To Measure Tactical Business Planning Progress In Project Management Ppt PowerPoint Presentation File Example File PDF. The topics addressed in these templates are Discontinued, Some Disruption, Completed. All the content presented in this PPT design is completely editable. Download it and make adjustments in color, background, font etc. as per your unique business setting.
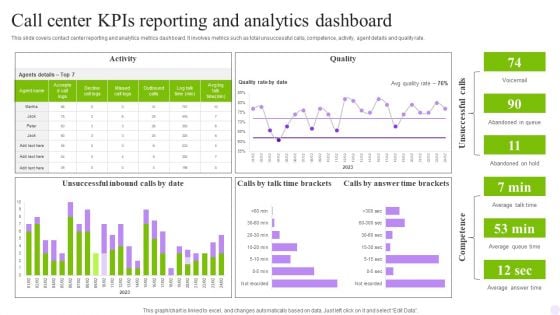
Call Center Kpis Reporting And Analytics Dashboard Download PDF
This slide covers contact center reporting and analytics metrics dashboard. It involves metrics such as total unsuccessful calls, competence, activity, agent details and quality rate. Pitch your topic with ease and precision using this Call Center Kpis Reporting And Analytics Dashboard Download PDF. This layout presents information on Activity, Quality, Dashboard. It is also available for immediate download and adjustment. So, changes can be made in the color, design, graphics or any other component to create a unique layout.
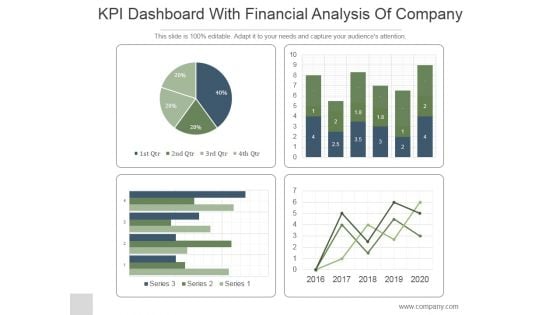
KPI Dashboard With Financial Analysis Of Company Ppt PowerPoint Presentation Backgrounds
This is a kpi dashboard with financial analysis of company ppt powerpoint presentation backgrounds. This is a four stage process. The stages in this process are business, strategy, marketing, line graph, finance.

Supply Chain Kpi Dashboard Ppt PowerPoint Presentation Complete Deck With Slides
This is a supply chain kpi dashboard ppt powerpoint presentation complete deck with slides. This is a one stage process. The stages in this process are business, strategy, marketing, analysis, business model.
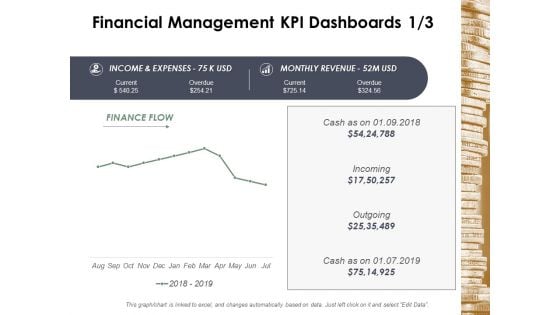
Financial Management Kpi Dashboards Business Ppt Powerpoint Presentation Infographic Template Deck
This is a financial management kpi dashboards business ppt powerpoint presentation infographic template deck. This is a four stage process. The stages in this process are finance, marketing, management, investment, analysis.
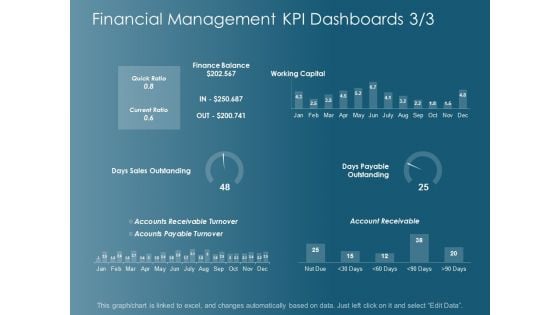
Financial Management Kpi Dashboards Strategy Ppt Powerpoint Presentation Gallery Graphics Template
This is a financial management kpi dashboards strategy ppt powerpoint presentation gallery graphics template. This is a six stage process. The stages in this process are finance, marketing, management, investment, analysis.
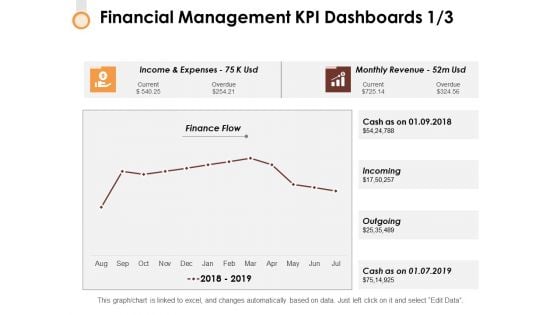
Financial Management Kpi Dashboards 1 3 Ppt PowerPoint Presentation Outline Background
This is a financial management kpi dashboards 1 3 ppt powerpoint presentation outline background. This is a four stage process. The stages in this process are finance, strategy, marketing, compare, business.
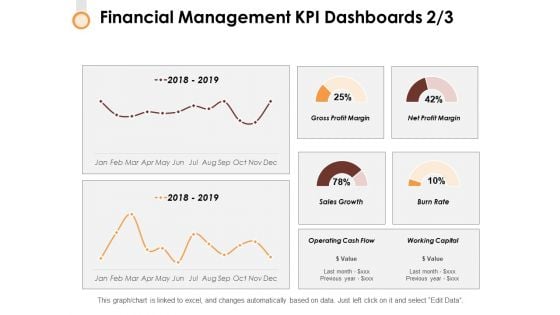
Financial Management Kpi Dashboards 2 3 Ppt PowerPoint Presentation Infographic Template Format Ideas
This is a financial management kpi dashboards 2 3 ppt powerpoint presentation infographic template format ideas. This is a two stage process. The stages in this process are finance, strategy, marketing, compare, business.
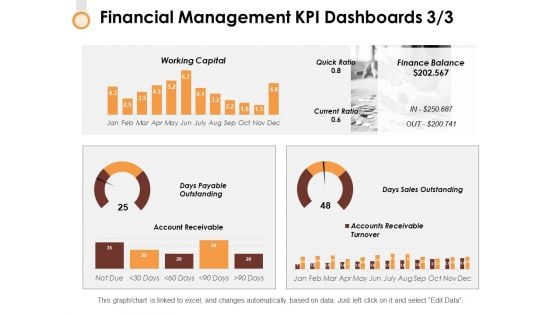
Financial Management Kpi Dashboards 3 3 Ppt PowerPoint Presentation Layouts Graphics Template
This is a financial management kpi dashboards 3 3 ppt powerpoint presentation layouts graphics template. This is a two stage process. The stages in this process are finance, strategy, marketing, compare, business.

Retail KPI Dashboard Showing Revenue Vs Units Sold Ppt PowerPoint Presentation Professional Smartart
This is a retail kpi dashboard showing revenue vs units sold ppt powerpoint presentation professional smartart. This is a four stage process. The stages in this process are finance, analysis, business, investment, marketing.
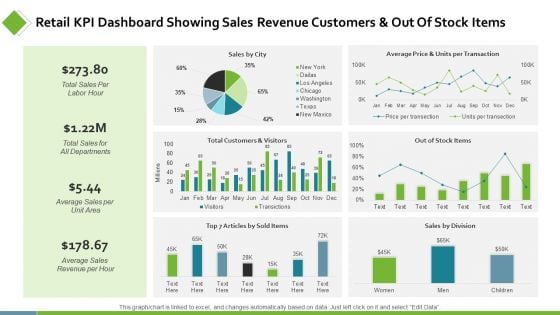
Retail KPI Dashboard Showing Sales Revenue Customers Ppt PowerPoint Presentation Show Background Designs
This is a retail kpi dashboard showing sales revenue customers ppt powerpoint presentation show background designs. This is a six stage process. The stages in this process are finance, analysis, business, investment, marketing.
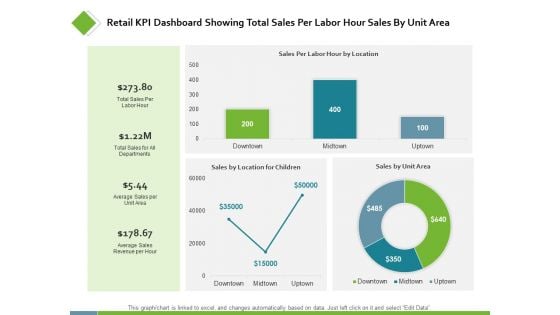
Retail KPI Dashboard Showing Total Sales Per Labor Ppt PowerPoint Presentation Styles Examples
This is a retail kpi dashboard showing total sales per labor ppt powerpoint presentation styles examples. This is a three stage process. The stages in this process are finance, analysis, business, investment, marketing.
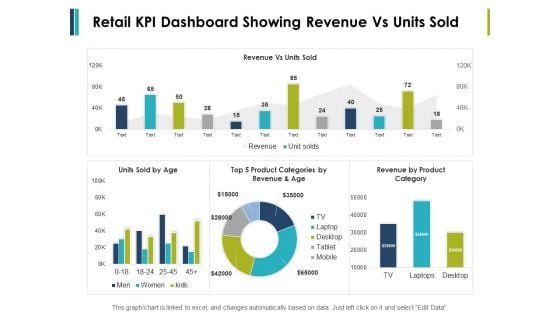
Retail Kpi Dashboard Showing Revenue Vs Units Sold Ppt PowerPoint Presentation File Formats
This is a retail kpi dashboard showing revenue vs units sold ppt powerpoint presentation file formats. This is a three stage process. The stages in this process are finance, marketing, management, investment, analysis.
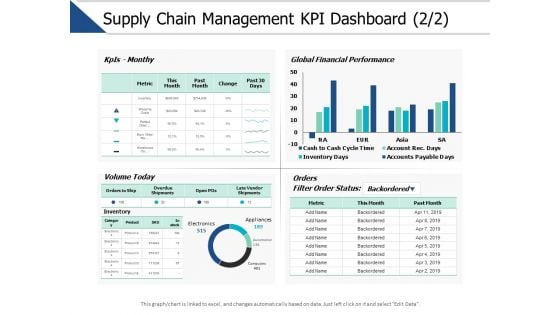
Supply Chain Management Kpi Dashboard Marketing Ppt PowerPoint Presentation File Tips
This is a supply chain management kpi dashboard marketing ppt powerpoint presentation file tips. This is a three stage process. The stages in this process are finance, marketing, management, investment, analysis.
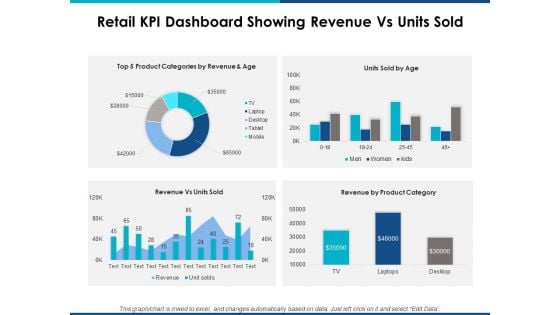
Retail Kpi Dashboard Showing Revenue Vs Units Sold Ppt Powerpoint Presentation Layouts Show
This is a retail kpi dashboard showing revenue vs units sold ppt powerpoint presentation layouts show. This is a four stage process. The stages in this process are finance, marketing, management, investment, analysis.
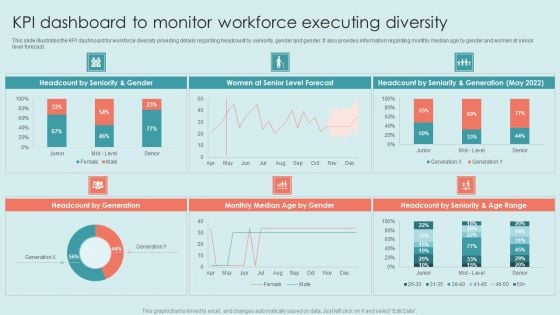
Executing Diversity KPI Dashboard To Monitor Workforce Executing Diversity Structure PDF
This slide illustrates the KPI dashboard for workforce diversity providing details regarding headcount by seniority, gender and gender. It also provides information regarding monthly median age by gender and women at senior level forecast. Presenting this PowerPoint presentation, titled Executing Diversity KPI Dashboard To Monitor Workforce Executing Diversity Structure PDF, with topics curated by our researchers after extensive research. This editable presentation is available for immediate download and provides attractive features when used. Download now and captivate your audience. Presenting this Executing Diversity KPI Dashboard To Monitor Workforce Executing Diversity Structure PDF. Our researchers have carefully researched and created these slides with all aspects taken into consideration. This is a completely customizable Executing Diversity KPI Dashboard To Monitor Workforce Executing Diversity Structure PDF that is available for immediate downloading. Download now and make an impact on your audience. Highlight the attractive features available with our PPTs.
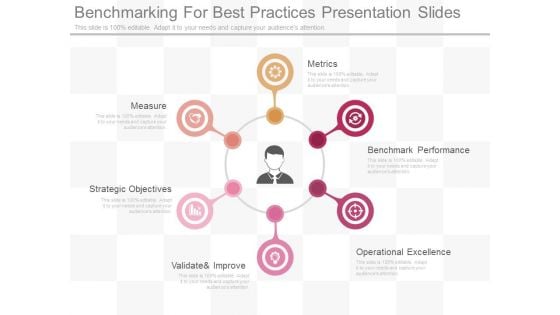
Benchmarking For Best Practices Presentation Slides
This is a benchmarking for best practices presentation slides. This is a six stage process. The stages in this process are metrics, benchmark performance, operational excellence, validate and improve, strategic objectives, measure.

Seo Marketing Strategy Powerpoint Slide Clipart
This is a seo marketing strategy powerpoint slide clipart. This is a five stage process. The stages in this process are seo marketing strategy, competitive analysis, marketing metrics, evaluate and refine performance, develop quality content.
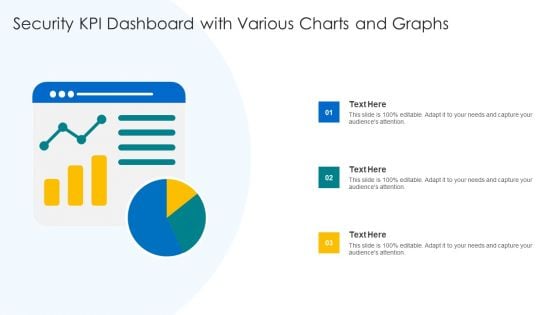
Security KPI Dashboard With Various Charts And Graphs Ppt Summary Background Image PDF
Persuade your audience using this Security KPI Dashboard With Various Charts And Graphs Ppt Summary Background Image PDF. This PPT design covers three stages, thus making it a great tool to use. It also caters to a variety of topics including Various Charts, Security KPI Dashboard, Graphs. Download this PPT design now to present a convincing pitch that not only emphasizes the topic but also showcases your presentation skills.
Service Level Agreement KPI Dashboard With Graph And Analytics Icon Inspiration PDF
Persuade your audience using this Service Level Agreement KPI Dashboard With Graph And Analytics Icon Inspiration PDF. This PPT design covers three stages, thus making it a great tool to use. It also caters to a variety of topics including Service Level, Agreement KPI Dashboard, Graph And Analytics, Icon. Download this PPT design now to present a convincing pitch that not only emphasizes the topic but also showcases your presentation skills.
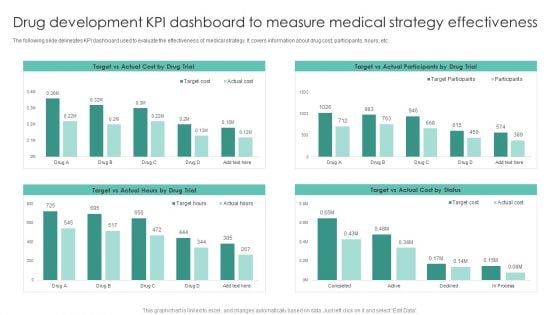
Drug Development KPI Dashboard To Measure Medical Strategy Effectiveness Demonstration PDF
The following slide delineates KPI dashboard used to evaluate the effectiveness of medical strategy. It covers information about drug cost, participants, hours, etc.Showcasing this set of slides titled Drug Development KPI Dashboard To Measure Medical Strategy Effectiveness Demonstration PDF. The topics addressed in these templates are Target Actual, Actual Hours Actual Participants. All the content presented in this PPT design is completely editable. Download it and make adjustments in color, background, font etc. as per your unique business setting.
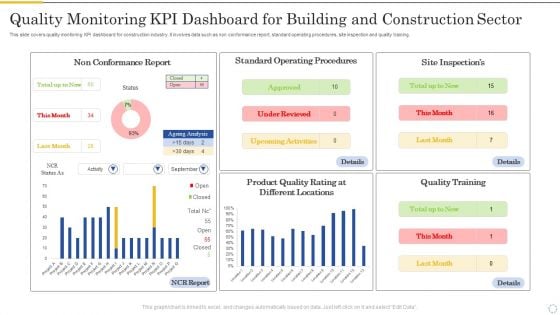
Quality Monitoring Kpi Dashboard For Building And Construction Sector Portrait PDF
This slide covers quality monitoring KPI dashboard for construction industry. It involves data such as non conformance report, standard operating procedures, site inspection and quality training. Showcasing this set of slides titled Quality Monitoring Kpi Dashboard For Building And Construction Sector Portrait PDF. The topics addressed in these templates are Non Conformance Report, Standard Operating, Procedures. All the content presented in this PPT design is completely editable. Download it and make adjustments in color, background, font etc. as per your unique business setting.
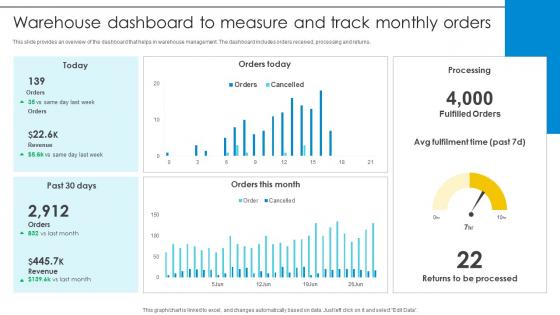
Warehouse Dashboard To Measure And Track Monthly Orders Optimizing Inventory Management IoT SS V
This slide provides an overview of the dashboard that helps in warehouse management. The dashboard includes orders received, processing and returns. Want to ace your presentation in front of a live audience Our Warehouse Dashboard To Measure And Track Monthly Orders Optimizing Inventory Management IoT SS V can help you do that by engaging all the users towards you. Slidegeeks experts have put their efforts and expertise into creating these impeccable powerpoint presentations so that you can communicate your ideas clearly. Moreover, all the templates are customizable, and easy-to-edit and downloadable. Use these for both personal and commercial use. This slide provides an overview of the dashboard that helps in warehouse management. The dashboard includes orders received, processing and returns.
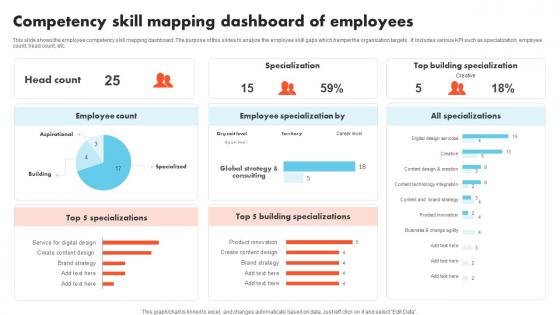
Competency Skill Mapping Dashboard Of Employees Formats Pdf
This slide shows the employee competency skill mapping dashboard .The purpose of this slides to analyze the employee skill gaps which hamper the organization targets .It includes various KPI such as specialization, employee count, head count, etc. Pitch your topic with ease and precision using this Competency Skill Mapping Dashboard Of Employees Formats Pdf This layout presents information on Employee Specialization, Building Specializations, Specialization It is also available for immediate download and adjustment. So, changes can be made in the color, design, graphics or any other component to create a unique layout. This slide shows the employee competency skill mapping dashboard .The purpose of this slides to analyze the employee skill gaps which hamper the organization targets .It includes various KPI such as specialization, employee count, head count, etc.
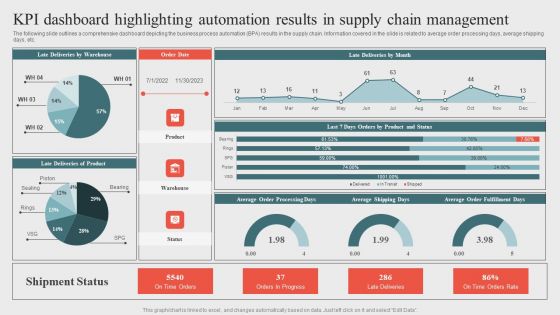
Kpi Dashboard Highlighting Automation Results In Supplyoptimizing Business Processes Through Automation Download PDF
The following slide outlines a comprehensive dashboard depicting the business process automation BPA results in the supply chain. Information covered in the slide is related to average order processing days, average shipping days, etc. There are so many reasons you need a Kpi Dashboard Highlighting Automation Results In Supplyoptimizing Business Processes Through Automation Download PDF. The first reason is you cannot spend time making everything from scratch, Thus, Slidegeeks has made presentation templates for you too. You can easily download these templates from our website easily.

Marketing Success Metrics Introduction To Website Landing Page Analytics Information PDF
This slide covers an overview of web landing page analysis. It also includes steps for analysing landing page performance, such as creating a tempting offer or launching a new website page, creating a campaign, analyzing data, and making changes to enhance performance. Find a pre-designed and impeccable Marketing Success Metrics Introduction To Website Landing Page Analytics Information PDF. The templates can ace your presentation without additional effort. You can download these easy-to-edit presentation templates to make your presentation stand out from others. So, what are you waiting for Download the template from Slidegeeks today and give a unique touch to your presentation.
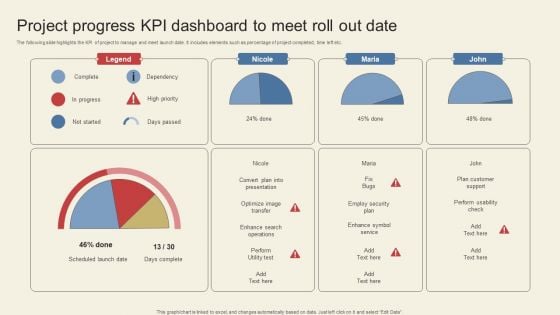
Project Progress Kpi Dashboard To Meet Roll Out Date Themes PDF
The following slide highlights the KPI of project to manage and meet launch date. It includes elements such as percentage of project completed, time left etc. Showcasing this set of slides titled Project Progress Kpi Dashboard To Meet Roll Out Date Themes PDF. The topics addressed in these templates are Legend, Nicole, Maria. All the content presented in this PPT design is completely editable. Download it and make adjustments in color, background, font etc. as per your unique business setting.
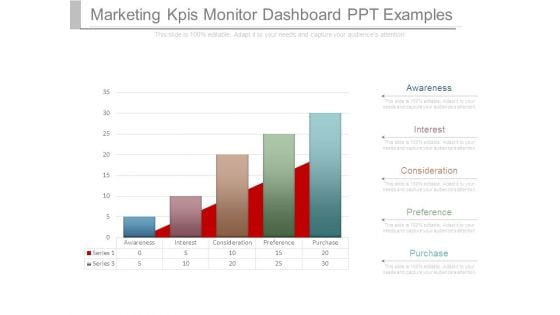
Marketing Kpis Monitor Dashboard Ppt Examples
This is a marketing kpis monitor dashboard ppt examples. This is a five stage process. The stages in this process are awareness, interest, consideration, preference, purchase.
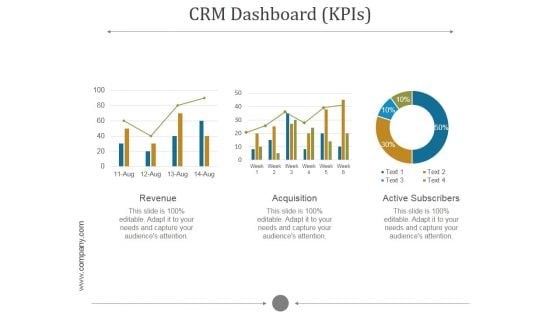
Crm Dashboard Kpis Ppt PowerPoint Presentation Pictures
This is a crm dashboard kpis ppt powerpoint presentation pictures. This is a five stage process. The stages in this process are revenue, acquisition, active subscribers.
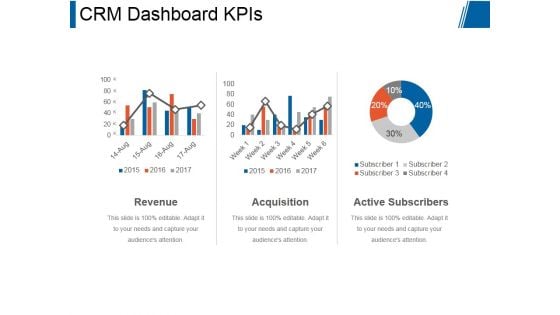
Crm Dashboard Kpis Ppt PowerPoint Presentation Rules
This is a crm dashboard kpis ppt powerpoint presentation rules. This is a three stage process. The stages in this process are revenue, acquisition, active subscribers.
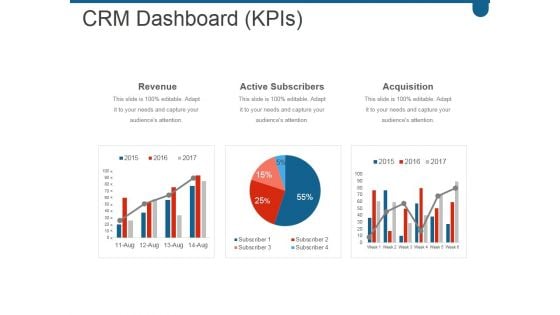
Crm Dashboard Kpis Ppt PowerPoint Presentation Layouts
This is a crm dashboard kpis ppt powerpoint presentation layouts. This is a three stage process. The stages in this process are revenue, active subscribers, acquisition.
Dashboard For Tracking Aftersales Increasing Client Retention Through Efficient Rules Pdf
This slide covers the KPI dashboard for ticket tracking. It includes metrics such as tickets by month, service level, and details of customer service department agents. Whether you have daily or monthly meetings, a brilliant presentation is necessary. Dashboard For Tracking Aftersales Increasing Client Retention Through Efficient Rules Pdf can be your best option for delivering a presentation. Represent everything in detail using Dashboard For Tracking Aftersales Increasing Client Retention Through Efficient Rules Pdf and make yourself stand out in meetings. The template is versatile and follows a structure that will cater to your requirements. All the templates prepared by Slidegeeks are easy to download and edit. Our research experts have taken care of the corporate themes as well. So, give it a try and see the results. This slide covers the KPI dashboard for ticket tracking. It includes metrics such as tickets by month, service level, and details of customer service department agents.
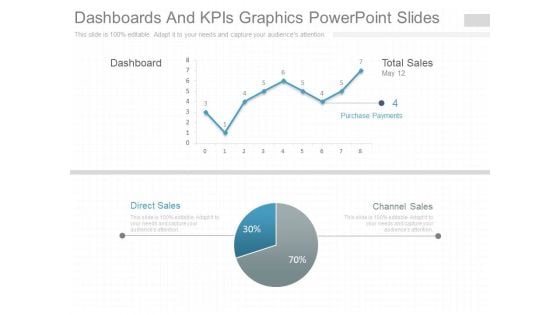
Dashboards And Kpis Graphics Powerpoint Slides
This is a dashboards and kpis graphics powerpoint slides. This is a two stage process. The stages in this process are dashboard, total sales, channel sales, direct sales, purchase payments.
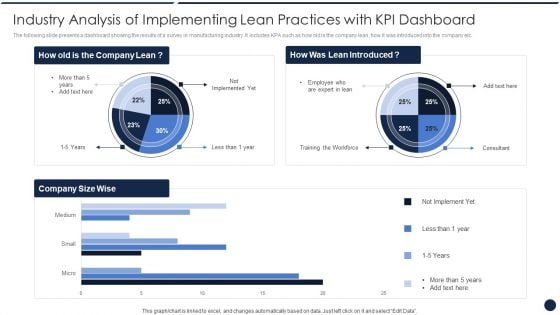
Industry Analysis Of Implementing Lean Practices With KPI Dashboard Sample PDF
The following slide presents a dashboard showing the results of a survey in manufacturing industry. It includes KPA such as how old is the company lean, how it was introduced into the company etc. Showcasing this set of slides titled Industry Analysis Of Implementing Lean Practices With KPI Dashboard Sample PDF The topics addressed in these templates are Industry Analysis, Implementing Lean, Practices With KPI Dashboard All the content presented in this PPT design is completely editable. Download it and make adjustments in color, background, font etc. as per your unique business setting.


 Continue with Email

 Home
Home


