key performance indicators
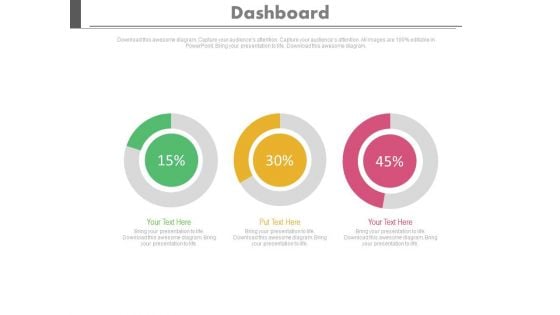
Three Dashboard With Percentage Value Growth Powerpoint Slides
This PowerPoint template has been designed with three dashboards. Use this PPT slide to depict rise in business profit. This professional diagram slide will help you express your views to target audience.
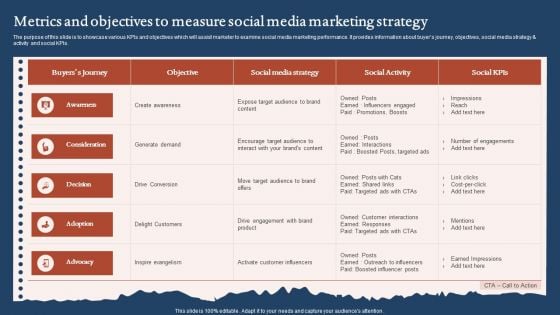
Metrics And Objectives To Measure Social Media Marketing Strategy Structure PDF
The purpose of this slide is to showcase various KPIs and objectives which will assist marketer to examine social media marketing performance. It provides information about buyers journey, objectives, social media strategy and activity and social KPIs. Pitch your topic with ease and precision using this Metrics And Objectives To Measure Social Media Marketing Strategy Structure PDF. This layout presents information on Awareness, Consideration, Advocacy. It is also available for immediate download and adjustment. So, changes can be made in the color, design, graphics or any other component to create a unique layout.
Inventory Metrics Carrying Cost Order Inventory Delivered Unit Costs Ppt PowerPoint Presentation Icon Example
Presenting this set of slides with name inventory metrics carrying cost order inventory delivered unit costs ppt powerpoint presentation icon example. The topics discussed in these slides are availability kpi, availability dashboard, availability metrics. This is a completely editable PowerPoint presentation and is available for immediate download. Download now and impress your audience.
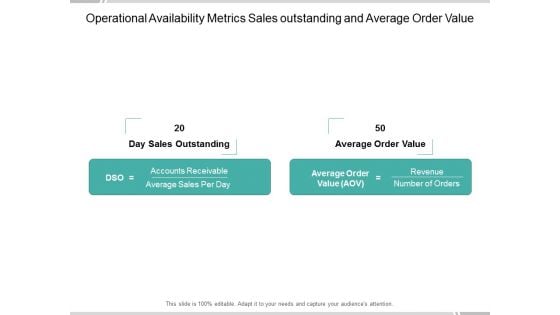
Operational Availability Metrics Sales Outstanding And Average Order Value Ppt PowerPoint Presentation Ideas Tips
Presenting this set of slides with name operational availability metrics sales outstanding and average order value ppt powerpoint presentation ideas tips. The topics discussed in these slides are availability kpi, availability dashboard, availability metrics. This is a completely editable PowerPoint presentation and is available for immediate download. Download now and impress your audience.
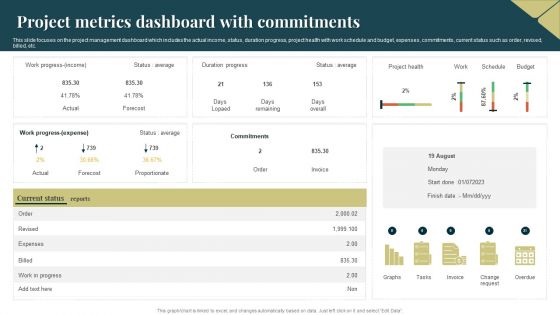
Project Metrics Dashboard With Commitments Mockup PDF
This slide focuses on the project management dashboard which includes the actual income, status, duration progress, project health with work schedule and budget, expenses, commitments, current status such as order, revised, billed, etc. Showcasing this set of slides titled Project Metrics Dashboard With Commitments Mockup PDF. The topics addressed in these templates are Expenses, Budget, Average. All the content presented in this PPT design is completely editable. Download it and make adjustments in color, background, font etc. as per your unique business setting.
Dashboard For Tracking Impact Of Warehouse House Automation Background PDF
This slide covers the dashboard with after automation warehouse overview. It include KPIs such as autonomous robots status, robotic arms status, battery level, performance, time to return, etc. This Dashboard For Tracking Impact Of Warehouse House Automation Background PDF from Slidegeeks makes it easy to present information on your topic with precision. It provides customization options, so you can make changes to the colors, design, graphics, or any other component to create a unique layout. It is also available for immediate download, so you can begin using it right away. Slidegeeks has done good research to ensure that you have everything you need to make your presentation stand out. Make a name out there for a brilliant performance.
Good Better Best Rating Meter With Icons Ppt Powerpoint Presentation Outline Vector
This is a good better best rating meter with icons ppt powerpoint presentation outline vector. This is a three stage process. The stages in this process are good better best, good great superb, good great excellent.
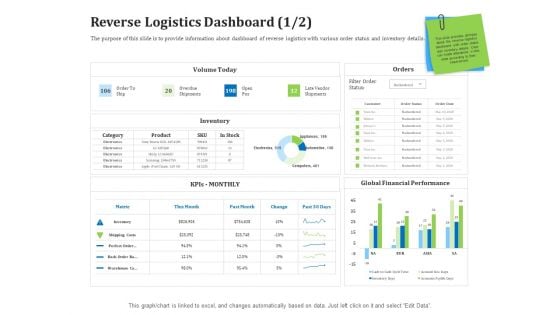
Reverse Logistics Management Reverse Logistics Dashboard Days Ppt Infographics Files PDF
The purpose of this slide is to provide information about dashboard of reverse logistics with various order status and inventory details. Deliver an awe inspiring pitch with this creative reverse logistics management reverse logistics dashboard days ppt infographics files pdf bundle. Topics like global, financial, performance, metric, inventory can be discussed with this completely editable template. It is available for immediate download depending on the needs and requirements of the user.

Search Engine Optimization Tool Google Analytics Training Deck On SEO Training Ppt
Presenting training deck on Search Engine Optimization Tool Google Analytics. This deck comprises of 74 slides. The topics covered are working of google analytics to monitor organic traffic, page speed, bounce rate, tracking search queries, top-performing landing pages, industry analysis, and annotations for content updates. Further, it includes energizer activities and a proposal for client training services. This PPT presentation is thoroughly researched by the experts, and every slide consists of appropriate content. Each slide is well crafted and designed by our PowerPoint experts. All slides are customizable.
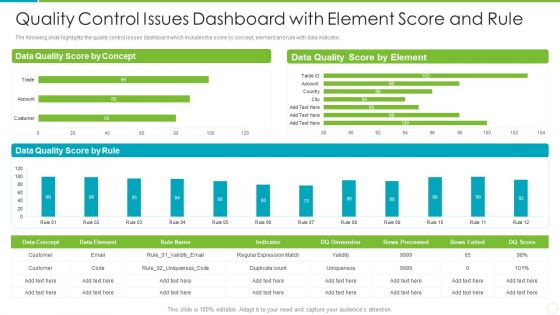
Quality Control Issues Dashboard With Element Score And Rule Summary PDF
The following slide highlights the quality control issues dashboard which includes the score by concept, element and rule with data indicator. Showcasing this set of slides titled quality control issues dashboard with element score and rule summary pdf. The topics addressed in these templates are quality control issues dashboard with element score and rule. All the content presented in this PPT design is completely editable. Download it and make adjustments in color, background, font etc. as per your unique business setting.

Table Of Contents For Developer Operations Automated Tools And Initiatives IT Infographics PDF
Presenting table of contents for developer operations automated tools and initiatives it infographics pdf to provide visual cues and insights. Share and navigate important information on seven stages that need your due attention. This template can be used to pitch topics like employee training schedule and cost, previous projects, market analysis, business performance, kpi dashboard. In addtion, this PPT design contains high resolution images, graphics, etc, that are easily editable and available for immediate download.
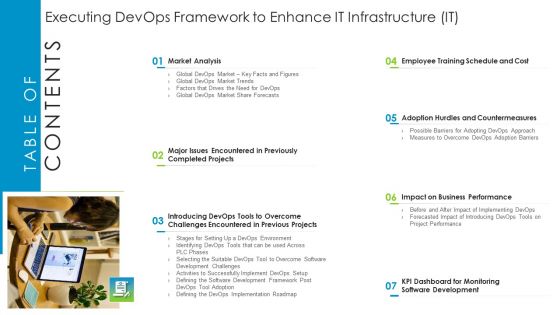
Table Of Contents Executing Devops Framework To Enhance IT Infrastructure IT Demonstration PDF
This is a Table Of Contents Executing Devops Framework To Enhance IT Infrastructure IT Demonstration PDF template with various stages. Focus and dispense information on seven stages using this creative set, that comes with editable features. It contains large content boxes to add your information on topics like Market Analysis, KPI Dashboard, Monitoring Software Development, Impact on Business Performance. You can also showcase facts, figures, and other relevant content using this PPT layout. Grab it now.

Sales Analytics Leaderboard Dashboard Ppt PowerPoint Presentation Infographic Template Templates PDF
Presenting this set of slides with name sales analytics leaderboard dashboard ppt powerpoint presentation infographic template templates pdf. The topics discussed in these slides are top performers, deal size, sales analytics, leaderboard dashboard. This is a completely editable PowerPoint presentation and is available for immediate download. Download now and impress your audience.
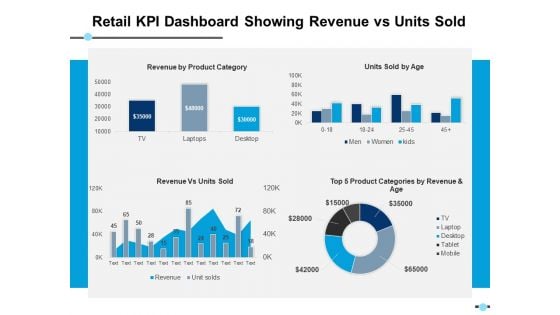
Retail Kpi Dashboard Showing Revenue Vs Units Sold Top 5 Product Categories Ppt PowerPoint Presentation Layouts Designs Download
This is a retail kpi dashboard showing revenue vs units sold top 5 product categories ppt powerpoint presentation layouts designs download. This is a four stage process. The stages in this process are finance, strategy, analysis, marketing.
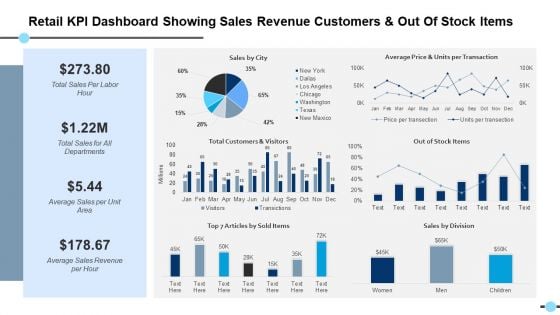
Retail Kpi Dashboard Showing Sales Revenue Customers And Out Of Stock Items Out Of Stock Items Ppt PowerPoint Presentation Files
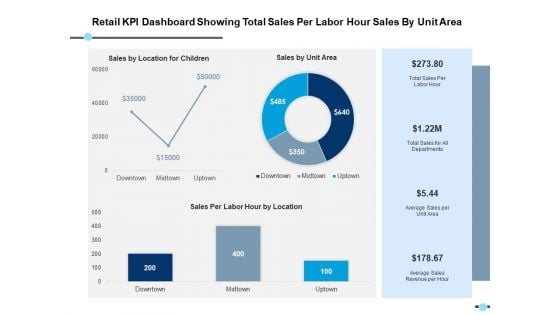
Retail Kpi Dashboard Showing Total Sales Per Labor Hour Sales By Unit Area Ppt PowerPoint Presentation Model Format
This is a retail kpi dashboard showing total sales per labor hour sales by unit area ppt powerpoint presentation model format. This is a three stage process. The stages in this process are finance, strategy, analysis, marketing.
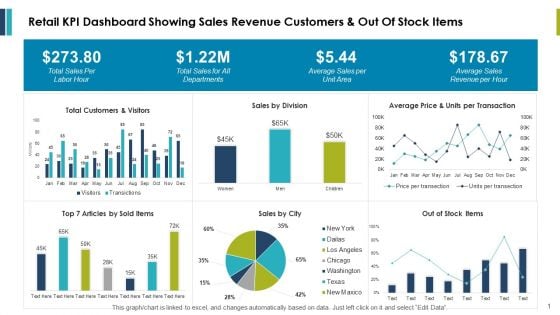
Retail Kpi Dashboard Showing Sales Revenue Customers And Out Of Stock Items Ppt PowerPoint Presentation Outline Example
This is a retail kpi dashboard showing sales revenue customers and out of stock items ppt powerpoint presentation outline example. This is a three stage process. The stages in this process are finance, marketing, management, investment, analysis.
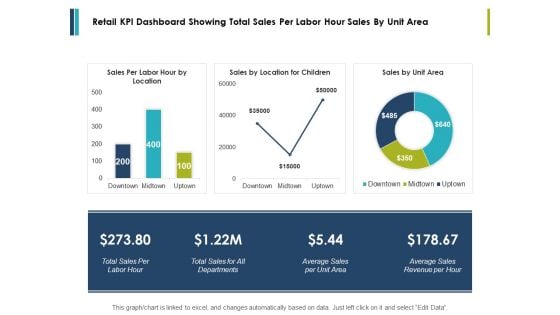
Retail Kpi Dashboard Showing Total Sales Per Labor Hour Sales By Unit Area Ppt PowerPoint Presentation Styles Influencers
This is a retail kpi dashboard showing total sales per labor hour sales by unit area ppt powerpoint presentation styles influencers. This is a three stage process. The stages in this process are finance, marketing, management, investment, analysis.
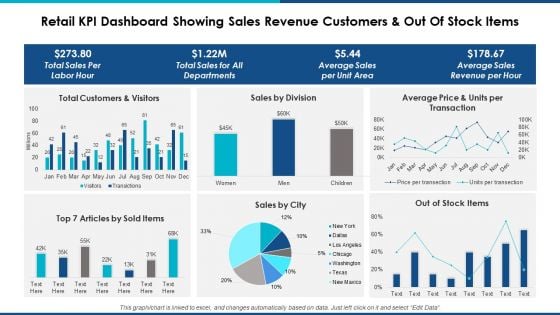
Retail Kpi Dashboard Showing Sales Revenue Customers And Out Of Stock Items Ppt Powerpoint Presentation Professional Background Designs
This is a retail kpi dashboard showing sales revenue customers and out of stock items ppt powerpoint presentation professional background designs. This is a six stage process. The stages in this process are finance, marketing, management, investment, analysis.
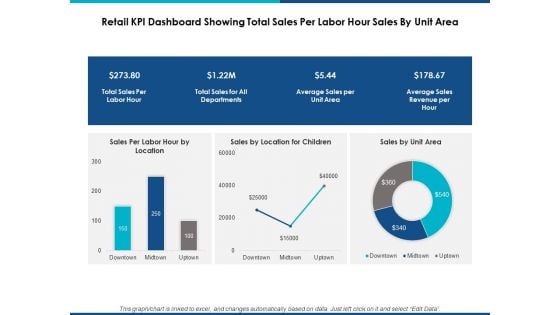
Retail Kpi Dashboard Showing Total Sales Per Labor Hour Sales By Unit Area Ppt Powerpoint Presentation Show Graphic Tips
This is a retail kpi dashboard showing total sales per labor hour sales by unit area ppt powerpoint presentation show graphic tips. This is a three stage process. The stages in this process are finance, marketing, management, investment, analysis.
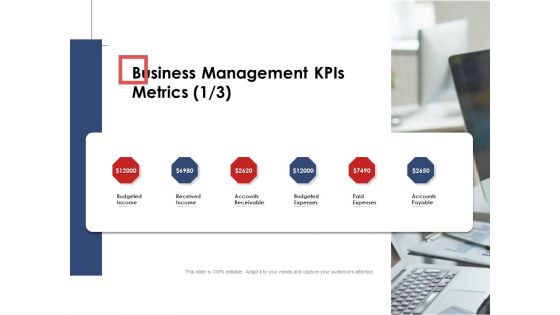
Business Assessment Outline Business Management KPIS Metrics Ppt Pictures Example Topics PDF
This is a business assessment outline business management kpis metrics ppt pictures example topics pdf template with various stages. Focus and dispense information on one stages using this creative set, that comes with editable features. It contains large content boxes to add your information on topics like budgeted income, received income, accounts receivable, budgeted expenses, paid expenses, accounts payable. You can also showcase facts, figures, and other relevant content using this PPT layout. Grab it now.
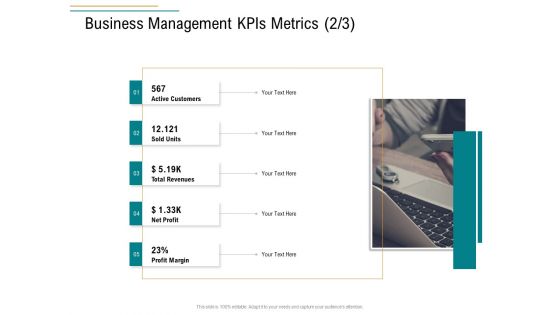
Business Operations Assessment Business Management Kpis Metrics Customers Ppt Infographics Elements PDF
This is a business operations assessment business management kpis metrics customers ppt infographics elements pdf template with various stages. Focus and dispense information on five stages using this creative set, that comes with editable features. It contains large content boxes to add your information on topics like active customers, sold units, total revenues, net profit, profit margin. You can also showcase facts, figures, and other relevant content using this PPT layout. Grab it now.
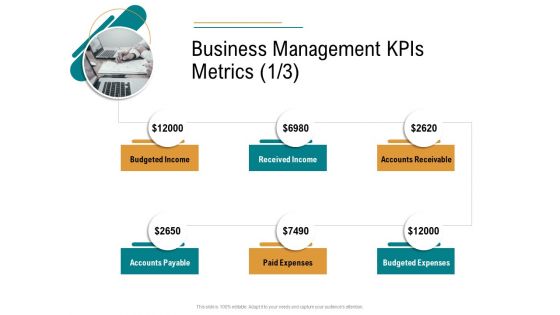
Business Operations Assessment Business Management Kpis Metrics Ppt Infographic Template Deck PDF
This is a business operations assessment business management kpis metrics ppt infographic template deck pdf template with various stages. Focus and dispense information on six stages using this creative set, that comes with editable features. It contains large content boxes to add your information on topics like budgeted income, received income, accounts receivable, budgeted expenses, paid expenses, accounts payable. You can also showcase facts, figures, and other relevant content using this PPT layout. Grab it now.
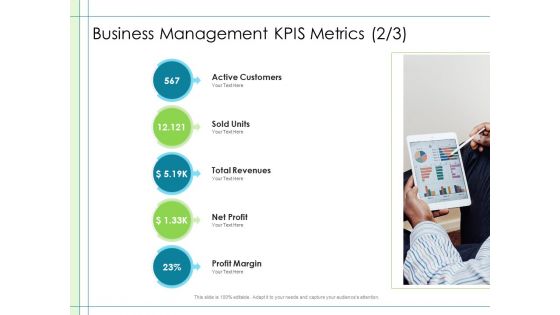
In Depth Business Assessment Business Management KPIS Metrics Customers Ppt PowerPoint Presentation Gallery Infographics PDF
This is a in depth business assessment business management kpis metrics customers ppt powerpoint presentation gallery infographics pdf template with various stages. Focus and dispense information on five stages using this creative set, that comes with editable features. It contains large content boxes to add your information on topics like active customers, sold units, total revenues, net profit, profit margin. You can also showcase facts, figures, and other relevant content using this PPT layout. Grab it now.
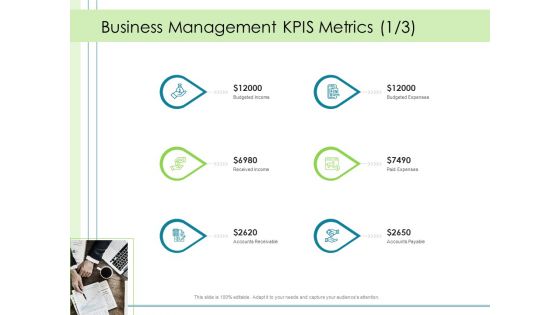
In Depth Business Assessment Business Management Kpis Metrics Ppt PowerPoint Presentation Show Demonstration PDF
This is a in depth business assessment business management kpis metrics ppt powerpoint presentation show demonstration pdf template with various stages. Focus and dispense information on six stages using this creative set, that comes with editable features. It contains large content boxes to add your information on topics like budgeted income, received income, accounts receivable, budgeted expenses, paid expenses, accounts payable. You can also showcase facts, figures, and other relevant content using this PPT layout. Grab it now.
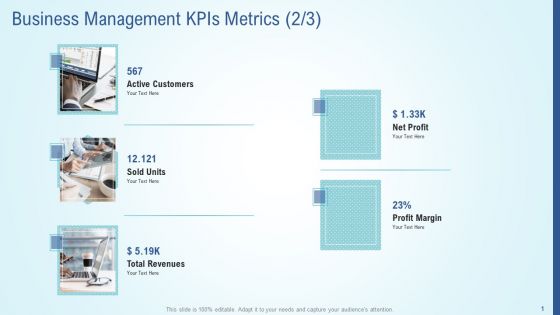
Business Strategy Development Process Business Management Kpis Metrics Margin Pictures PDF
Presenting business strategy development process business management kpis metrics margin pictures pdf to provide visual cues and insights. Share and navigate important information on five stages that need your due attention. This template can be used to pitch topics like active customers, sold units, total revenues, profit margin, net profit. In addtion, this PPT design contains high resolution images, graphics, etc, that are easily editable and available for immediate download.

Business Strategy Development Process Business Management Kpis Metrics Paid Elements PDF
Presenting business strategy development process business management kpis metrics paid elements pdf to provide visual cues and insights. Share and navigate important information on six stages that need your due attention. This template can be used to pitch topics like budgeted income, budgeted expenses, received income, accounts receivable, accounts payable. In addtion, this PPT design contains high resolution images, graphics, etc, that are easily editable and available for immediate download.
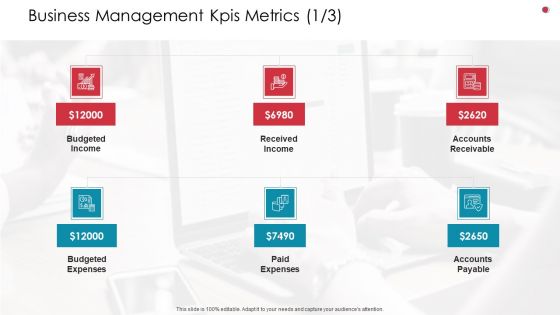
Business Management Kpis Metrics Accounts Business Analysis Method Ppt Portfolio Information PDF
This is a business management kpis metrics accounts business analysis method ppt portfolio information pdf template with various stages. Focus and dispense information on six stages using this creative set, that comes with editable features. It contains large content boxes to add your information on topics like budgeted income, received income, accounts receivable, budgeted expenses, paid expenses. You can also showcase facts, figures, and other relevant content using this PPT layout. Grab it now.
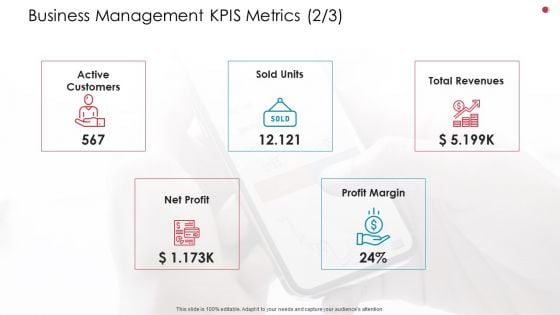
Business Management Kpis Metrics Customers Business Analysis Method Ppt Infographic Template Example PDF
Presenting business management kpis metrics customers business analysis method ppt infographic template example pdf to provide visual cues and insights. Share and navigate important information on five stages that need your due attention. This template can be used to pitch topics like active customers, sold units, total revenues, net profit, profit margin. In addtion, this PPT design contains high resolution images, graphics, etc, that are easily editable and available for immediate download.
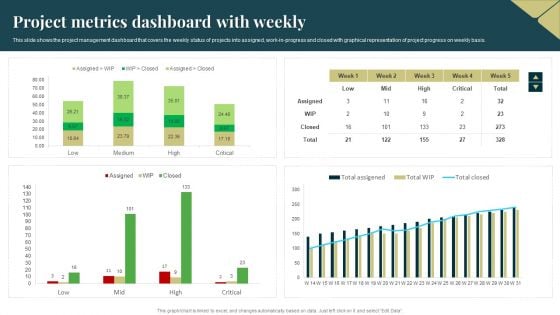
Project Metrics Dashboard With Weekly Formats PDF
This slide shows the project management dashboard that covers the weekly status of projects into assigned, work in progress and closed with graphical representation of project progress on weekly basis. Showcasing this set of slides titled Project Metrics Dashboard With Weekly Formats PDF. The topics addressed in these templates are Project Metrics, Dashboard With Weekly. All the content presented in this PPT design is completely editable. Download it and make adjustments in color, background, font etc. as per your unique business setting.
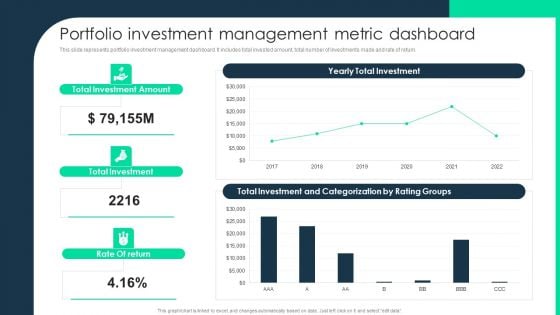
Portfolio Investment Management Metric Dashboard Brochure PDF
This slide represents portfolio investment management dashboard. It includes total invested amount, total number of investments made and rate of return. Deliver an awe inspiring pitch with this creative Portfolio Investment Management Metric Dashboard Brochure PDF bundle. Topics like Portfolio Investment Management, Metric Dashboard can be discussed with this completely editable template. It is available for immediate download depending on the needs and requirements of the user.
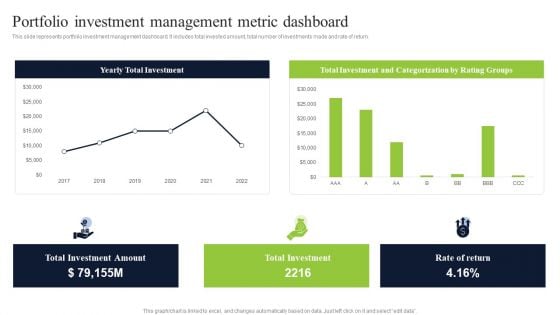
Portfolio Investment Management Metric Dashboard Slides PDF
This slide represents portfolio investment management dashboard. It includes total invested amount, total number of investments made and rate of return. Deliver an awe inspiring pitch with this creative Portfolio Investment Management Metric Dashboard Slides PDF bundle. Topics like Portfolio Investment Management, Metric Dashboard can be discussed with this completely editable template. It is available for immediate download depending on the needs and requirements of the user.
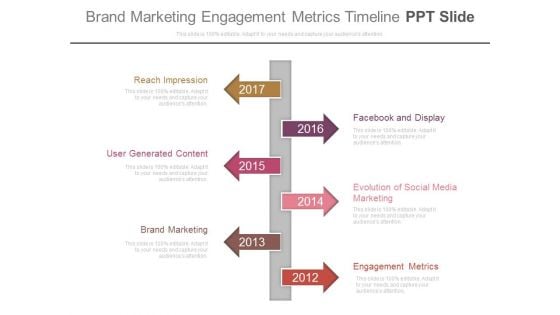
Brand Marketing Engagement Metrics Timeline Ppt Slide
This is a brand marketing engagement metrics timeline ppt slide. This is a six stage process. The stages in this process are time planning, marketing, arrows.
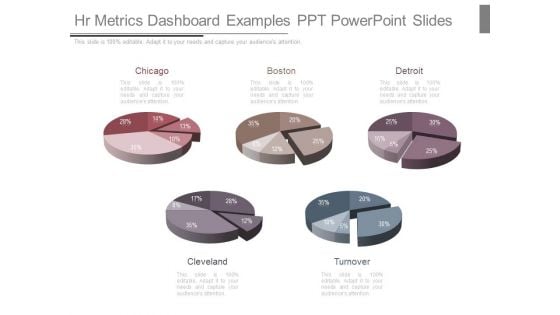
Hr Metrics Dashboard Examples Ppt Powerpoint Slides
This is a hr metrics dashboard examples ppt powerpoint slides. This is a five stage process. The stages in this process are chicago, boston, detroit, cleveland, turnover.
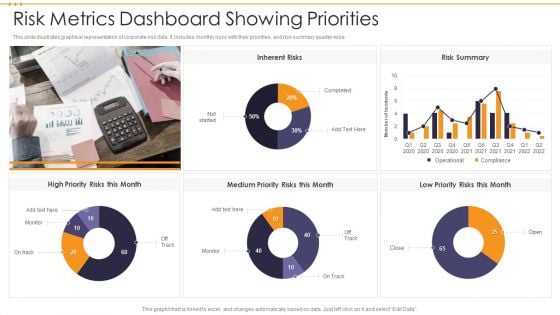
Risk Metrics Dashboard Showing Priorities Infographics PDF
This slide illustrates graphical representation of corporate risk data. It includes monthly risks with their priorities, and risk summary quarter wise. Showcasing this set of slides titled Risk Metrics Dashboard Showing Priorities Infographics PDF. The topics addressed in these templates are Risk Metrics Dashboard Showing Priorities. All the content presented in this PPT design is completely editable. Download it and make adjustments in color, background, font etc. as per your unique business setting.
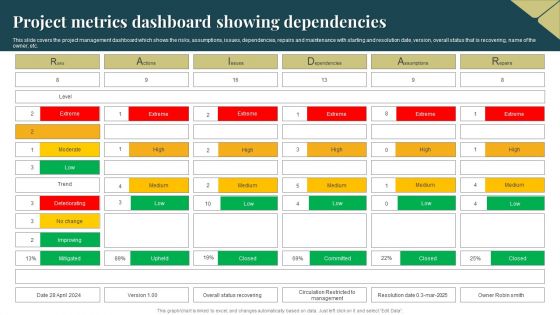
Project Metrics Dashboard Showing Dependencies Brochure PDF
This slide covers the project management dashboard which shows the risks, assumptions, issues, dependencies, repairs and maintenance with starting and resolution date, version, overall status that is recovering, name of the owner, etc. Showcasing this set of slides titled Project Metrics Dashboard Showing Dependencies Brochure PDF. The topics addressed in these templates are Project Metrics, Dashboard Showing Dependencies. All the content presented in this PPT design is completely editable. Download it and make adjustments in color, background, font etc. as per your unique business setting.
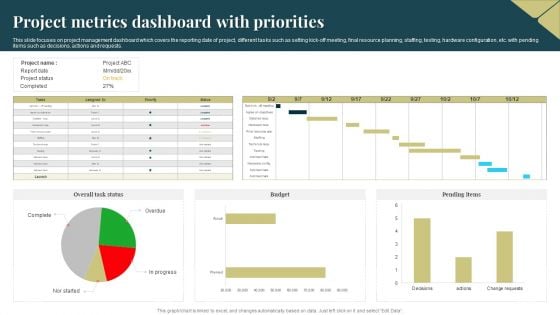
Project Metrics Dashboard With Priorities Formats PDF
This slide focuses on project management dashboard which covers the reporting date of project, different tasks such as setting kick-off meeting, final resource planning, staffing, testing, hardware configuration, etc. with pending items such as decisions, actions and requests. Showcasing this set of slides titled Project Metrics Dashboard With Priorities Formats PDF. The topics addressed in these templates are Budget, Project Metrics Dashboard. All the content presented in this PPT design is completely editable. Download it and make adjustments in color, background, font etc. as per your unique business setting.
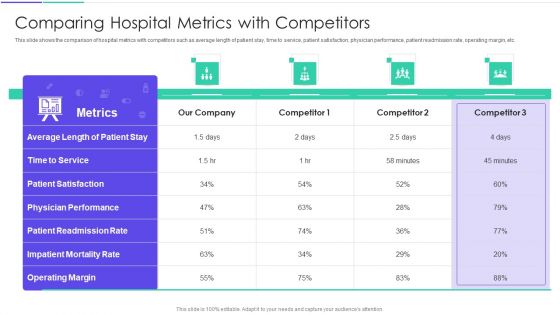
Medical Inventory Management System Comparing Hospital Metrics With Competitors Ideas PDF
This slide shows the comparison of hospital metrics with competitors such as average length of patient stay, time to service, patient satisfaction, physician performance, patient readmission rate, operating margin, etc.Deliver an awe inspiring pitch with this creative medical inventory management system comparing hospital metrics with competitors ideas pdf bundle. Topics like comparing hospital metrics with competitors can be discussed with this completely editable template. It is available for immediate download depending on the needs and requirements of the user.
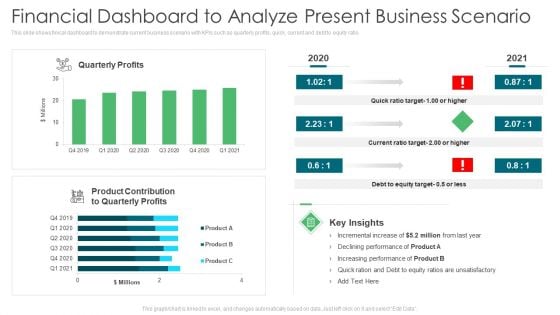
Environmental Assessment Financial Dashboard To Analyze Present Business Scenario Ppt Infographics Ideas PDF
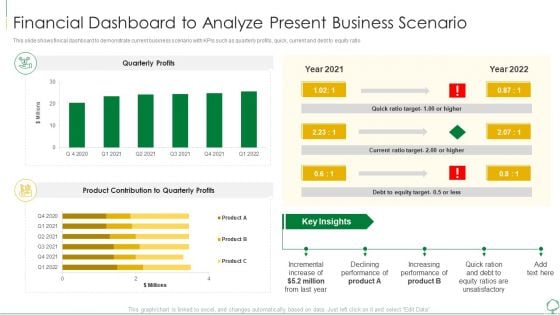
This slide shows finical dashboard to demonstrate current business scenario with KPIs such as quarterly profits, quick, current and debt to equity ratio. Deliver an awe inspiring pitch with this creative environmental assessment financial dashboard to analyze present business scenario ppt infographics ideas pdf bundle. Topics like product contribution, increasing performance, equity target can be discussed with this completely editable template. It is available for immediate download depending on the needs and requirements of the user.
Environmental Examination Tools And Approaches Financial Dashboard To Analyze Sample PDF
This slide shows finical dashboard to demonstrate current business scenario with KPIs such as quarterly profits, quick, current and debt to equity ratio. Deliver and pitch your topic in the best possible manner with this environmental examination tools and approaches financial dashboard to analyze sample pdf. Use them to share invaluable insights on performance, product, equity and impress your audience. This template can be altered and modified as per your expectations. So, grab it now.
Niche Marketing Guide To Target Specific Customer Groups Evaluating Social Media Results With Kpi Dashboard Inspiration PDF
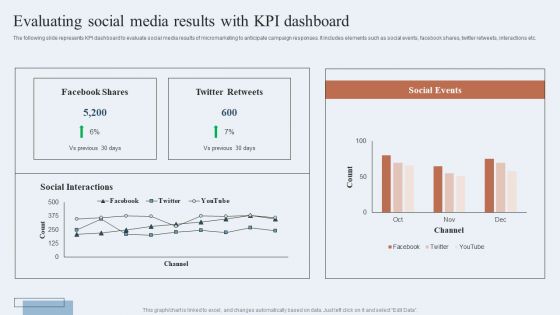
The following slide represents KPI dashboard to evaluate social media results of micromarketing to anticipate campaign responses. It includes elements such as social events, facebook shares, twitter retweets, interactions etc. Are you searching for a Niche Marketing Guide To Target Specific Customer Groups Evaluating Social Media Results With Kpi Dashboard Inspiration PDF that is uncluttered, straightforward, and original Its easy to edit, and you can change the colors to suit your personal or business branding. For a presentation that expresses how much effort you have put in, this template is ideal. With all of its features, including tables, diagrams, statistics, and lists, its perfect for a business plan presentation. Make your ideas more appealing with these professional slides. Download Niche Marketing Guide To Target Specific Customer Groups Evaluating Social Media Results With Kpi Dashboard Inspiration PDF from Slidegeeks today.
Food Processing Industry Latest Insights Trends And Analytics KPI Dashboard For Tracking Supply Chain Costs Demonstration PDF
This slide represents the KPI dashboard to track the multiple cost associated with supply chain in food manufacturing industry. It includes information regarding cash to cash cycle in days, carry cost of inventory along with details of net sales. There are so many reasons you need a Food Processing Industry Latest Insights Trends And Analytics KPI Dashboard For Tracking Supply Chain Costs Demonstration PDF. The first reason is you can not spend time making everything from scratch, Thus, Slidegeeks has made presentation templates for you too. You can easily download these templates from our website easily.
Dashboard Depicting Customer Accomplishment Metrics Slides PDF
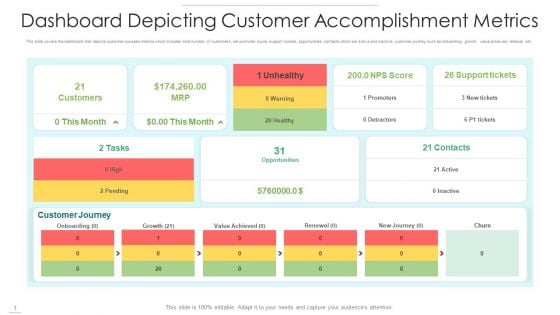
This slide covers the dashboard that depicts customer success metrics which includes total number of customers, net promoter score, support tickets, opportunities, contacts which are active and inactive, customer journey such as onboarding, growth, value achieved, renewal, etc. Showcasing this set of slides titled dashboard depicting customer accomplishment metrics slides pdf. The topics addressed in these templates are customers, unhealthy, support tickets. All the content presented in this PPT design is completely editable. Download it and make adjustments in color, background, font etc. as per your unique business setting.
Project Metrics Dashboard With Speedometers Themes PDF
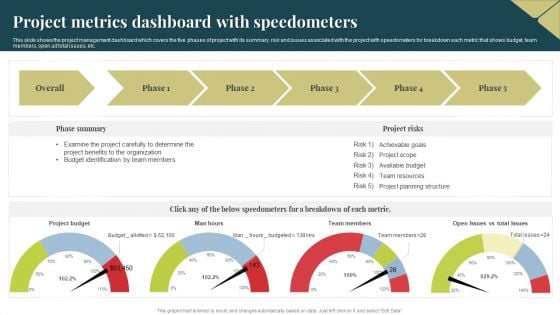
This slide shows the project management dashboard which covers the five phases of project with its summary, risk and issues associated with the project with speedometers for breakdown each metric that shows budget, team members, open ad total issues, etc. Showcasing this set of slides titled Project Metrics Dashboard With Speedometers Themes PDF. The topics addressed in these templates are Budget, Project Benefits, Organization. All the content presented in this PPT design is completely editable. Download it and make adjustments in color, background, font etc. as per your unique business setting.
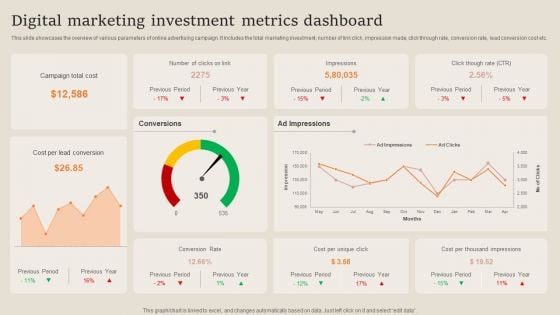
Digital Marketing Investment Metrics Dashboard Professional PDF
This slide showcases the overview of various parameters of online advertising campaign. It includes the total marketing investment, number of link click, impression made, click through rate, conversion rate, lead conversion cost etc. Showcasing this set of slides titled Digital Marketing Investment Metrics Dashboard Professional PDF. The topics addressed in these templates are Campaign Total Cost, Cost Per Lead Conversion, Investment Metrics Dashboard. All the content presented in this PPT design is completely editable. Download it and make adjustments in color, background, font etc. as per your unique business setting.
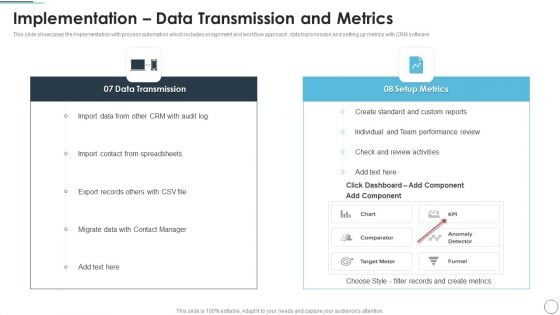
CRM Solutions Implementation Strategy Implementation Data Transmission And Metrics Portrait PDF
This slide showcases the Implementation with process automation which includes assignment and workflow approach, data transmission and setting up metrics with CRM software.Deliver and pitch your topic in the best possible manner with this CRM Solutions Implementation Strategy Implementation Data Transmission And Metrics Portrait PDFF Use them to share invaluable insights on Data Transmission, Team Performance, Export Records and impress your audience. This template can be altered and modified as per your expectations. So, grab it now.
Operational Risk Metrics Dashboard Icon Mockup PDF
Presenting Operational Risk Metrics Dashboard Icon Mockup PDF to dispense important information. This template comprises four stages. It also presents valuable insights into the topics including Operational Risk Metrics Dashboard Icon. This is a completely customizable PowerPoint theme that can be put to use immediately. So, download it and address the topic impactfully.
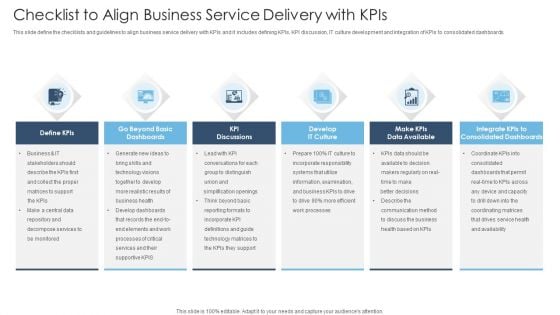
Achieving Proactive From Reactive Checklist To Align Business Service Delivery With Kpis Clipart PDF
This slide define the checklists and guidelines to align business service delivery with KPIs and it includes defining KPIs, KPI discussion, IT culture development and integration of KPIs to consolidated dashboards. This is a Achieving Proactive From Reactive Checklist To Align Business Service Delivery With Kpis Clipart PDF template with various stages. Focus and dispense information on six stages using this creative set, that comes with editable features. It contains large content boxes to add your information on topics like Define KPIs, KPI Discussions, Integrate KPIs. You can also showcase facts, figures, and other relevant content using this PPT layout. Grab it now.
Weekly KPI Attain Production Goals And Objectives Chart Ppt Icon Graphics Template PDF
This slide showcases the manufacturing target achievement table. It can be used for evaluating the variance between actual and estimated KPIs such as throughput rate, inventory turns, scarp rate, etc. Showcasing this set of slides titled Weekly KPI Attain Production Goals And Objectives Chart Ppt Icon Graphics Template PDF. The topics addressed in these templates are Target, KPI, Inventory Turns. All the content presented in this PPT design is completely editable. Download it and make adjustments in color, background, font etc. as per your unique business setting.
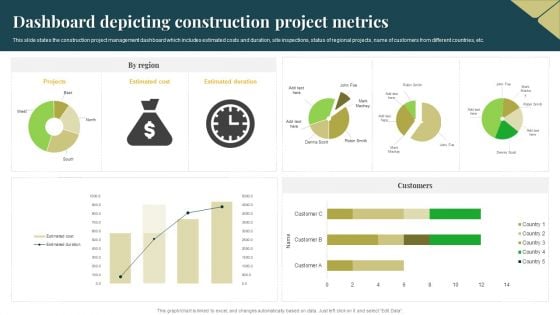
Dashboard Depicting Construction Project Metrics Inspiration PDF
This slide states the construction project management dashboard which includes estimated costs and duration, site inspections, status of regional projects, name of customers from different countries, etc. Pitch your topic with ease and precision using this Dashboard Depicting Construction Project Metrics Inspiration PDF. This layout presents information on Estimated Cost, Estimated Duration, Projects. It is also available for immediate download and adjustment. So, changes can be made in the color, design, graphics or any other component to create a unique layout.
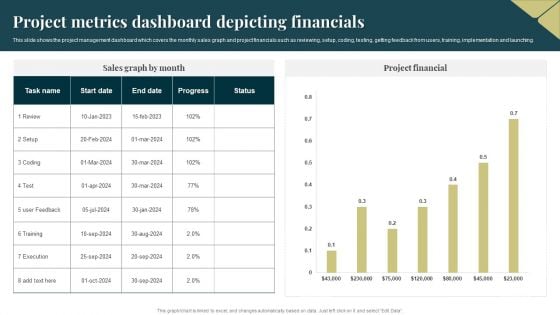
Project Metrics Dashboard Depicting Financials Pictures PDF
This slide shows the project management dashboard which covers the monthly sales graph and project financials such as reviewing, setup, coding, testing, getting feedback from users, training, implementation and launching. Pitch your topic with ease and precision using this Project Metrics Dashboard Depicting Financials Pictures PDF. This layout presents information on Execution, Project Financial. It is also available for immediate download and adjustment. So, changes can be made in the color, design, graphics or any other component to create a unique layout.
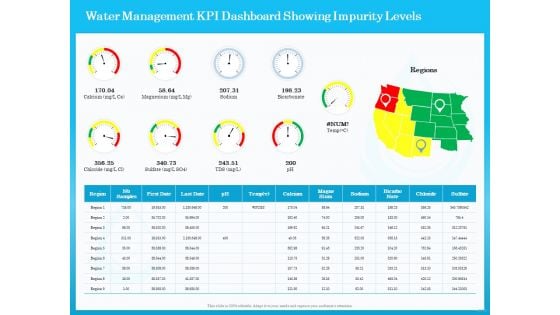
Monitoring And Evaluating Water Quality Water Management KPI Dashboard Showing Impurity Levels Ppt Show Design Inspiration PDF
Presenting this set of slides with name monitoring and evaluating water quality water management kpi dashboard showing impurity levels ppt show design inspiration pdf. The topics discussed in these slides are region, ph, magne sium, sodium, chloride, bicarbo nate. This is a completely editable PowerPoint presentation and is available for immediate download. Download now and impress your audience.

Product Cost Management PCM Cost Management KPI Dashboards Showing Return On Assets And Asset Turnover Elements PDF
Deliver an awe inspiring pitch with this creative product cost management pcm cost management kpi dashboards showing return on assets and asset turnover elements pdf bundle. Topics like return on assets, asset turnover, maintenance costs, target can be discussed with this completely editable template. It is available for immediate download depending on the needs and requirements of the user.
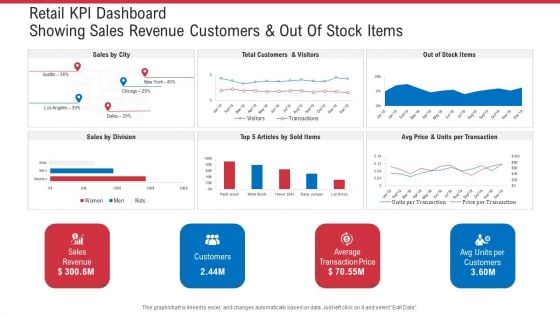
Retail KPI Dashboard Showing Sales Revenue Customers And Out Of Stock Items Ppt Ideas Graphics Design PDF
Deliver an awe-inspiring pitch with this creative retail KPI dashboard showing sales revenue customers and out of stock items ppt ideas graphics design pdf. bundle. Topics like sales revenue, average transaction price, avg units per customers can be discussed with this completely editable template. It is available for immediate download depending on the needs and requirements of the user.
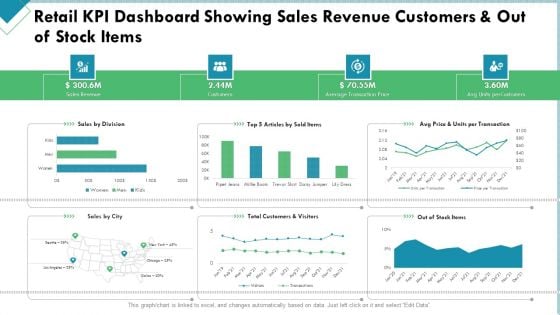
Market Analysis Of Retail Sector Retail KPI Dashboard Showing Sales Revenue Customers And Out Of Stock Items Structure PDF
Deliver and pitch your topic in the best possible manner with this market analysis of retail sector retail kpi dashboard showing sales revenue customers and out of stock items structure pdf. Use them to share invaluable insights on sales revenue, customers, average transaction price and impress your audience. This template can be altered and modified as per your expectations. So, grab it now.
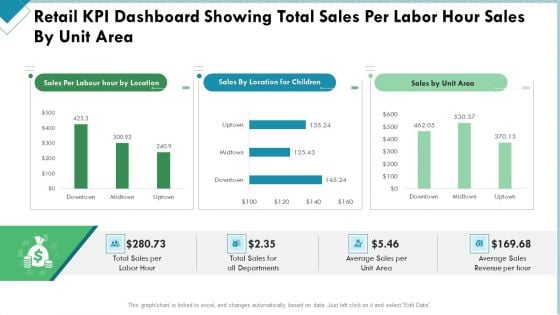
Market Analysis Of Retail Sector Retail KPI Dashboard Showing Total Sales Per Labor Hour Sales By Unit Area Themes PDF
Deliver an awe inspiring pitch with this creative market analysis of retail sector retail kpi dashboard showing total sales per labor hour sales by unit area themes pdf bundle. Topics like sales, revenue, average, departments can be discussed with this completely editable template. It is available for immediate download depending on the needs and requirements of the user.

Erp Project Metrics Plan Dashboard Slides PDF
This slide focuses on project management dashboard for enterprise resource planning which covers the total hours spent that includes project preparation, business blueprint, project realization, final preparation, go live and support with gantt chart showing detailed tasks. Pitch your topic with ease and precision using this Erp Project Metrics Plan Dashboard Slides PDF. This layout presents information on Business Blueprint, Project Preparation, Project Realization. It is also available for immediate download and adjustment. So, changes can be made in the color, design, graphics or any other component to create a unique layout.
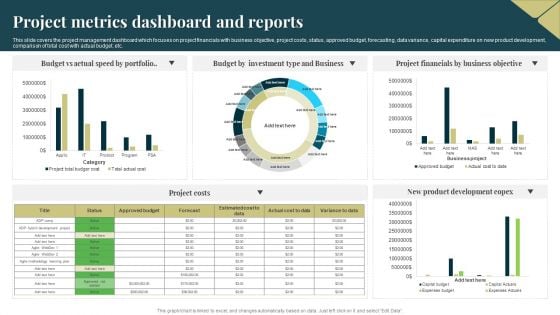
Project Metrics Dashboard And Reports Portrait PDF
This slide covers the project management dashboard which focuses on project financials with business objective, project costs, status, approved budget, forecasting, data variance, capital expenditure on new product development, comparison of total cost with actual budget, etc. Showcasing this set of slides titled Project Metrics Dashboard And Reports Portrait PDF. The topics addressed in these templates are Budget, Portfolio, Investment. All the content presented in this PPT design is completely editable. Download it and make adjustments in color, background, font etc. as per your unique business setting.
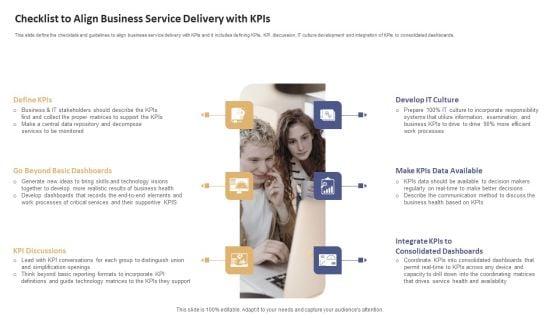
Data Processing Services Delivery Checklist To Align Business Service Delivery With Kpis Designs PDF
This slide define the checklists and guidelines to align business service delivery with KPIs and it includes defining KPIs, KPI discussion, IT culture development and integration of KPIs to consolidated dashboards. This is a Data Processing Services Delivery Checklist To Align Business Service Delivery With Kpis Designs PDF template with various stages. Focus and dispense information on six stages using this creative set, that comes with editable features. It contains large content boxes to add your information on topics like Define KPIs, KPI Discussions, Develop IT Culture. You can also showcase facts, figures, and other relevant content using this PPT layout. Grab it now.
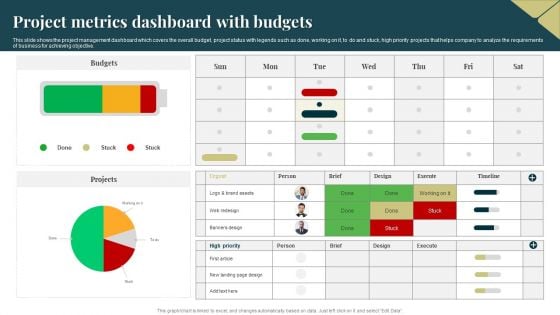
Project Metrics Dashboard With Budgets Topics PDF
This slide shows the project management dashboard which covers the overall budget, project status with legends such as done, working on it, to do and stuck, high priority projects that helps company to analyze the requirements of business for achieving objective. Pitch your topic with ease and precision using this Project Metrics Dashboard With Budgets Topics PDF. This layout presents information on Budgets, Projects, Banners Design. It is also available for immediate download and adjustment. So, changes can be made in the color, design, graphics or any other component to create a unique layout.


 Continue with Email

 Home
Home


