key performance indicators
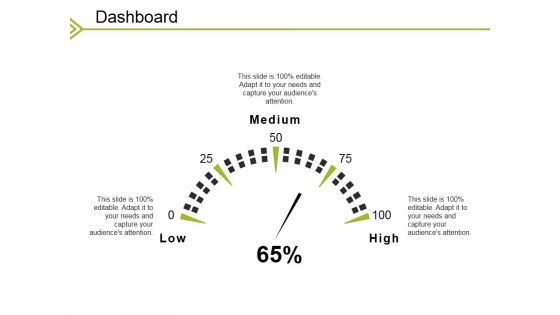
Dashboard Ppt PowerPoint Presentation Layouts Model
This is a dashboard ppt powerpoint presentation layouts model. This is a three stage process. The stages in this process are business, dashboard, low, medium, high.
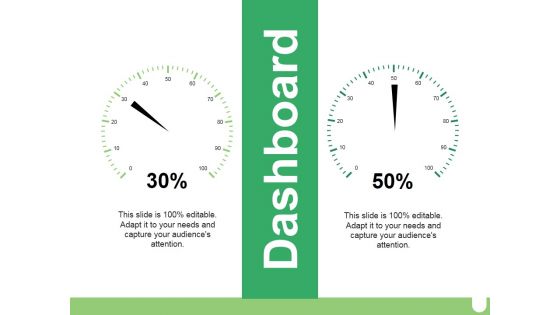
Dashboard Ppt PowerPoint Presentation File Graphic Tips
This is a dashboard ppt powerpoint presentation file graphic tips. This is a two stage process. The stages in this process are business, marketing, percentage, dashboard, process.
Dashboard Ppt PowerPoint Presentation Icon Sample
This is a dashboard ppt powerpoint presentation icon sample. This is a one stage process. The stages in this process are business, marketing, dashboard, high speed, percentage.
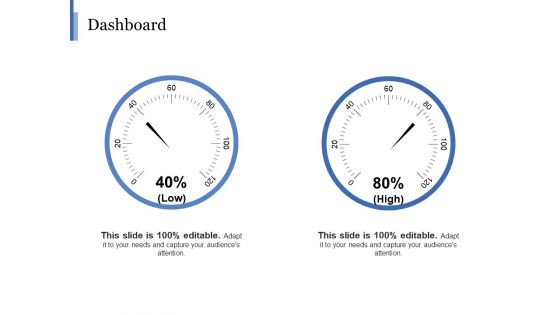
Dashboard Ppt PowerPoint Presentation Visual Aids Inspiration
This is a dashboard ppt powerpoint presentation visual aids inspiration. This is a two stage process. The stages in this process are business, marketing, percentage, dashboard, process.
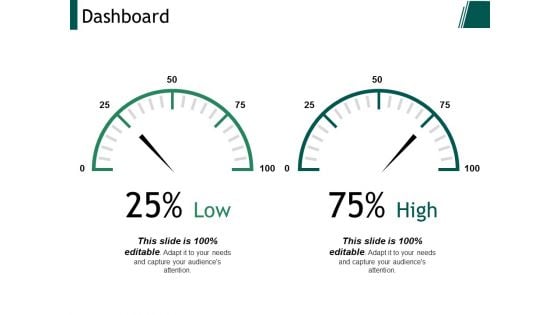
Dashboard Ppt PowerPoint Presentation Model Layouts
This is a dashboard ppt powerpoint presentation model layouts. This is a two stage process. The stages in this process are high, low, dashboard, planning, marketing.
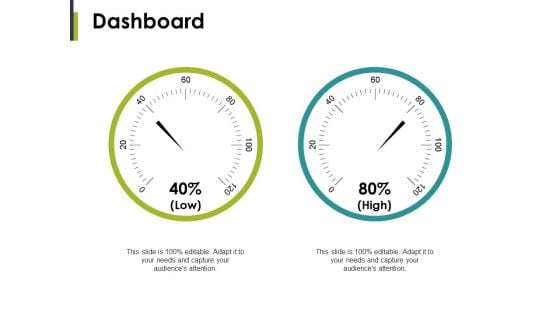
Dashboard Ppt PowerPoint Presentation Show Smartart
This is a dashboard ppt powerpoint presentation show smartart. This is a three stage process. The stages in this process are low, high, dashboard, measuring, finance.
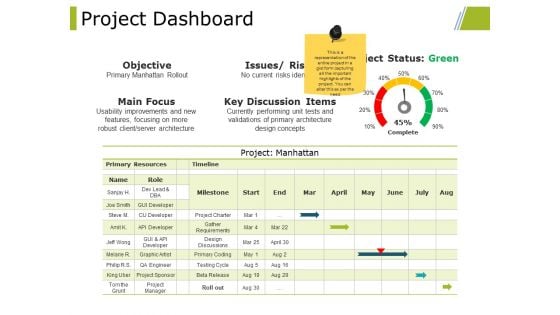
Project Dashboard Ppt PowerPoint Presentation Portfolio Tips
This is a project dashboard ppt powerpoint presentation portfolio tips. This is a five stage process. The stages in this process are project dashboard, measurement, marketing, strategy, business.
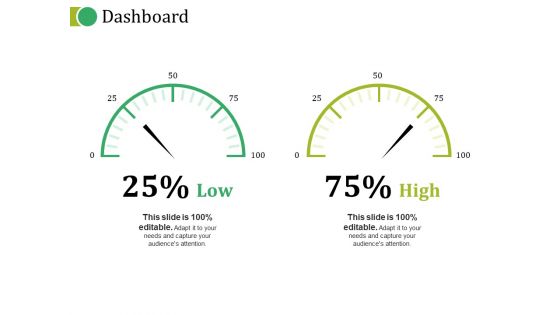
Dashboard Ppt PowerPoint Presentation Portfolio Layout
This is a dashboard ppt powerpoint presentation portfolio layout. This is a two stage process. The stages in this process are low, medium, high, dashboard, measurement.
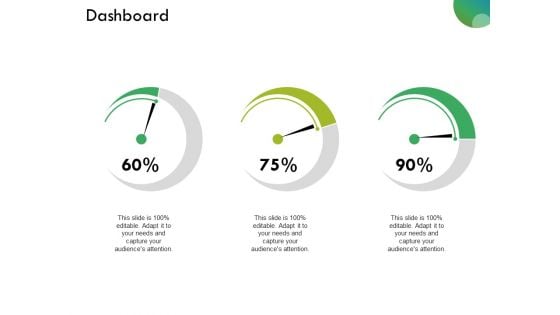
Dashboard Ppt PowerPoint Presentation Styles Example
This is a dashboard ppt powerpoint presentation styles example. This is a three stage process. The stages in this process are dashboard, marketing, strategy, planning, management.
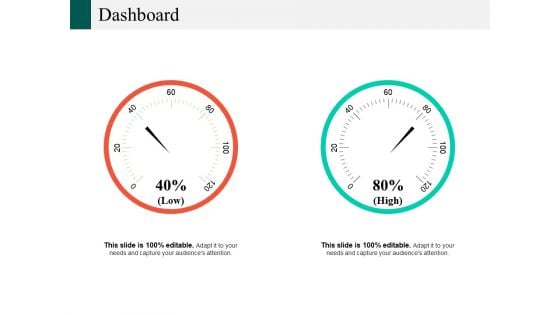
Dashboard Ppt PowerPoint Presentation Slides Visual Aids
This is a dashboard ppt powerpoint presentation slides visual aids. This is a two stage process. The stages in this process are low, medium, high, dashboard, measurement.
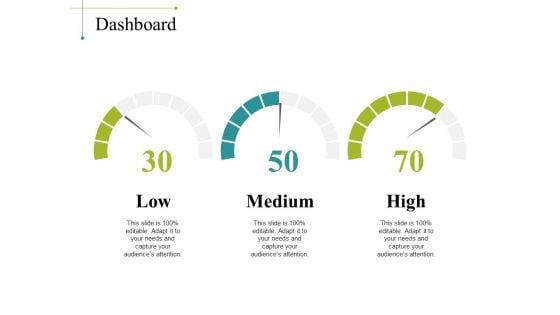
Dashboard Ppt PowerPoint Presentation Summary Design Inspiration
This is a dashboard ppt powerpoint presentation summary design inspiration. This is a three stage process. The stages in this process are business, marketing, low, medium, high, dashboard.
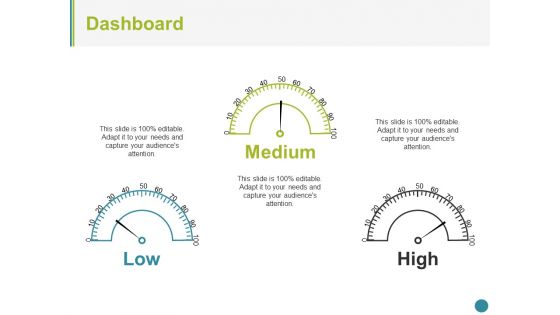
Dashboard Ppt PowerPoint Presentation Inspiration Clipart Images
This is a Dashboard Ppt PowerPoint Presentation Inspiration Clipart Images. This is a three stage process. The stages in this process are dashboard, medium, low, high.
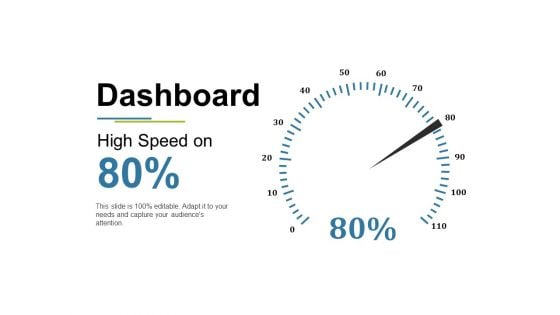
Dashboard Ppt PowerPoint Presentation Model Portrait
This is a dashboard ppt powerpoint presentation model portrait. This is a one stage process. The stages in this process are business, marketing, high speed, dashboard, percentage.
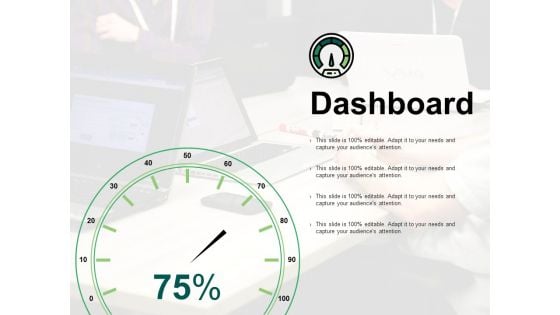
Dashboard Ppt PowerPoint Presentation Infographic Template Show
This is a dashboard ppt powerpoint presentation infographic template show. This is one stage process. The stages in this process are business, dashboard, marketing, percentage, process.
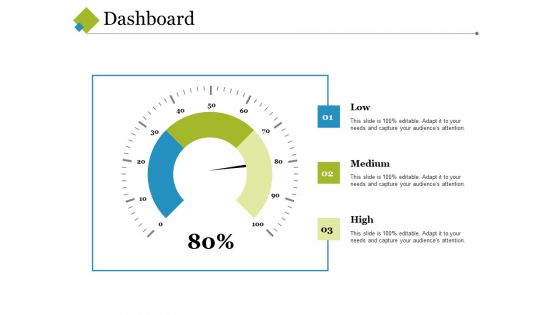
Dashboard Ppt PowerPoint Presentation Layouts Master Slide
This is a dashboard ppt powerpoint presentation layouts master slide. This is a three stage process. The stages in this process are low, medium, high, dashboard, measurement.
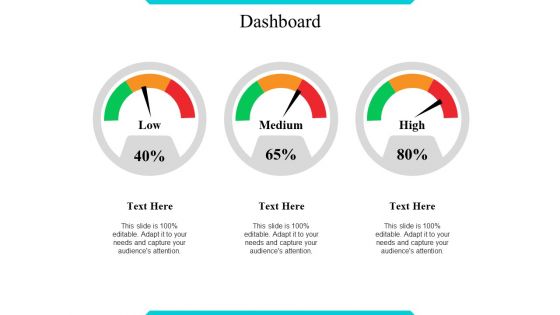
Dashboard Ppt PowerPoint Presentation Gallery Designs Download
This is a dashboard ppt powerpoint presentation gallery designs download. This is a three stage process. The stages in this process are low, medium, high, dashboard, measurement.
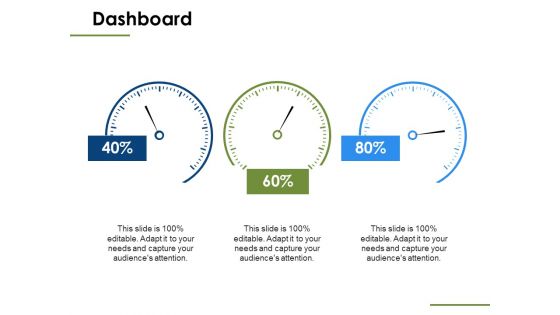
Dashboard Measure Ppt PowerPoint Presentation Ideas Samples
This is a dashboard measure ppt powerpoint presentation ideas samples. This is a three stage process. The stages in this process are dashboard, business, marketing, management, strategy.
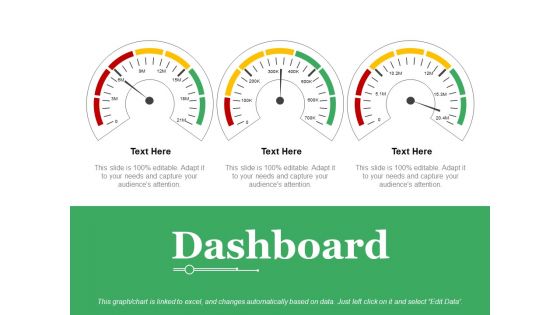
Dashboard Ppt PowerPoint Presentation Infographics Layouts
This is a dashboard ppt powerpoint presentation infographics layouts. This is a three stage process. The stages in this process are low, medium, high, dashboard, measurement.
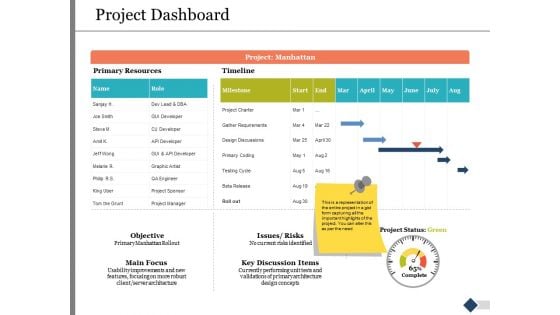
Project Dashboard Ppt PowerPoint Presentation Slides Gallery
This is a project dashboard ppt powerpoint presentation slides gallery. This is a two stage process. The stages in this process are marketing, business, management, dashboard.
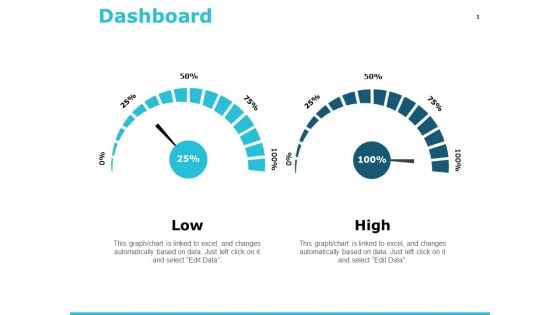
Dashboard Management Ppt PowerPoint Presentation Show Deck
This is a dashboard management ppt powerpoint presentation show deck. This is a two stage process. The stages in this process are dashboard, finance, analysis, business, investment.
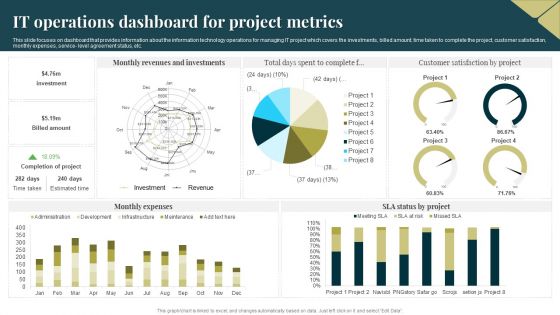
IT Operations Dashboard For Project Metrics Portrait PDF
This slide focuses on dashboard that provides information about the information technology operations for managing IT project which covers the investments, billed amount, time taken to complete the project, customer satisfaction, monthly expenses, service level agreement status, etc. Pitch your topic with ease and precision using this IT Operations Dashboard For Project Metrics Portrait PDF. This layout presents information on Revenues, Investments, Monthly Expenses. It is also available for immediate download and adjustment. So, changes can be made in the color, design, graphics or any other component to create a unique layout.
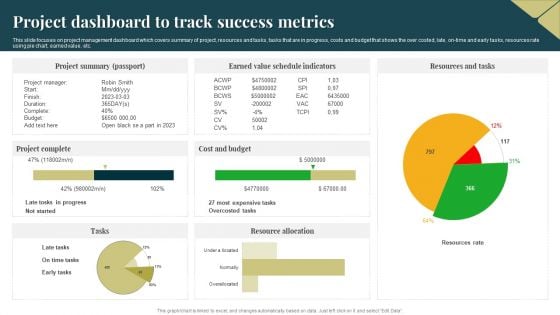
Project Dashboard To Track Success Metrics Background PDF
This slide focuses on project management dashboard which covers summary of project, resources and tasks, tasks that are in progress, costs and budget that shows the over costed, late, on time and early tasks, resources rate using pie chart, earned value, etc. Pitch your topic with ease and precision using this Project Dashboard To Track Success Metrics Background PDF. This layout presents information on Cost And Budget, Project Summary, Resource Allocation. It is also available for immediate download and adjustment. So, changes can be made in the color, design, graphics or any other component to create a unique layout.
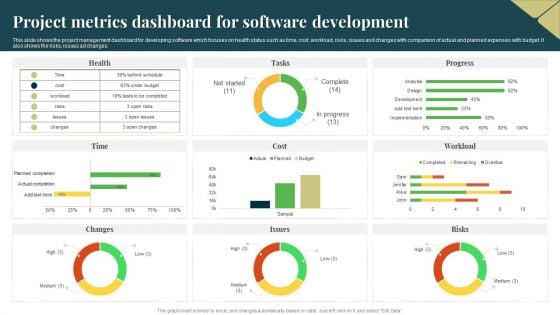
Project Metrics Dashboard For Software Development Designs PDF
This slide shows the project management dashboard for developing software which focuses on health status such as time, cost, workload, risks, issues and changes with comparison of actual and planned expenses with budget. It also shows the risks, issues ad changes. Pitch your topic with ease and precision using this Project Metrics Dashboard For Software Development Designs PDF. This layout presents information on Risks, Budget, Cost. It is also available for immediate download and adjustment. So, changes can be made in the color, design, graphics or any other component to create a unique layout.
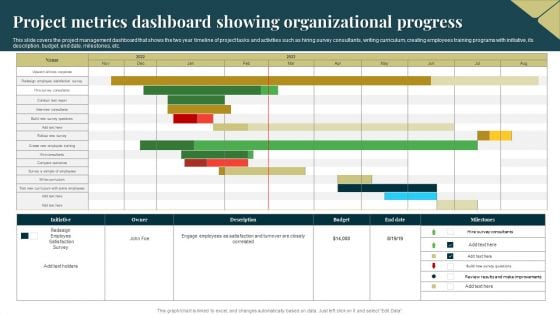
Project Metrics Dashboard Showing Organizational Progress Demonstration PDF
This slide covers the project management dashboard that shows the two year timeline of project tasks and activities such as hiring survey consultants, writing curriculum, creating employees training programs with initiative, its description, budget, end date, milestones, etc. Pitch your topic with ease and precision using this Project Metrics Dashboard Showing Organizational Progress Demonstration PDF. This layout presents information on Budget, Survey, Employees. It is also available for immediate download and adjustment. So, changes can be made in the color, design, graphics or any other component to create a unique layout.

Project Metrics Dashboard With Average Margin Sample PDF
This slide focuses on project management dashboard which covers number of active projects, average margin, revenues, costs, tasks status, resources with planned and actual efforts, available hours, tasks assignments with project deadlines, client, etc. Pitch your topic with ease and precision using this Project Metrics Dashboard With Average Margin Sample PDF. This layout presents information on Average Margin, Revenue, Cost. It is also available for immediate download and adjustment. So, changes can be made in the color, design, graphics or any other component to create a unique layout.
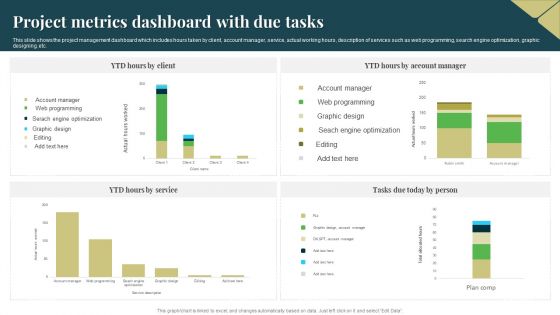
Project Metrics Dashboard With Due Tasks Microsoft PDF
This slide shows the project management dashboard which includes hours taken by client, account manager, service, actual working hours, description of services such as web programming, search engine optimization, graphic designing, etc. Pitch your topic with ease and precision using this Project Metrics Dashboard With Due Tasks Microsoft PDF. This layout presents information on Service, Optimization, Graphic Design. It is also available for immediate download and adjustment. So, changes can be made in the color, design, graphics or any other component to create a unique layout.
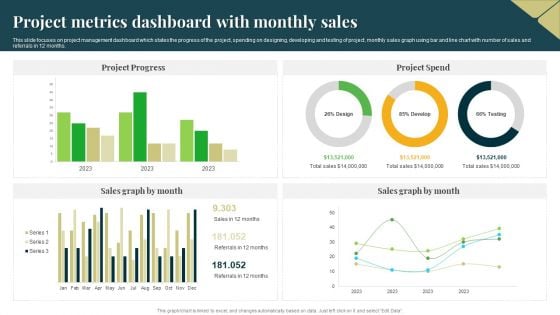
Project Metrics Dashboard With Monthly Sales Professional PDF
This slide focuses on project management dashboard which states the progress of the project, spending on designing, developing and testing of project, monthly sales graph using bar and line chart with number of sales and referrals in 12 months. Pitch your topic with ease and precision using this Project Metrics Dashboard With Monthly Sales Professional PDF. This layout presents information on Project Progress, Project Spend, Sales Graph. It is also available for immediate download and adjustment. So, changes can be made in the color, design, graphics or any other component to create a unique layout.
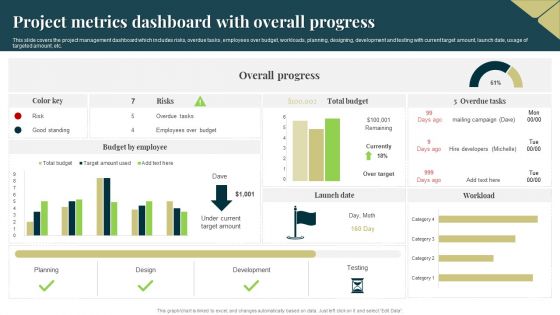
Project Metrics Dashboard With Overall Progress Brochure PDF
This slide covers the project management dashboard which includes risks, overdue tasks, employees over budget, workloads, planning, designing, development and testing with current target amount, launch date, usage of targeted amount, etc. Pitch your topic with ease and precision using this Project Metrics Dashboard With Overall Progress Brochure PDF. This layout presents information on Design, Planning, Development. It is also available for immediate download and adjustment. So, changes can be made in the color, design, graphics or any other component to create a unique layout.

Project Metrics Dashboard With Task Status Rules PDF
This slide shows the project management dashboard which shows the number of team members of managing project activities, estimated and actual time to complete the project task, hours taken by employees with achieved and open milestones and progress status. Pitch your topic with ease and precision using this Project Metrics Dashboard With Task Status Rules PDF. This layout presents information on Team Members, Employee. It is also available for immediate download and adjustment. So, changes can be made in the color, design, graphics or any other component to create a unique layout.
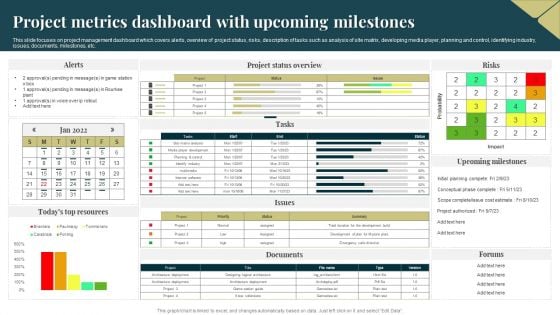
Project Metrics Dashboard With Upcoming Milestones Demonstration PDF
This slide focuses on project management dashboard which covers alerts, overview of project status, risks, description of tasks such as analysis of site matrix, developing media player, planning and control, identifying industry, issues, documents, milestones, etc. Pitch your topic with ease and precision using this Project Metrics Dashboard With Upcoming Milestones Demonstration PDF. This layout presents information on Probability, Project, Risks. It is also available for immediate download and adjustment. So, changes can be made in the color, design, graphics or any other component to create a unique layout.
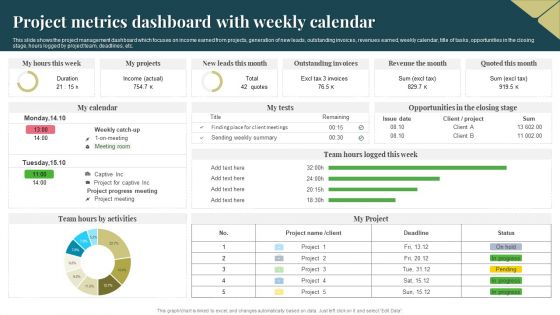
Project Metrics Dashboard With Weekly Calendar Download PDF
This slide shows the project management dashboard which focuses on income earned from projects, generation of new leads, outstanding invoices, revenues earned, weekly calendar, title of tasks, opportunities in the closing stage, hours logged by project team, deadlines, etc. Pitch your topic with ease and precision using this Project Metrics Dashboard With Weekly Calendar Download PDF. This layout presents information on Income, Revenue, Project. It is also available for immediate download and adjustment. So, changes can be made in the color, design, graphics or any other component to create a unique layout.
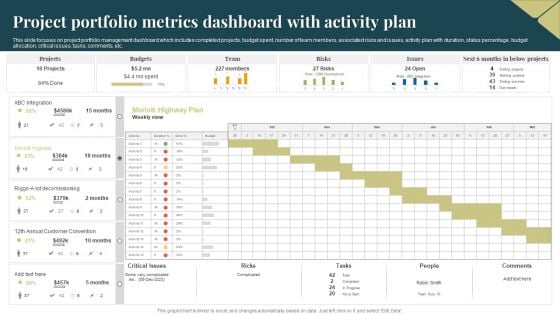
Project Portfolio Metrics Dashboard With Activity Plan Clipart PDF
This slide focuses on project portfolio management dashboard which includes completed projects, budget spent, number of team members, associated risks and issues, activity plan with duration, status percentage, budget allocation, critical issues, tasks, comments, etc. Pitch your topic with ease and precision using this Project Portfolio Metrics Dashboard With Activity Plan Clipart PDF. This layout presents information on Budgets, Team, Risks. It is also available for immediate download and adjustment. So, changes can be made in the color, design, graphics or any other component to create a unique layout.
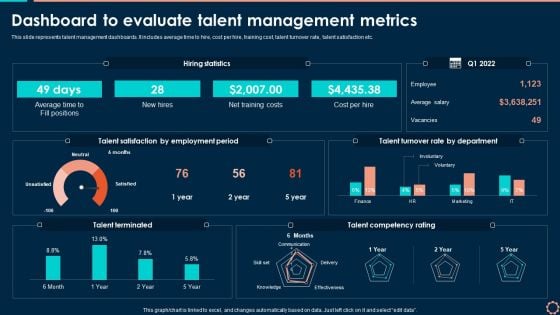
Dashboard To Evaluate Talent Management Metrics Topics PDF
This slide represents talent management dashboards. It includes average time to hire, cost per hire, training cost, talent turnover rate, talent satisfaction etc. Boost your pitch with our creative Dashboard To Evaluate Talent Management Metrics Topics PDF. Deliver an awe inspiring pitch that will mesmerize everyone. Using these presentation templates you will surely catch everyones attention. You can browse the ppts collection on our website. We have researchers who are experts at creating the right content for the templates. So you do not have to invest time in any additional work. Just grab the template now and use them.
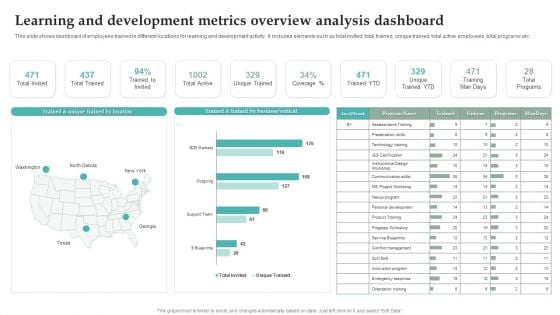
Learning And Development Metrics Overview Analysis Dashboard Graphics PDF
This slide shows dashboard of employees trained in different locations for learning and development activity. It includes elements such as total invited, total trained, unique trained, total active employees, total programs etc. Pitch your topic with ease and precision using this Learning And Development Metrics Overview Analysis Dashboard Graphics PDF. This layout presents information on Unique Trained YTD, Training Man Days, Total Programs. It is also available for immediate download and adjustment. So, changes can be made in the color, design, graphics or any other component to create a unique layout.
Guide For Effective Brand Customer Tracking Dashboard To Monitor Brand Loyalty Sample PDF
This slide provides information brand loyalty tracking dashboard in order to monitor customer engagement, average revenues, new vs. returning visitors performance, etc. This modern and well-arranged Guide For Effective Brand Customer Tracking Dashboard To Monitor Brand Loyalty Sample PDF provides lots of creative possibilities. It is very simple to customize and edit with the Powerpoint Software. Just drag and drop your pictures into the shapes. All facets of this template can be edited with Powerpoint, no extra software is necessary. Add your own material, put your images in the places assigned for them, adjust the colors, and then you can show your slides to the world, with an animated slide included.

Internal Audit Metrics Flowchart Ppt Infographic Template Example Introduction PDF
This slide depicts the flowchart for the internal audit KPI metrics. It includes the information related to steps involved in the audit process and planning. Presenting Internal Audit Metrics Flowchart Ppt Infographic Template Example Introduction PDF to dispense important information. This template comprises one stages. It also presents valuable insights into the topics including Audit Members, Risk Assessment, Audit Scheduling. This is a completely customizable PowerPoint theme that can be put to use immediately. So, download it and address the topic impactfully.
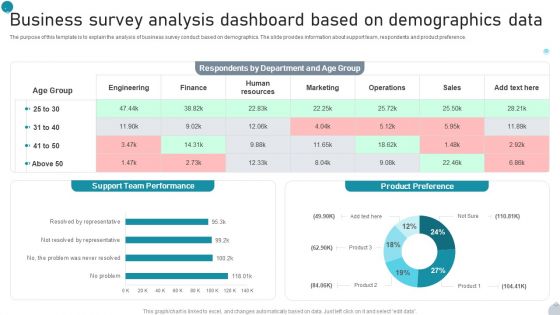
Business Survey Analysis Dashboard Based On Demographics Data Microsoft PDF
The purpose of this template is to explain the analysis of business survey conduct based on demographics. The slide provides information about support team, respondents and product preference. Pitch your topic with ease and precision using this Business Survey Analysis Dashboard Based On Demographics Data Microsoft PDF. This layout presents information on Support, Team Performance, Product Preference It is also available for immediate download and adjustment. So, changes can be made in the color, design, graphics or any other component to create a unique layout.

Risk Metrics Dashboard Ppt PowerPoint Presentation Complete With Slides
If designing a presentation takes a lot of your time and resources and you are looking for a better alternative, then this Risk Metrics Dashboard Ppt PowerPoint Presentation Complete With Slides is the right fit for you. This is a prefabricated set that can help you deliver a great presentation on the topic. All the fourteen slides included in this sample template can be used to present a birds-eye view of the topic. These slides are also fully editable, giving you enough freedom to add specific details to make this layout more suited to your business setting. Apart from the content, all other elements like color, design, theme are also replaceable and editable. This helps in designing a variety of presentations with a single layout. Not only this, you can use this PPT design in formats like PDF, PNG, and JPG once downloaded. Therefore, without any further ado, download and utilize this sample presentation as per your liking.
Project Metrics Dashboard Ppt PowerPoint Presentation Complete With Slides
Improve your presentation delivery using this Project Metrics Dashboard Ppt PowerPoint Presentation Complete With Slides. Support your business vision and objectives using this well-structured PPT deck. This template offers a great starting point for delivering beautifully designed presentations on the topic of your choice. Comprising sixty three this professionally designed template is all you need to host discussion and meetings with collaborators. Each slide is self-explanatory and equipped with high-quality graphics that can be adjusted to your needs. Therefore, you will face no difficulty in portraying your desired content using this PPT slideshow. This PowerPoint slideshow contains every important element that you need for a great pitch. It is not only editable but also available for immediate download and utilization. The color, font size, background, shapes everything can be modified to create your unique presentation layout. Therefore, download it now.
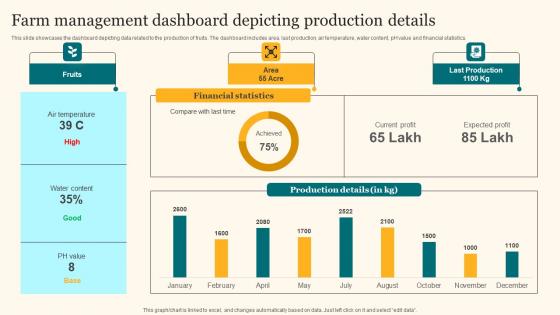
Farm Management Dashboard Depicting Agricultural Product Promotion Pictures Pdf
This slide showcases the dashboard depicting data related to the production of fruits. The dashboard includes area, last production, air temperature, water content, pH value and financial statistics. This modern and well-arranged Farm Management Dashboard Depicting Agricultural Product Promotion Pictures Pdf provides lots of creative possibilities. It is very simple to customize and edit with the Powerpoint Software. Just drag and drop your pictures into the shapes. All facets of this template can be edited with Powerpoint, no extra software is necessary. Add your own material, put your images in the places assigned for them, adjust the colors, and then you can show your slides to the world, with an animated slide included. This slide showcases the dashboard depicting data related to the production of fruits. The dashboard includes area, last production, air temperature, water content, pH value and financial statistics.
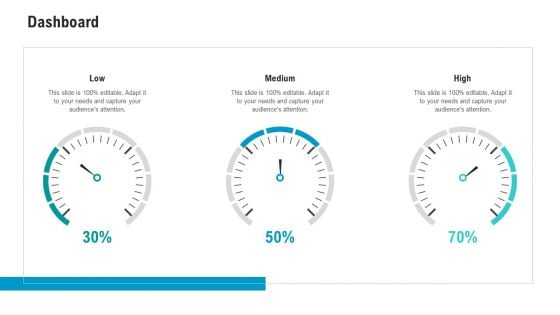
API Ecosystem Dashboard Clipart PDF
This is a api ecosystem dashboard clipart pdf template with various stages. Focus and dispense information on three stages using this creative set, that comes with editable features. It contains large content boxes to add your information on topics like dashboard. You can also showcase facts, figures, and other relevant content using this PPT layout. Grab it now.
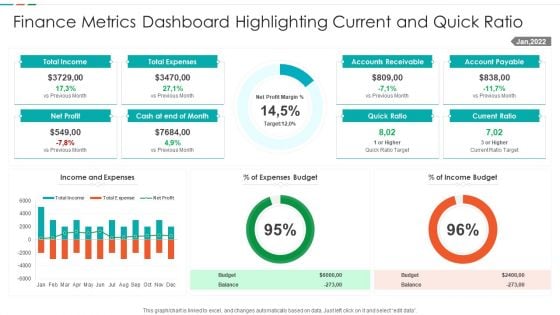
Finance Metrics Dashboard Highlighting Current And Quick Ratio Template PDF
This graph or chart is linked to excel, and changes automatically based on data. Just left click on it and select edit data. Showcasing this set of slides titled Finance Metrics Dashboard Highlighting Current And Quick Ratio Template PDF. The topics addressed in these templates are Total Income Budget, Total Expenses Balance, Net Profit Quick, Ratio Current Ratio. All the content presented in this PPT design is completely editable. Download it and make adjustments in color, background, font etc. as per your unique business setting.
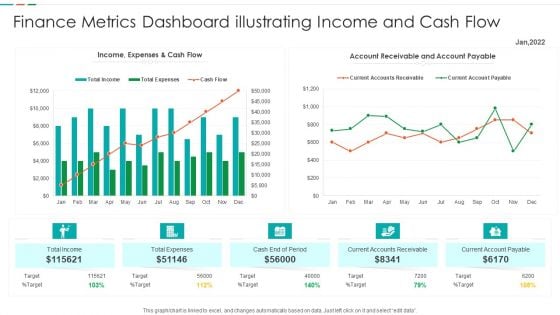
Finance Metrics Dashboard Illustrating Income And Cash Flow Template PDF
This graph or chart is linked to excel, and changes automatically based on data. Just left click on it and select edit data. Pitch your topic with ease and precision using this Finance Metrics Dashboard Illustrating Income And Cash Flow Template PDF. This layout presents information on Current Accounts Receivable, Current Account Payable, Cash End Period, Account Receivable Account. It is also available for immediate download and adjustment. So, changes can be made in the color, design, graphics or any other component to create a unique layout.
Dashboard Ppt PowerPoint Presentation Icon
This is a dashboard ppt powerpoint presentation icon. This is a three stage process. The stages in this process are revenue, units sold, purchase value revenue, units sold, purchase value.
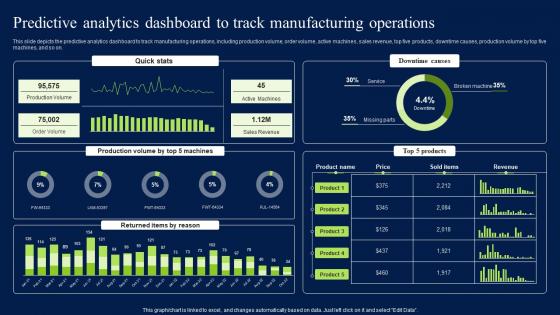
Predictive Analytics Dashboard To Track Manufacturing Operations Download PDF
This slide depicts the predictive analytics dashboard to track manufacturing operations, including production volume, order volume, active machines, sales revenue, top five products, downtime causes, production volume by top five machines, and so on. Present like a pro with Predictive Analytics Dashboard To Track Manufacturing Operations Download PDF Create beautiful presentations together with your team, using our easy-to-use presentation slides. Share your ideas in real-time and make changes on the fly by downloading our templates. So whether you are in the office, on the go, or in a remote location, you can stay in sync with your team and present your ideas with confidence. With Slidegeeks presentation got a whole lot easier. Grab these presentations today. This slide depicts the predictive analytics dashboard to track manufacturing operations, including production volume, order volume, active machines, sales revenue, top five products, downtime causes, production volume by top five machines, and so on.
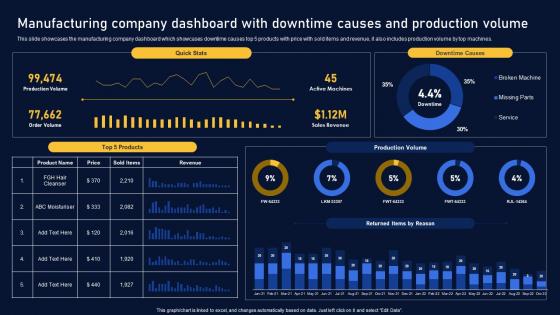
Manufacturing Company Dashboard Multinational Organization Customer Goods Diagrams Pdf
This slide showcases the manufacturing company dashboard which showcases downtime causes top 5 products with price with sold items and revenue, it also includes production volume by top machines. This modern and well arranged Manufacturing Company Dashboard Multinational Organization Customer Goods Diagrams Pdf provides lots of creative possibilities. It is very simple to customize and edit with the Powerpoint Software. Just drag and drop your pictures into the shapes. All facets of this template can be edited with Powerpoint, no extra software is necessary. Add your own material, put your images in the places assigned for them, adjust the colors, and then you can show your slides to the world, with an animated slide included. This slide showcases the manufacturing company dashboard which showcases downtime causes top 5 products with price with sold items and revenue, it also includes production volume by top machines.
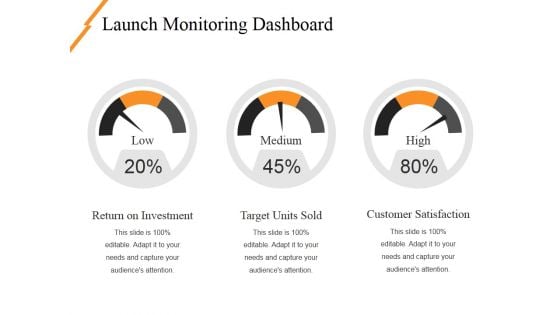
Launch Monitoring Dashboard Ppt PowerPoint Presentation Ideas Layouts
This is a launch monitoring dashboard ppt powerpoint presentation ideas layouts. This is a three stage process. The stages in this process are low, medium, high, dashboard, measurement.
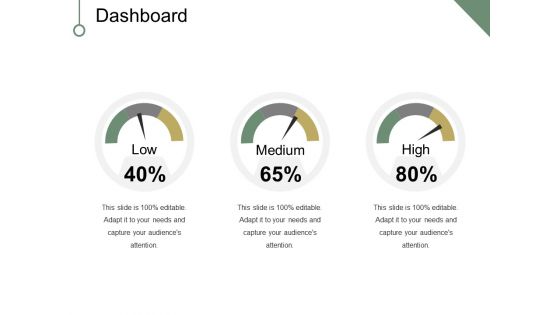
Dashboard Ppt PowerPoint Presentation Infographic Template Background Image
This is a dashboard ppt powerpoint presentation infographic template background image. This is a three stage process. The stages in this process are dashboard, business, marketing, percentage, low.
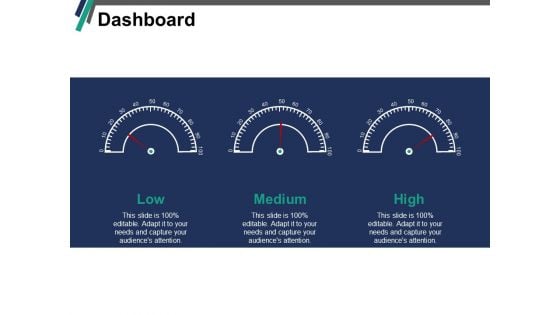
Dashboard Low Medium Ppt PowerPoint Presentation Gallery Rules
This is a dashboard low medium ppt powerpoint presentation gallery rules. This is a three stage process. The stages in this process are dashboard, low, medium, high, business.
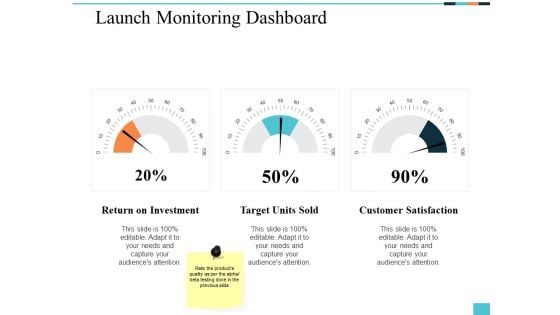
Launch Monitoring Dashboard Ppt PowerPoint Presentation Infographics Styles
This is a launch monitoring dashboard ppt powerpoint presentation infographics styles. This is a three stage process. The stages in this process are business, management, marketing, dashboard.

Dashboard Management Ppt PowerPoint Presentation Infographic Template Graphics
This is a dashboard management ppt powerpoint presentation infographic template graphics. This is a three stage process. The stages in this process are business, management, marketing, dashboard.

Sustainability Calculation With KPI Ppt PowerPoint Presentation Complete Deck With Slides
This complete deck acts as a great communication tool. It helps you in conveying your business message with personalized sets of graphics, icons etc. Comprising a set of fourty five slides, this complete deck can help you persuade your audience. It also induces strategic thinking as it has been thoroughly researched and put together by our experts. Not only is it easily downloadable but also editable. The color, graphics, theme any component can be altered to fit your individual needs. So grab it now.
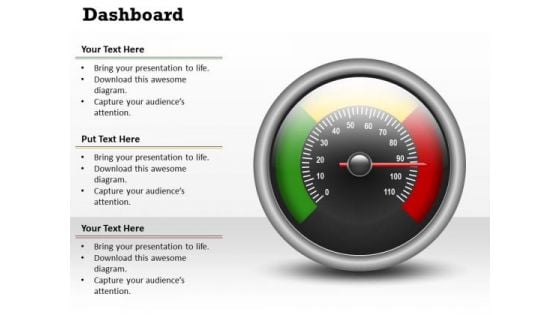
Consulting Diagram Dashboard Busines Design Marketing Diagram
Put In A Dollop Of Our Consulting Diagram Dashboard Busines Design Marketing Diagram Powerpoint Templates. Give Your Thoughts A Distinctive Flavor.
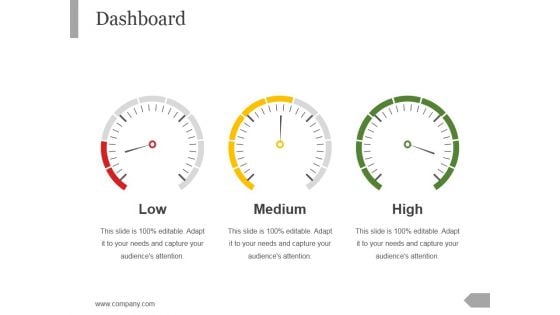
Dashboard Ppt PowerPoint Presentation Layouts Good
This is a dashboard ppt powerpoint presentation layouts good. This is a three stage process. The stages in this process are low, medium, high.
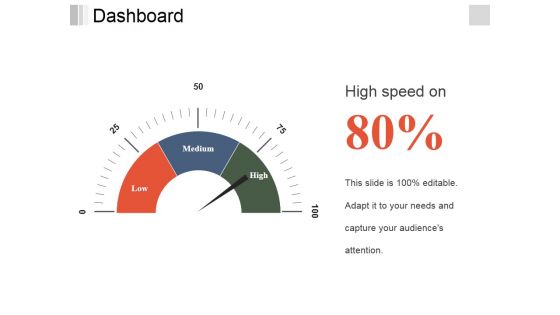
Dashboard Ppt PowerPoint Presentation Layouts Vector
This is a dashboard ppt powerpoint presentation layouts vector. This is a three stage process. The stages in this process are low, medium, high.
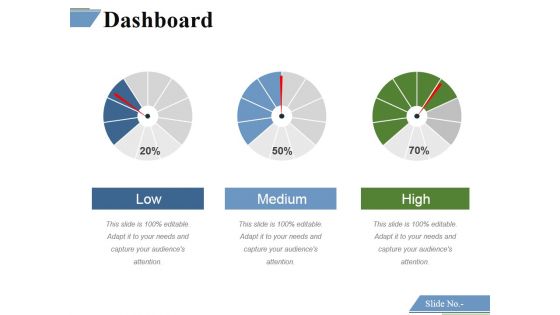
Dashboard Ppt PowerPoint Presentation Portfolio Themes
This is a dashboard ppt powerpoint presentation portfolio themes. This is a three stage process. The stages in this process are low, medium, high.

Dashboard Ppt PowerPoint Presentation Ideas Example Topics
This is a dashboard ppt powerpoint presentation ideas example topics. This is a three stage process. The stages in this process are low, medium, high.
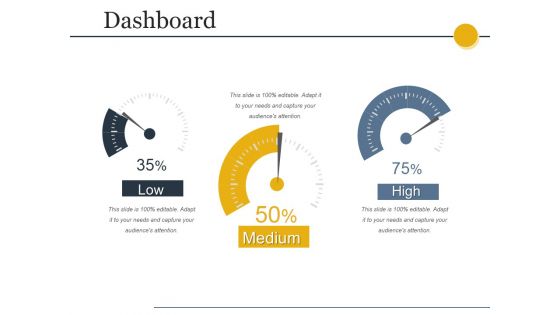
Dashboard Ppt PowerPoint Presentation Professional Smartart
This is a dashboard ppt powerpoint presentation professional smartart. This is a three stage process. The stages in this process are low, medium, high.
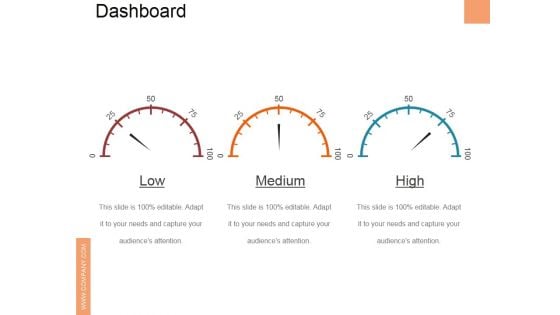
Dashboard Ppt PowerPoint Presentation Gallery Graphics
This is a dashboard ppt powerpoint presentation gallery graphics. This is a three stage process. The stages in this process are low, medium, high.
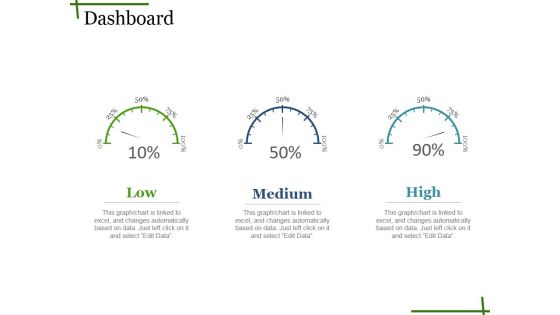
Dashboard Ppt PowerPoint Presentation Layouts Introduction
This is a dashboard ppt powerpoint presentation layouts introduction. This is a three stage process. The stages in this process are low, medium, high.


 Continue with Email

 Home
Home


