key performance indicators

Regional Marketing Strategies Regional Sales Performance Metrics Dashboard Infographics PDF
This slide provides the glimpse about the sales performance metrics which focuses on regional sales based on customer demands and sales team performance. Deliver and pitch your topic in the best possible manner with this regional marketing strategies regional sales performance metrics dashboard infographics pdf. Use them to share invaluable insights on regional sales performance metrics dashboard and impress your audience. This template can be altered and modified as per your expectations. So, grab it now.
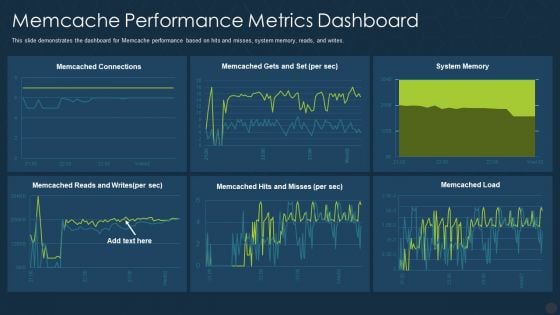
Memcache Performance Metrics Dashboard Ppt Portfolio Aids PDF
This slide demonstrates the dashboard for Memcache performance based on hits and misses, system memory, reads, and writes. Deliver an awe inspiring pitch with this creative memcache performance metrics dashboard ppt portfolio aids pdf bundle. Topics like memcache performance metrics dashboard can be discussed with this completely editable template. It is available for immediate download depending on the needs and requirements of the user.
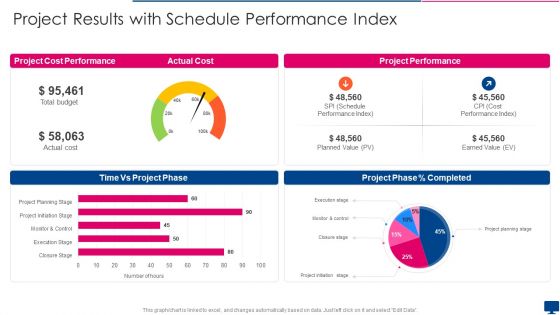
Project Results With Schedule Performance Index Formats PDF
Pitch your topic with ease and precision using this project results with schedule performance index formats pdf. This layout presents information on time, actual cost, project performance. It is also available for immediate download and adjustment. So, changes can be made in the color, design, graphics or any other component to create a unique layout.
Measure Performance And Set Targets Ppt Powerpoint Presentation Gallery Guidelines
This is a measure performance and set targets ppt powerpoint presentation gallery guidelines. This is a three stage process. The stages in this process are business metrics, business kpi, business dashboard.
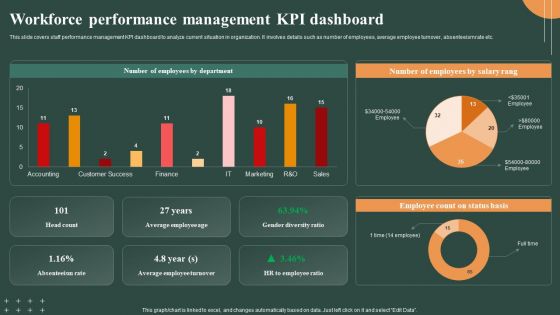
Techniques To Optimize Workforce Performance Management Kpi Dashboard Professional PDF
This slide covers staff performance management KPI dashboard to analyze current situation in organization. It involves details such as number of employees, average employee turnover, absenteeism rate etc. Whether you have daily or monthly meetings, a brilliant presentation is necessary. Techniques To Optimize Workforce Performance Management Kpi Dashboard Professional PDF can be your best option for delivering a presentation. Represent everything in detail using Techniques To Optimize Workforce Performance Management Kpi Dashboard Professional PDF and make yourself stand out in meetings. The template is versatile and follows a structure that will cater to your requirements. All the templates prepared by Slidegeeks are easy to download and edit. Our research experts have taken care of the corporate themes as well. So, give it a try and see the results.
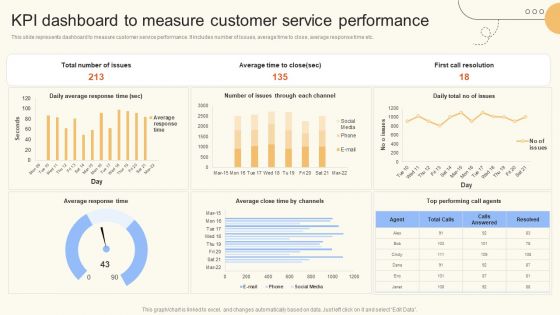
KPI Dashboard To Measure Customer Service Performance Pictures PDF
This slide represents dashboard to measure customer service performance. It includes number of issues, average time to close, average response time etc. Whether you have daily or monthly meetings, a brilliant presentation is necessary. KPI Dashboard To Measure Customer Service Performance Pictures PDF can be your best option for delivering a presentation. Represent everything in detail using KPI Dashboard To Measure Customer Service Performance Pictures PDF and make yourself stand out in meetings. The template is versatile and follows a structure that will cater to your requirements. All the templates prepared by Slidegeeks are easy to download and edit. Our research experts have taken care of the corporate themes as well. So, give it a try and see the results.
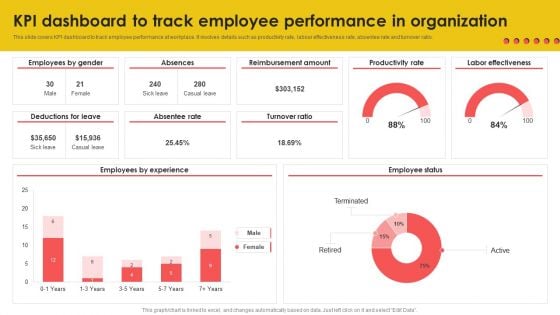
KPI Dashboard To Track Employee Performance In Organization Background PDF
This slide covers KPI dashboard to track employee performance at workplace. It involves details such as productivity rate, labour effectiveness rate, absentee rate and turnover ratio. This KPI Dashboard To Track Employee Performance In Organization Background PDF from Slidegeeks makes it easy to present information on your topic with precision. It provides customization options, so you can make changes to the colors, design, graphics, or any other component to create a unique layout. It is also available for immediate download, so you can begin using it right away. Slidegeeks has done good research to ensure that you have everything you need to make your presentation stand out. Make a name out there for a brilliant performance.
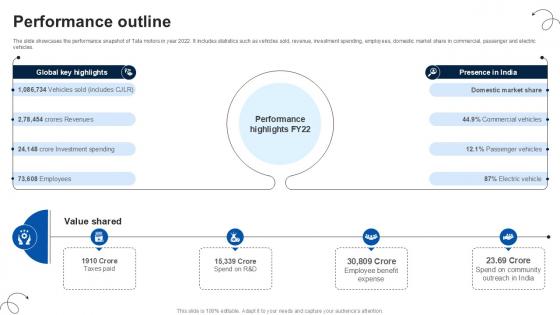
Performance Outline Luxury Automobile Vehicles PPT Template CP SS V
The slide showcases the performance snapshot of Tata motors in year 2022. It includes statistics such as vehicles sold, revenue, investment spending, employees, domestic market share in commercial, passenger and electric vehicles. Find a pre-designed and impeccable Performance Outline Luxury Automobile Vehicles PPT Template CP SS V. The templates can ace your presentation without additional effort. You can download these easy-to-edit presentation templates to make your presentation stand out from others. So, what are you waiting for Download the template from Slidegeeks today and give a unique touch to your presentation. The slide showcases the performance snapshot of Tata motors in year 2022. It includes statistics such as vehicles sold, revenue, investment spending, employees, domestic market share in commercial, passenger and electric vehicles.
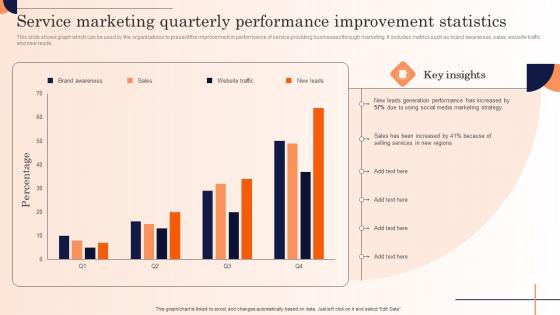
Service Marketing Quarterly Performance Strategic Marketing Campaign Demonstration Pdf
This slide shows graph which can be used by the organizations to present the improvement in performance of service providing businesses through marketing. It includes metrics such as brand awareness, sales, website traffic and new leads.Take your projects to the next level with our ultimate collection of Service Marketing Quarterly Performance Strategic Marketing Campaign Demonstration Pdf. Slidegeeks has designed a range of layouts that are perfect for representing task or activity duration, keeping track of all your deadlines at a glance. Tailor these designs to your exact needs and give them a truly corporate look with your own brand colors they all make your projects stand out from the rest. This slide shows graph which can be used by the organizations to present the improvement in performance of service providing businesses through marketing. It includes metrics such as brand awareness, sales, website traffic and new leads.
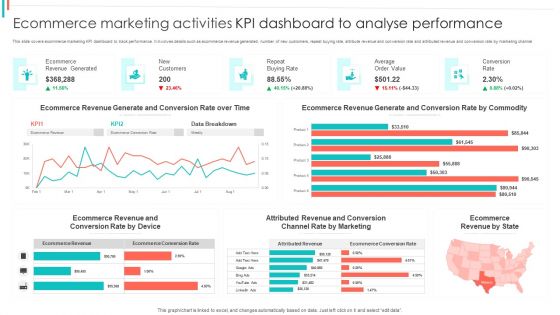
Ecommerce Marketing Activities KPI Dashboard To Analyse Performance Guidelines PDF
This slide covers ecommerce marketing KPI dashboard to track performance. It involves details such as ecommerce revenue generated, number of new customers, repeat buying rate, attribute revenue and conversion rate and attributed revenue and conversion rate by marketing channel.Pitch your topic with ease and precision using this Ecommerce Marketing Activities KPI Dashboard To Analyse Performance Guidelines PDF. This layout presents information on Revenue Generated, Ecommerce Revenue, Generate Conversion. It is also available for immediate download and adjustment. So, changes can be made in the color, design, graphics or any other component to create a unique layout.
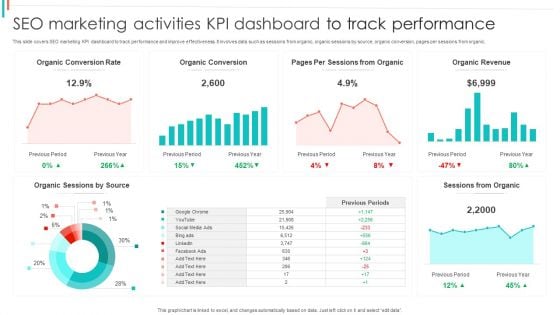
SEO Marketing Activities KPI Dashboard To Track Performance Brochure PDF
This slide covers SEO marketing KPI dashboard to track performance and improve effectiveness. It involves data such as sessions from organic, organic sessions by source, organic conversion, pages per sessions from organic.Pitch your topic with ease and precision using this SEO Marketing Activities KPI Dashboard To Track Performance Brochure PDF. This layout presents information on Organic Conversion, Sessions Organic, Organic Revenue. It is also available for immediate download and adjustment. So, changes can be made in the color, design, graphics or any other component to create a unique layout.
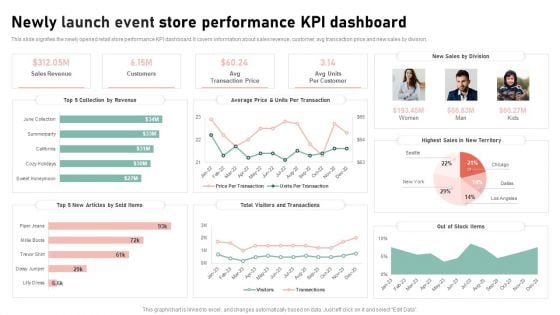
Newly Launch Event Store Performance Kpi Dashboard Elements Sample PDF
This slide signifies the newly opened retail store performance KPI dashboard. It covers information about sales revenue, customer, avg transaction price and new sales by division. Pitch your topic with ease and precision using this Newly Launch Event Store Performance Kpi Dashboard Elements Sample PDF. This layout presents information on Collection By Revenue, Articles By Sold Items, Visitors And Transactions. It is also available for immediate download and adjustment. So, changes can be made in the color, design, graphics or any other component to create a unique layout.
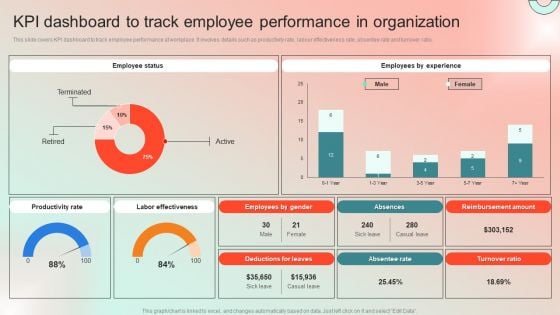
KPI Dashboard To Track Employee Performance In Organization Demonstration PDF
This slide covers KPI dashboard to track employee performance at workplace. It involves details such as productivity rate, labour effectiveness rate, absentee rate and turnover ratio. Take your projects to the next level with our ultimate collection of KPI Dashboard To Track Employee Performance In Organization Demonstration PDF. Slidegeeks has designed a range of layouts that are perfect for representing task or activity duration, keeping track of all your deadlines at a glance. Tailor these designs to your exact needs and give them a truly corporate look with your own brand colors they will make your projects stand out from the rest.
Icons Slide For Company Performance Evaluation Using KPI Topics PDF
Help your business to create an attention-grabbing presentation using our Icons Slide For Company Performance Evaluation Using KPI Topics PDF set of slides. The slide contains innovative icons that can be flexibly edited. Choose this Icons Slide For Company Performance Evaluation Using KPI Topics PDF template to create a satisfactory experience for your customers. Go ahead and click the download button.
B2B Marketing Techniques Email Marketing Campaign Performance Tracking
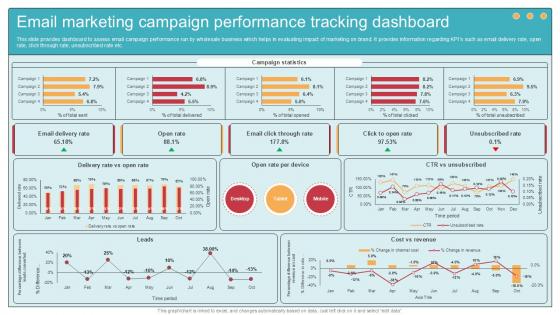
This slide provides dashboard to assess email campaign performance run by wholesale business which helps in evaluating impact of marketing on brand. It provides information regarding KPIs such as email delivery rate, open rate, click through rate, unsubscribed rate etc. Explore a selection of the finest B2B Marketing Techniques Email Marketing Campaign Performance Tracking here. With a plethora of professionally designed and pre-made slide templates, you can quickly and easily find the right one for your upcoming presentation. You can use our B2B Marketing Techniques Email Marketing Campaign Performance Tracking to effectively convey your message to a wider audience. Slidegeeks has done a lot of research before preparing these presentation templates. The content can be personalized and the slides are highly editable. Grab templates today from Slidegeeks. This slide provides dashboard to assess email campaign performance run by wholesale business which helps in evaluating impact of marketing on brand. It provides information regarding KPIs such as email delivery rate, open rate, click through rate, unsubscribed rate etc.
Email Marketing Campaign Performance Comprehensive Guide To Wholesale Ppt Example
This slide provides dashboard to assess email campaign performance run by wholesale business which helps in evaluating impact of marketing on brand. It provides information regarding KPIs such as email delivery rate, open rate, click through rate, unsubscribed rate etc. This Email Marketing Campaign Performance Comprehensive Guide To Wholesale Ppt Example is perfect for any presentation, be it in front of clients or colleagues. It is a versatile and stylish solution for organizing your meetings. The Email Marketing Campaign Performance Comprehensive Guide To Wholesale Ppt Example features a modern design for your presentation meetings. The adjustable and customizable slides provide unlimited possibilities for acing up your presentation. Slidegeeks has done all the homework before launching the product for you. So, do not wait, grab the presentation templates today This slide provides dashboard to assess email campaign performance run by wholesale business which helps in evaluating impact of marketing on brand. It provides information regarding KPIs such as email delivery rate, open rate, click through rate, unsubscribed rate etc.

Call Center Kpis Agent Performance Dashboard Clipart PDF
This slide covers contact center agent performance metrics KPI dashboard. It involves metrics such as number of calls, average response time, average hold time, daily average transfer rate and agents with most hold time and transfer rate. Showcasing this set of slides titled Call Center Kpis Agent Performance Dashboard Clipart PDF. The topics addressed in these templates are Transfer Rate, Call Center, Hold Time. All the content presented in this PPT design is completely editable. Download it and make adjustments in color, background, font etc. as per your unique business setting.
Product Management Project Performance With Workload KPI Dashboard Structure PDF
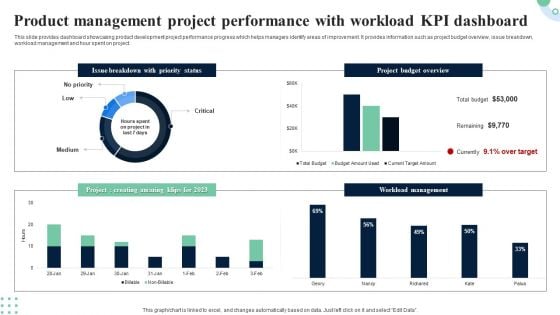
This slide provides dashboard showcasing product development project performance progress which helps managers identify areas of improvement. It provides information such as project budget overview, issue breakdown, workload management and hour spent on project. Pitch your topic with ease and precision using this Product Management Project Performance With Workload KPI Dashboard Structure PDF. This layout presents information on Project Budget Overview, Workload Management. It is also available for immediate download and adjustment. So, changes can be made in the color, design, graphics or any other component to create a unique layout.
Quarterly Overall Business Performance Assessment With Kpi Dashboard Microsoft PDF
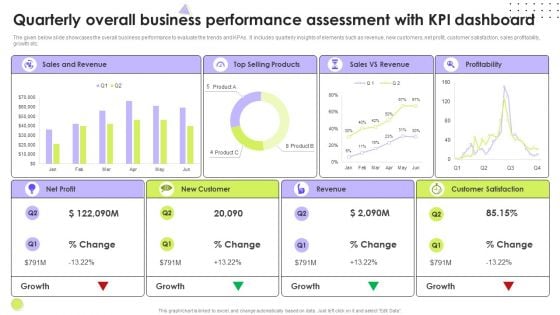
The given below slide showcases the overall business performance to evaluate the trends and KPAs. It includes quarterly insights of elements such as revenue, new customers, net profit, customer satisfaction, sales profitability, growth etc. Pitch your topic with ease and precision using this Quarterly Overall Business Performance Assessment With Kpi Dashboard Microsoft PDF. This layout presents information on Revenue, Customer Satisfaction, Net Profit. It is also available for immediate download and adjustment. So, changes can be made in the color, design, graphics or any other component to create a unique layout.
Marketing Campaign Performance Marketing And Promotion Automation Introduction Pdf
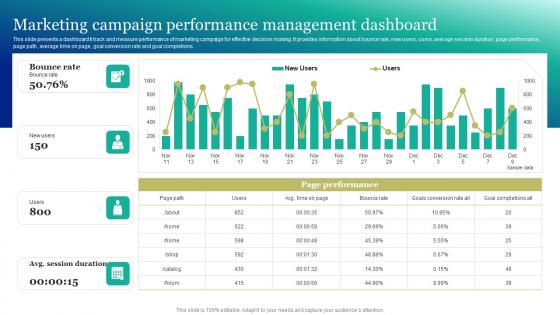
This slide presents a dashboard ti track and measure performance of marketing campaign for effective decision making. It provides information about bounce rate, new users, users, average session duration, page performance, page path, average time on page, goal conversion rate and goal completions. The Marketing Campaign Performance Marketing And Promotion Automation Introduction Pdf is a compilation of the most recent design trends as a series of slides. It is suitable for any subject or industry presentation, containing attractive visuals and photo spots for businesses to clearly express their messages. This template contains a variety of slides for the user to input data, such as structures to contrast two elements, bullet points, and slides for written information. Slidegeeks is prepared to create an impression. This slide presents a dashboard ti track and measure performance of marketing campaign for effective decision making. It provides information about bounce rate, new users, users, average session duration, page performance, page path, average time on page, goal conversion rate and goal completions.
Hyper Automation Performance Tracking Hyper Automation Solutions Rules Pdf
This slide depicts the performance tracking dashboard for hyper-automation, covering the number of rules triggered, automated emails, average originator, recipient, average click-through rate for automated emails, and quick links. Welcome to our selection of the Hyper Automation Performance Tracking Hyper Automation Solutions Rules Pdf. These are designed to help you showcase your creativity and bring your sphere to life. Planning and Innovation are essential for any business that is just starting out. This collection contains the designs that you need for your everyday presentations. All of our PowerPoints are 100 percent editable, so you can customize them to suit your needs. This multi-purpose template can be used in various situations. Grab these presentation templates today This slide depicts the performance tracking dashboard for hyper-automation, covering the number of rules triggered, automated emails, average originator, recipient, average click-through rate for automated emails, and quick links.
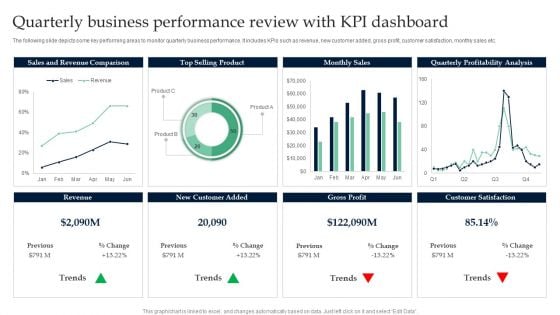
Quarterly Business Performance Review With KPI Dashboard Infographics PDF
Pitch your topic with ease and precision using this Quarterly Business Performance Review With KPI Dashboard Infographics PDF. This layout presents information on Sales And Revenue Comparison, Top Selling Product. It is also available for immediate download and adjustment. So, changes can be made in the color, design, graphics or any other component to create a unique layout.
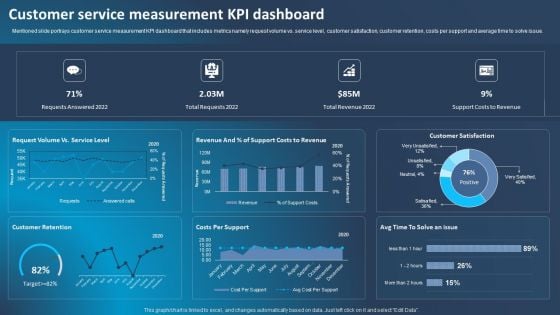
Improving Corporate Performance Customer Service Measurement Kpi Dashboard Microsoft PDF
Mentioned slide portrays customer service measurement KPI dashboard that includes metrics namely request volume vs. service level, customer satisfaction, customer retention, costs per support and average time to solve issue. Do you have to make sure that everyone on your team knows about any specific topic I yes, then you should give Improving Corporate Performance Customer Service Measurement Kpi Dashboard Microsoft PDF a try. Our experts have put a lot of knowledge and effort into creating this impeccable Improving Corporate Performance Customer Service Measurement Kpi Dashboard Microsoft PDF. You can use this template for your upcoming presentations, as the slides are perfect to represent even the tiniest detail. You can download these templates from the Slidegeeks website and these are easy to edit. So grab these today.
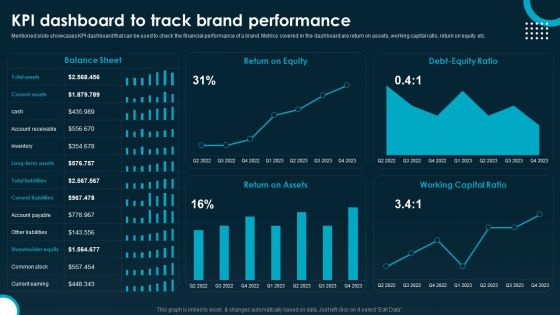
KPI Dashboard To Track Brand Performance Information PDF
Mentioned slide showcases KPI dashboard that can be used to check the financial performance of a brand. Metrics covered in the dashboard are return on assets, working capital ratio, return on equity etc. Do you know about Slidesgeeks KPI Dashboard To Track Brand Performance Information PDF These are perfect for delivering any kind od presentation. Using it, create PowerPoint presentations that communicate your ideas and engage audiences. Save time and effort by using our pre designed presentation templates that are perfect for a wide range of topic. Our vast selection of designs covers a range of styles, from creative to business, and are all highly customizable and easy to edit. Download as a PowerPoint template or use them as Google Slides themes.

Digital Project Management Performance Digital Transformation In Project Management
This slide represents dashboard to analyze progress and health of changes implemented to organizational projects. It includes details related to KPIs such as progress, cost, workload, etc. Whether you have daily or monthly meetings, a brilliant presentation is necessary. Digital Project Management Performance Digital Transformation In Project Management can be your best option for delivering a presentation. Represent everything in detail using Digital Project Management Performance Digital Transformation In Project Management and make yourself stand out in meetings. The template is versatile and follows a structure that will cater to your requirements. All the templates prepared by Slidegeeks are easy to download and edit. Our research experts have taken care of the corporate themes as well. So, give it a try and see the results. This slide represents dashboard to analyze progress and health of changes implemented to organizational projects. It includes details related to KPIs such as progress, cost, workload, etc.
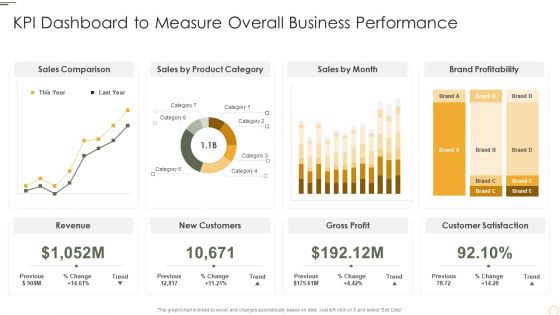
KPI Dashboard To Measure Overall Business Performance Themes PDF
Deliver and pitch your topic in the best possible manner with this KPI Dashboard To Measure Overall Business Performance Themes PDF. Use them to share invaluable insights on Sales Comparison, Product Category, Brand Profitability and impress your audience. This template can be altered and modified as per your expectations. So, grab it now.
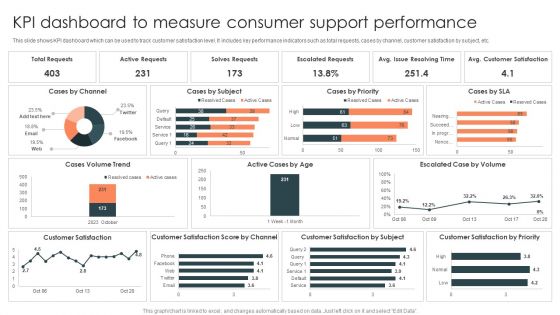
KPI Dashboard To Measure Consumer Support Performance Designs PDF
Showcasing this set of slides titled KPI Dashboard To Measure Consumer Support Performance Designs PDF. The topics addressed in these templates are Active Requests, Solves Requests, Escalated Requests. All the content presented in this PPT design is completely editable. Download it and make adjustments in color, background, font etc. as per your unique business setting.
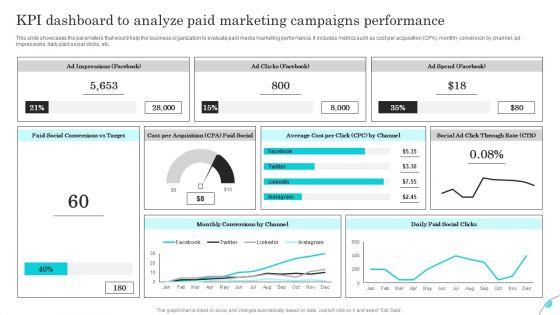
KPI Dashboard To Analyze Paid Marketing Campaigns Performance Background PDF
This slide showcases the parameters that would help the business organization to evaluate paid media marketing performance. It includes metrics such as cost per acquisition CPA, monthly conversion by channel, ad impressions, daily paid social clicks, etc. Present like a pro with KPI Dashboard To Analyze Paid Marketing Campaigns Performance Background PDF Create beautiful presentations together with your team, using our easy to use presentation slides. Share your ideas in real time and make changes on the fly by downloading our templates. So whether you are in the office, on the go, or in a remote location, you can stay in sync with your team and present your ideas with confidence. With Slidegeeks presentation got a whole lot easier. Grab these presentations today.
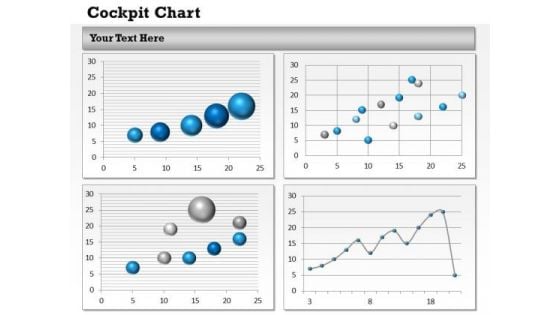
Business Diagram Performance Dashboards For Business Strategic Management
Be The Doer With Our Business Diagram Performance Dashboards For Business Strategic Management Powerpoint Templates. Put Your Thoughts Into Practice.
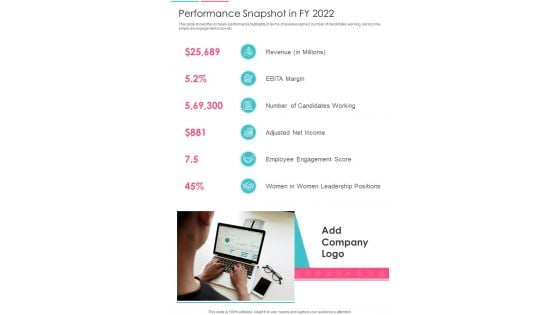
Performance Snapshot In FY 2022 One Pager Documents
This slide shows the company performance highlights in terms of revenue earned, number of candidates working, net income, employee engagement score etc. Presenting you an exemplary Performance Snapshot In FY 2022 One Pager Documents. Our one-pager comprises all the must-have essentials of an inclusive document. You can edit it with ease, as its layout is completely editable. With such freedom, you can tweak its design and other elements to your requirements. Download this Performance Snapshot In FY 2022 One Pager Documents brilliant piece now.
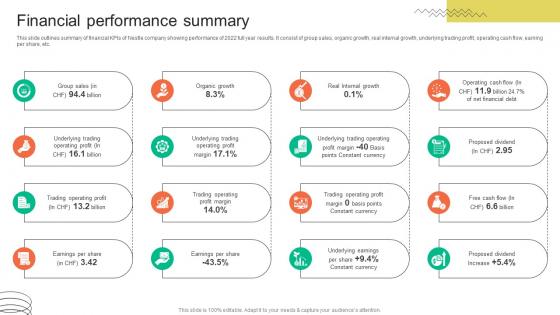
Financial Performance Summary FMCG Provider Company Profile CP SS V
This slide outlines summary of financial KPIs of Nestle company showing performance of 2022 full year results. It consist of group sales, organic growth, real internal growth, underlying trading profit, operating cash flow, earning per share, etc. Find highly impressive Financial Performance Summary FMCG Provider Company Profile CP SS V on Slidegeeks to deliver a meaningful presentation. You can save an ample amount of time using these presentation templates. No need to worry to prepare everything from scratch because Slidegeeks experts have already done a huge research and work for you. You need to download Financial Performance Summary FMCG Provider Company Profile CP SS V for your upcoming presentation. All the presentation templates are 100 percent editable and you can change the color and personalize the content accordingly. Download now This slide outlines summary of financial KPIs of Nestle company showing performance of 2022 full year results. It consist of group sales, organic growth, real internal growth, underlying trading profit, operating cash flow, earning per share, etc.
Performance Dashboard Template 1 Ppt PowerPoint Presentation Icon Guidelines
This is a performance dashboard template 1 ppt powerpoint presentation icon guidelines. This is a one stage process. The stages in this process are performance dashboard, business, marketing, management.
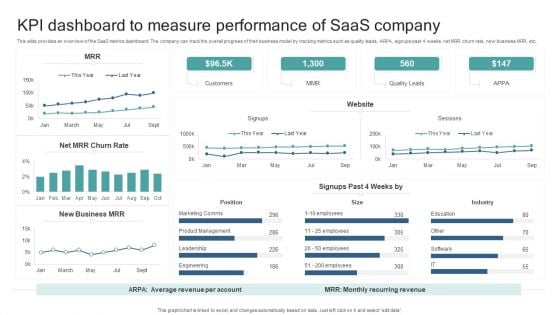
KPI Dashboard To Measure Performance Of Saas Company Introduction PDF
This slide provides an overview of the SaaS metrics dashboard. The company can track the overall progress of their business model by tracking metrics such as quality leads, ARPA, signups past 4 weeks, net MRR churn rate, new business MRR, etc. Pitch your topic with ease and precision using this KPI Dashboard To Measure Performance Of Saas Company Introduction PDF. This layout presents information on Industry, Position, Customers, Quality Leads. It is also available for immediate download and adjustment. So, changes can be made in the color, design, graphics or any other component to create a unique layout.
Improving PPC Campaign Results Develop Campaign Performance Tracking Infographics Pdf
The following slide depicts campaign performance management dashboard to measure the results. It includes elements such as conversions funnel, conversion rates, opportunity value, landing pages, sources google, twitter, Facebook etc. If you are looking for a format to display your unique thoughts, then the professionally designed Improving PPC Campaign Results Develop Campaign Performance Tracking Infographics Pdf is the one for you. You can use it as a Google Slides template or a PowerPoint template. Incorporate impressive visuals, symbols, images, and other charts. Modify or reorganize the text boxes as you desire. Experiment with shade schemes and font pairings. Alter, share or cooperate with other people on your work. Download Improving PPC Campaign Results Develop Campaign Performance Tracking Infographics Pdf and find out how to give a successful presentation. Present a perfect display to your team and make your presentation unforgettable. The following slide depicts campaign performance management dashboard to measure the results. It includes elements such as conversions funnel, conversion rates, opportunity value, landing pages, sources google, twitter, Facebook etc.
Dashboard Icon For Marketing Communication Kpis Performance Assessment Summary PDF
Presenting Dashboard Icon For Marketing Communication Kpis Performance Assessment Summary PDF to dispense important information. This template comprises four stages. It also presents valuable insights into the topics including Dashboard Icon, Marketing Communication, Kpis Performance, Assessment. This is a completely customizable PowerPoint theme that can be put to use immediately. So, download it and address the topic impactfully.

Engineering Performance Metrics Dashboard To Track Pull Requests Background PDF
This slide covers engineering KPI dashboard to track pull request. It involves KPIs such as open time of average pull requests, average comment received, revision rounds, frequency of posting pull requests. Pitch your topic with ease and precision using this Engineering Performance Metrics Dashboard To Track Pull Requests Background PDF. This layout presents information on Dashboard Track Pull Requests, Engineering Performance Metrics. It is also available for immediate download and adjustment. So, changes can be made in the color, design, graphics or any other component to create a unique layout.

Media Kpi Performance Evaluation Ppt PowerPoint Presentation Visual Aids
This is a media kpi performance evaluation ppt powerpoint presentation visual aids. This is a three stage process. The stages in this process are traffic, enagagement, conversion, website visitors, purchases, installs, sign ups.
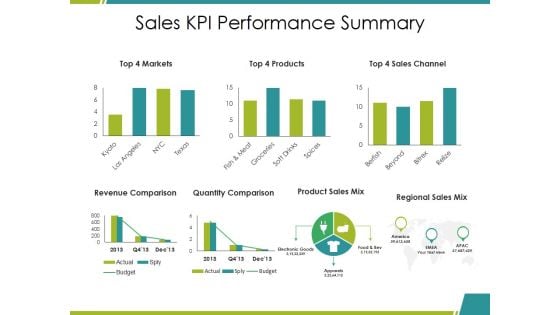
Sales Kpi Performance Summary Ppt PowerPoint Presentation Infographic Template Elements
This is a sales kpi performance summary ppt powerpoint presentation infographic template elements. This is a seven stage process. The stages in this process are revenue comparison, quantity comparison, product sales mix, regional sales mix, budget.
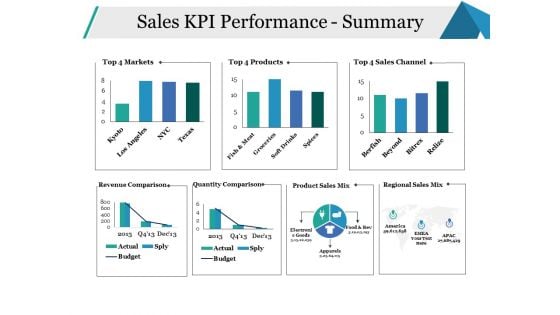
Sales KPI Performance Summary Ppt PowerPoint Presentation Infographics Model
This is a sales kpi performance summary ppt powerpoint presentation infographics model. This is a seven stage process. The stages in this process are sales channel, revenue comparison, quantity comparison, business, marketing.

Sales Kpi Performance Summary Ppt PowerPoint Presentation Infographic Template Infographics
This is a sales kpi performance summary ppt powerpoint presentation infographic template infographics. This is a seven stage process. The stages in this process are revenue comparison, quantity comparison, product sales mix, regional sales mix.

Sales Kpi Performance Summary Ppt PowerPoint Presentation Ideas Graphics Template
This is a sales kpi performance summary ppt powerpoint presentation ideas graphics template. This is a seven stage process. The stages in this process are revenue comparison, quantity comparison, product sales mix, regional sales mix.
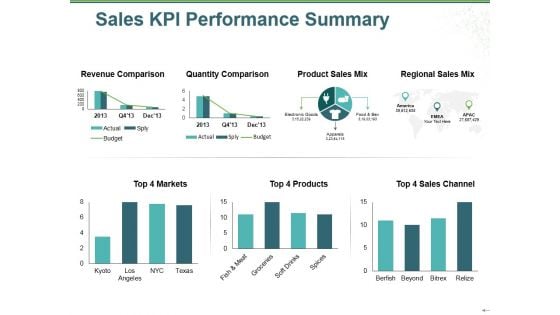
Sales Kpi Performance Summary Ppt PowerPoint Presentation Show Inspiration
This is a sales kpi performance summary ppt powerpoint presentation show inspiration. This is a two stage process. The stages in this process are revenue comparison, quantity comparison, product sales mix, regional sales mix, budget.

Sales Kpi Performance Summary Ppt PowerPoint Presentation Show Themes
This is a sales kpi performance summary ppt powerpoint presentation show themes. This is a three stage process. The stages in this process are revenue comparison, quantity comparison, product sales mix, markets, sales channel.

Employee Performance Measurement Kpi Ppt PowerPoint Presentation Inspiration Design Inspiration
This is a employee performance measurement kpi ppt powerpoint presentation inspiration design inspiration. This is a four stage process. The stages in this process are financial, business, management, marketing.
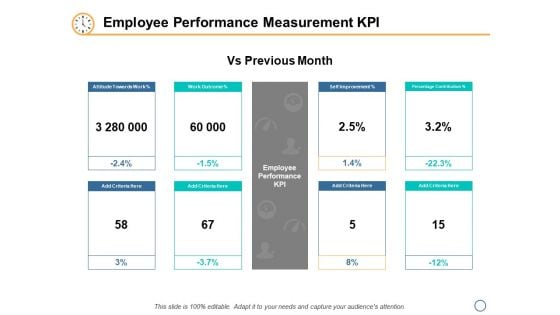
Employee Performance Measurement KPI Ppt PowerPoint Presentation Inspiration Influencers
This is a employee performance measurement kpi ppt powerpoint presentation inspiration influencers. This is a eight stage process. The stages in this process are finance, analysis, business, investment, marketing.
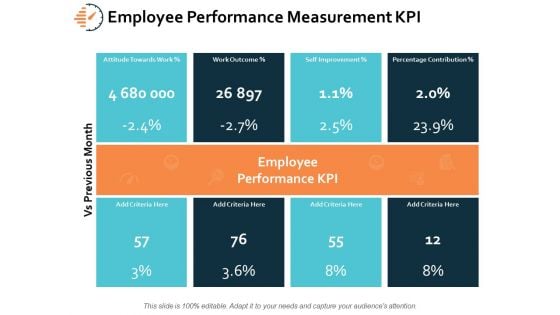
Employee Performance Measurement KPI Ppt PowerPoint Presentation Ideas Mockup
This is a employee performance measurement kpi ppt powerpoint presentation ideas mockup. This is a eight stage process. The stages in this process are finance, analysis, business, investment, marketing.
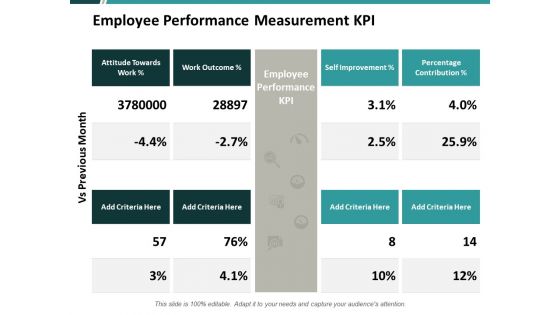
Employee Performance Measurement Kpi Ppt PowerPoint Presentation Slides Maker
This is a employee performance measurement kpi ppt powerpoint presentation slides maker. This is a two stage process. The stages in this process are marketing, business, management, planning, strategy.
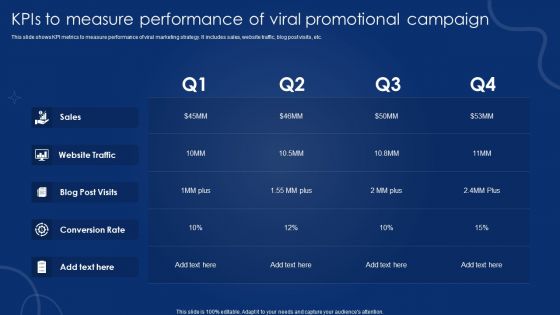
Kpis To Measure Performance Of Viral Promotional Campaign Topics PDF
This slide shows KPI metrics to measure performance of viral marketing strategy. It includes sales, website traffic, blog post visits, etc. Showcasing this set of slides titled Kpis To Measure Performance Of Viral Promotional Campaign Topics PDF. The topics addressed in these templates are Website Traffic, Sales, Blog Post Visits, Conversion Rate. All the content presented in this PPT design is completely editable. Download it and make adjustments in color, background, font etc. as per your unique business setting.
Performance Kpi Dashboard For Project Tracking And Control Pictures PDF
This slide covers project monitoring and control dashboard which can be used by PM. It provides information about metrics such as project health, actual budget, at risk project, start and finish date of the project. Showcasing this set of slides titled Performance Kpi Dashboard For Project Tracking And Control Pictures PDF. The topics addressed in these templates are Finance, Customer Support, Business Development. All the content presented in this PPT design is completely editable. Download it and make adjustments in color, background, font etc. as per your unique business setting.
Performance Evaluation KPI Dashboard For 360 Degree Review Icons PDF
This slide covers 360 degree employee feedback dashboard. It includes metrics such as highest rated area, lowest rated area, potential blind spots, peer ratings, self rating, gap analysis, etc. Showcasing this set of slides titled Performance Evaluation KPI Dashboard For 360 Degree Review Icons PDF. The topics addressed in these templates are Highest Rated, Lowest Areas, Potential Spots. All the content presented in this PPT design is completely editable. Download it and make adjustments in color, background, font etc. as per your unique business setting.
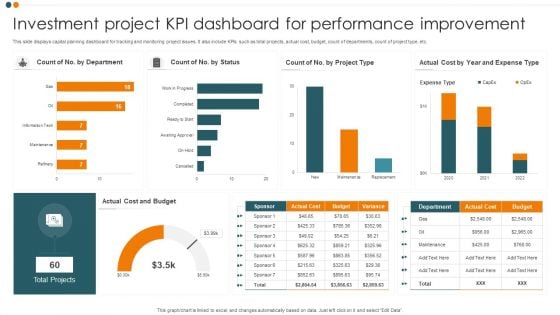
Investment Project KPI Dashboard For Performance Improvement Guidelines PDF
This slide displays capital planning dashboard for tracking and monitoring project issues. It also include KPIs such as total projects, actual cost, budget, count of departments, count of project type, etc. Pitch your topic with ease and precision using this Investment Project KPI Dashboard For Performance Improvement Guidelines PDF. This layout presents information on Cost And Budget, Total Projects, Expense Type. It is also available for immediate download and adjustment. So, changes can be made in the color, design, graphics or any other component to create a unique layout.
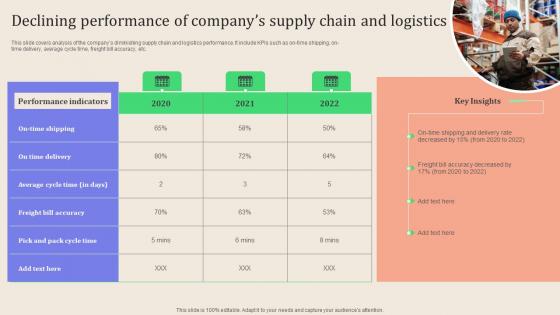
Leveraging Logistics Automation Declining Performance Of Companys Ideas Pdf
This slide covers analysis of the companys diminishing supply chain and logistics performance. It include KPIs such as on time shipping, on time delivery, average cycle time, freight bill accuracy, etc.If your project calls for a presentation, then Slidegeeks is your go to partner because we have professionally designed, easy to edit templates that are perfect for any presentation. After downloading, you can easily edit Leveraging Logistics Automation Declining Performance Of Companys Ideas Pdf and make the changes accordingly. You can rearrange slides or fill them with different images. Check out all the handy templates This slide covers analysis of the companys diminishing supply chain and logistics performance. It include KPIs such as on time shipping, on time delivery, average cycle time, freight bill accuracy, etc.
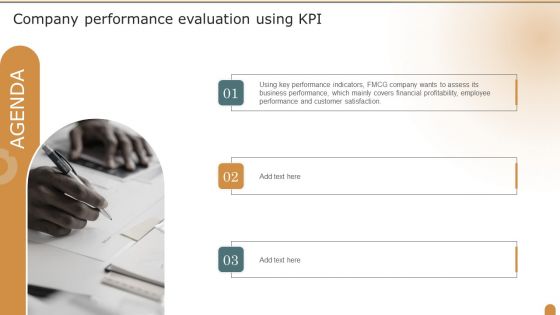
Agenda Company Performance Evaluation Using KPI Designs PDF
This is a Agenda Company Performance Evaluation Using KPI Designs PDF template with various stages. Focus and dispense information on three stages using this creative set, that comes with editable features. It contains large content boxes to add your information on topics like Company Performance, Evaluation Using KPI, Customer Satisfaction. You can also showcase facts, figures, and other relevant content using this PPT layout. Grab it now.
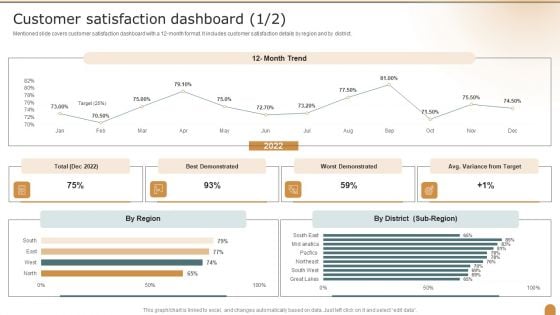
Customer Satisfaction Dashboard Company Performance Evaluation Using KPI Graphics PDF
Mentioned slide covers customer satisfaction dashboard with a 12 month format. It includes customer satisfaction details by region and by district. Deliver an awe inspiring pitch with this creative Customer Satisfaction Dashboard Company Performance Evaluation Using KPI Graphics PDF bundle. Topics like Customer Satisfaction, Dashboard, Best Demonstrated can be discussed with this completely editable template. It is available for immediate download depending on the needs and requirements of the user.
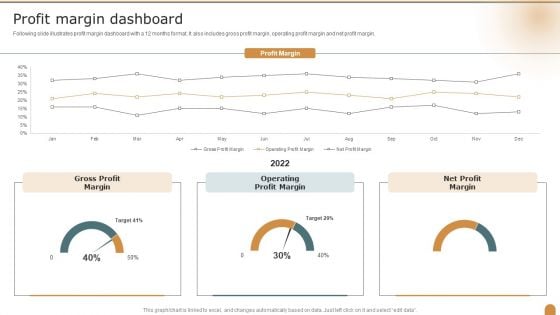
Profit Margin Dashboard Company Performance Evaluation Using KPI Elements PDF
Following slide illustrates profit margin dashboard with a 12 months format. It also includes gross profit margin, operating profit margin and net profit margin. Deliver and pitch your topic in the best possible manner with this Profit Margin Dashboard Company Performance Evaluation Using KPI Elements PDF. Use them to share invaluable insights on Gross Profit Margin, Operating Profit Margin, Net Profit Margin and impress your audience. This template can be altered and modified as per your expectations. So, grab it now.

Weekly Sales Performance KPI Dashboard For Revenue Generation Brochure PDF
The following slide exhibits dashboard to maintain revenue and management under control. It presents information related to profits, cross selling, costs, etc. Pitch your topic with ease and precision using this Weekly Sales Performance KPI Dashboard For Revenue Generation Brochure PDF. This layout presents information on Total Sales, Revenue, Profit, Cost. It is also available for immediate download and adjustment. So, changes can be made in the color, design, graphics or any other component to create a unique layout.
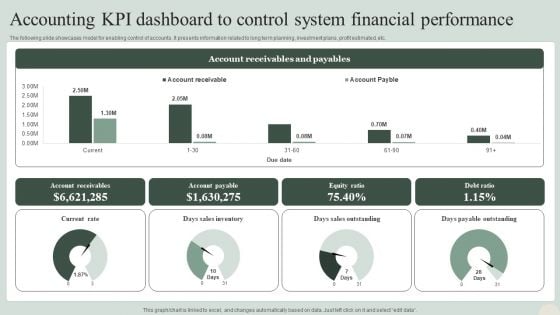
Accounting KPI Dashboard To Control System Financial Performance Formats PDF
The following slide showcases model for enabling control of accounts. It presents information related to long term planning, investment plans, profit estimated, etc. Pitch your topic with ease and precision using this Accounting KPI Dashboard To Control System Financial Performance Formats PDF. This layout presents information on Sales Outstanding, Payable Outstanding, Sales Inventory. It is also available for immediate download and adjustment. So, changes can be made in the color, design, graphics or any other component to create a unique layout.
Workforce Performance Measurement Meter Icon Ppt Portfolio Layouts PDF
Presenting Workforce Performance Measurement Meter Icon Ppt Portfolio Layouts PDF to dispense important information. This template comprises one stages. It also presents valuable insights into the topics including Workforce, Performance Measurement, Meter Icon. This is a completely customizable PowerPoint theme that can be put to use immediately. So, download it and address the topic impactfully.
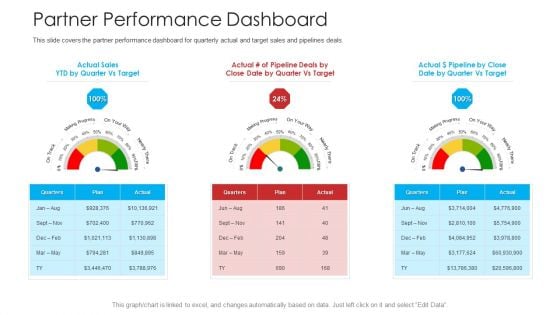
Retailer Channel Partner Boot Camp Partner Performance Dashboard Sample PDF
This slide covers the partner performance dashboard for quarterly actual and target sales and pipelines deals. Presenting retailer channel partner boot camp partner performance dashboard sample pdf to provide visual cues and insights. Share and navigate important information on three stages that need your due attention. This template can be used to pitch topics like performance dashboard, target sales, marketing progress. In addition, this PPT design contains high-resolution images, graphics, etc, that are easily editable and available for immediate download.
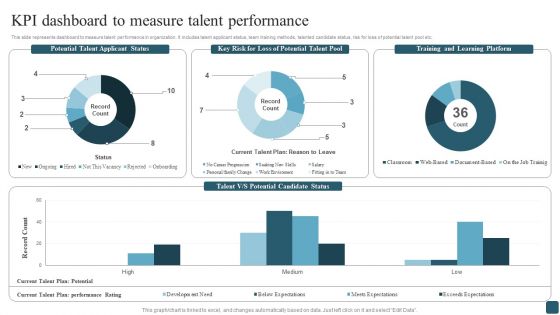
Kpi Dashboard To Measure Talent Performance Brochure PDF
This slide represents dashboard to measure talent performance in organization. It includes talent applicant status, team training methods, talented candidate status, risk for loss of potential talent pool etc. Are you in need of a template that can accommodate all of your creative concepts This one is crafted professionally and can be altered to fit any style. Use it with Google Slides or PowerPoint. Include striking photographs, symbols, depictions, and other visuals. Fill, move around, or remove text boxes as desired. Test out color palettes and font mixtures. Edit and save your work, or work with colleagues. Download Kpi Dashboard To Measure Talent Performance Brochure PDF and observe how to make your presentation outstanding. Give an impeccable presentation to your group and make your presentation unforgettable.


 Continue with Email

 Home
Home


