kpi dashboard
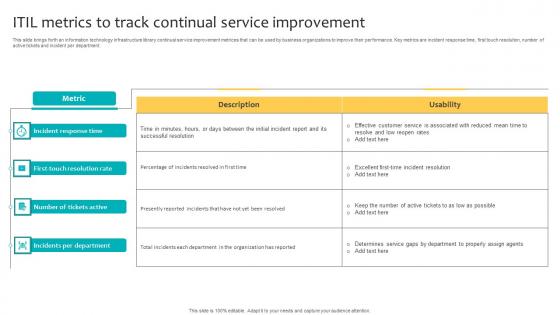
ITIL Metrics To Track Continual Service Improvement Infographics Pdf
This slide brings forth an information technology infrastructure library continual service improvement metrices that can be used by business organizations to improve their performance. Key metrics are incident response time, first touch resolution, number of active tickets and incident per department. Pitch your topic with ease and precision using this ITIL Metrics To Track Continual Service Improvement Infographics Pdf. This layout presents information on Incident Response Time, Number Of Tickets Active, Incidents Per Department. It is also available for immediate download and adjustment. So, changes can be made in the color, design, graphics or any other component to create a unique layout. This slide brings forth an information technology infrastructure library continual service improvement metrices that can be used by business organizations to improve their performance. Key metrics are incident response time, first touch resolution, number of active tickets and incident per department.
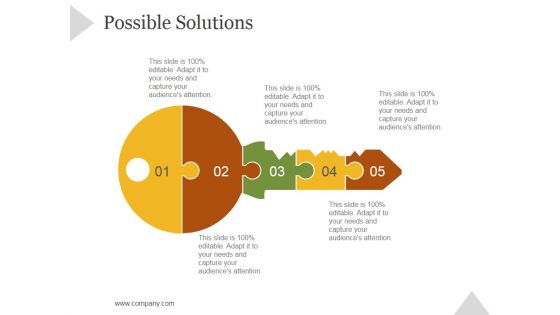
Possible Solutions Ppt PowerPoint Presentation Portfolio
This is a possible solutions ppt powerpoint presentation portfolio. This is a five stage process. The stages in this process are business, strategy, marketing, success, puzzle, key lock.
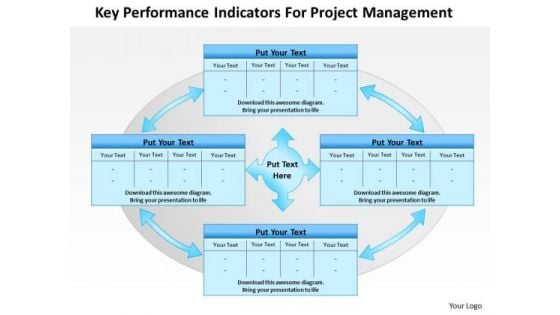
Business Framework Key Performance Indicators For Project Management PowerPoint Presentation
Our above diagram provides framework of key performance indicators for project management. It contains four interconnected text boxes. Download this diagram to make professional presentations on project management. This diagram enables the users to create their own display of the required processes in an easy way.

Customer Satisfaction Framework Ppt Slide
This is a customer satisfaction framework ppt slide. This is a seven stage process. The stages in this process are task items, item.
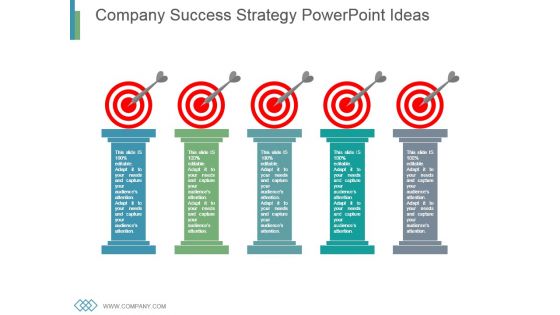
Company Success Strategy Powerpoint Ideas
This is a company success strategy powerpoint ideas. This is a five stage process. The stages in this process are business, marketing, success, strategy, target.
Company Accounts Planning Strategy Powerpoint Guide
This is a company accounts planning strategy powerpoint guide. This is a four stage process. The stages in this process are goal, target, planning, strategy, company.
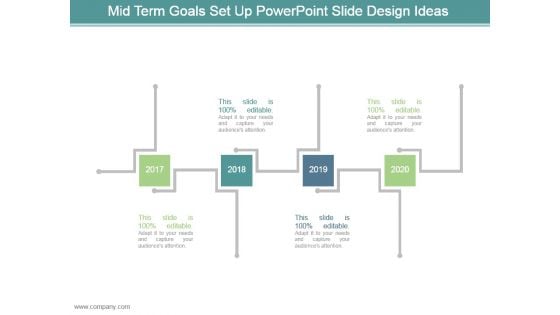
Mid Term Goals Set Up Powerpoint Slide Design Ideas
This is a mid term goals set up powerpoint slide design ideas. This is a four stage process. The stages in this process are arrows, business, marketing, planning, years.

Setting Short Term Goals Powerpoint Slide Graphics
This is a setting short term goals powerpoint slide graphics. This is a five stage process. The stages in this process are february, january, march, may, april.
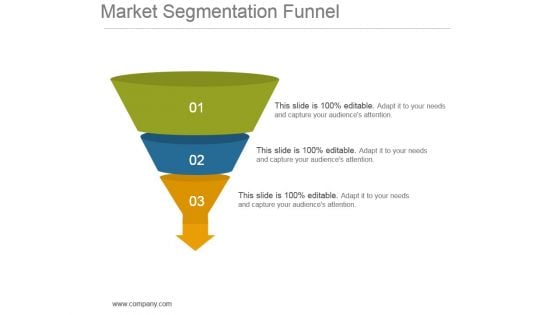
Market Segmentation Funnel Example Of Ppt Presentation
This is a market segmentation funnel example of ppt presentation. This is a three stage process. The stages in this process are funnel, business, filter, marketing, arrow.
Bulb Design For Creative Thinking Process Powerpoint Ideas
This is a bulb design for creative thinking process powerpoint ideas. This is a five stage process. The stages in this process are idea bulls, security, business, strategy, success.
4 Steps Agenda To Achieve Company Goals Ppt PowerPoint Presentation Inspiration
This is a 4 steps agenda to achieve company goals ppt powerpoint presentation inspiration. This is a four stage process. The stages in this process are business, agenda, strategy, analysis, success.
6 Point Goal For Company Management Ppt PowerPoint Presentation Slide
This is a 6 point goal for company management ppt powerpoint presentation slide. This is a six stage process. The stages in this process are agenda, business, strategy, icons, hexagon, marketing.

Real Estate Outlook Ppt PowerPoint Presentation Layout
This is a real estate outlook ppt powerpoint presentation layout. This is a one stage process. The stages in this process are business, marketing, management, real estate, innovation.

Customer Satisfaction Template Ppt PowerPoint Presentation Show Introduction
This is a customer satisfaction template ppt powerpoint presentation show introduction. This is a three stage process. The stages in this process are overall satisfaction with service, satisfaction with value for money, overall satisfaction with relationship.
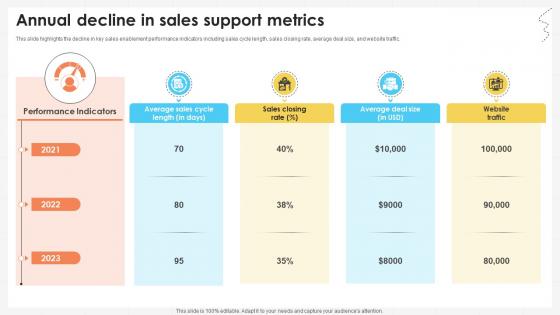
Business Development Team Annual Decline In Sales Support Metrics SA SS V
This slide highlights the decline in key sales enablement performance indicators including sales cycle length, sales closing rate, average deal size, and website traffic. Create an editable Business Development Team Annual Decline In Sales Support Metrics SA SS V that communicates your idea and engages your audience. Whether you are presenting a business or an educational presentation, pre-designed presentation templates help save time. Business Development Team Annual Decline In Sales Support Metrics SA SS V is highly customizable and very easy to edit, covering many different styles from creative to business presentations. Slidegeeks has creative team members who have crafted amazing templates. So, go and get them without any delay. This slide highlights the decline in key sales enablement performance indicators including sales cycle length, sales closing rate, average deal size, and website traffic.
Program Metrics Powerpoint Ppt Template Bundles
Increase your chances of writing a winning business proposal and grabbing your prospects attention with this well-crafted, innovative Program Metrics Powerpoint Ppt Template Bundles. This Business Program Continuity, Program Management, Supplier Performance Evaluation-slide presentation template comes with in-built content to help you outline a presentation that can serve as an industry benchmark. The complete deck also makes use of an impressive color scheme to create a visual impact and hook the audience. Use this PPT to plan how your business can be the Numero uno in its segment within no time at all. Download now to showcase your brand USP and offerings to engage your client. Our Program Metrics PowerPoint Template Bundles are thoughtfully crafted to offer a visually appealing background for any topic, helping you deliver a professional presentation.
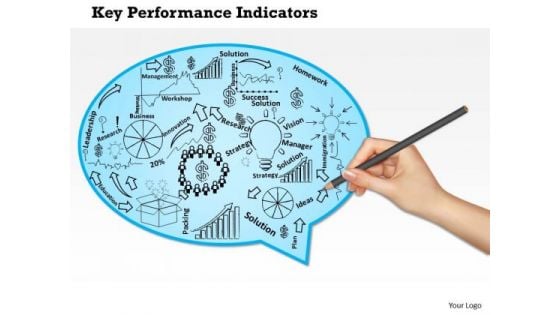
Business Framework Key Performance Indicators Of A Company PowerPoint Presentation
Our above diagram provides framework of key performance indicators for a company. This slide contains human hand drawing some objects for terms like innovation strategy, research, solution, management and leadership. Download this diagram to make professional presentations.
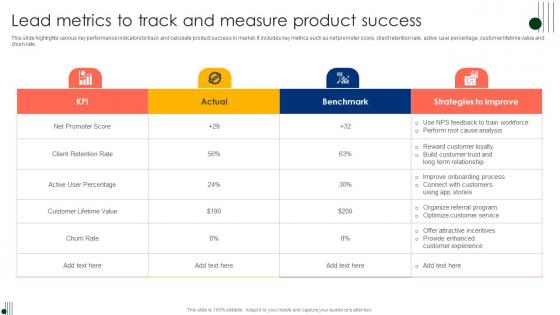
Lead Metrics To Track And Measure Product Success Ppt Visual Aids Ideas Pdf
This slide highlights various key performance indicators to track and calculate product success in market. It includes key metrics such as net promoter score, client retention rate, active user percentage, customer lifetime value and churn rate. Showcasing this set of slides titled Lead Metrics To Track And Measure Product Success Ppt Visual Aids Ideas Pdf. The topics addressed in these templates are Client Retention Rate, Active User Percentage, Customer Lifetime. All the content presented in this PPT design is completely editable. Download it and make adjustments in color, background, font etc. as per your unique business setting. This slide highlights various key performance indicators to track and calculate product success in market. It includes key metrics such as net promoter score, client retention rate, active user percentage, customer lifetime value and churn rate.
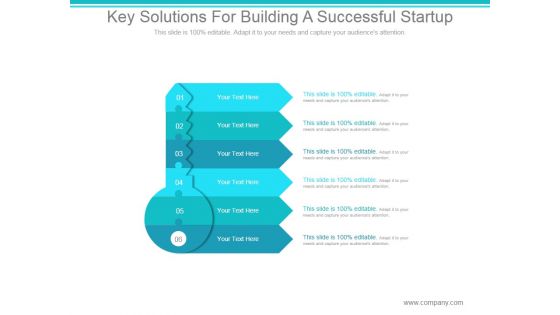
Key Solutions For Building A Successful Startup Ppt PowerPoint Presentation Infographics
This is a key solutions for building a successful startup ppt powerpoint presentation infographics. This is a six stage process. The stages in this process are key, arrows, security, business, marketing.
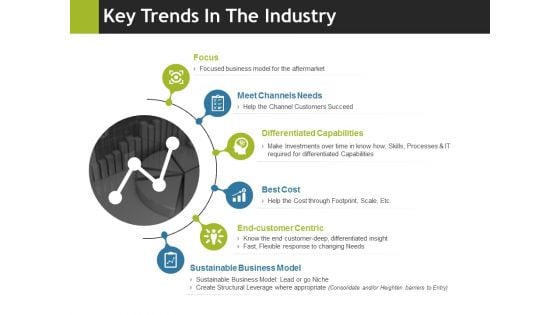
Key Trends In The Industry Ppt PowerPoint Presentation Professional Backgrounds
This is a key trends in the industry ppt powerpoint presentation professional backgrounds. This is a six stage process. The stages in this process are focus, meet channels needs, differentiated capabilities, best cost, end customer centric.
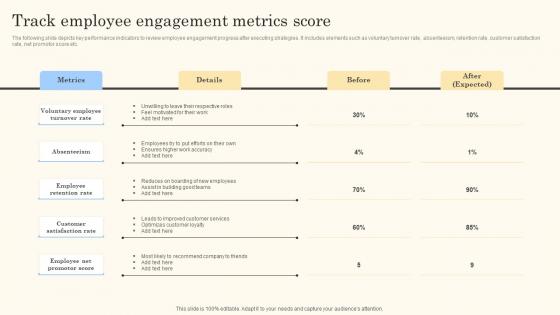
Track Employee Engagement Metrics Score Action Steps For Employee Engagement Slides Pdf
The following slide depicts key performance indicators to review employee engagement progress after executing strategies. It includes elements such as voluntary turnover rate, absenteeism, retention rate, customer satisfaction rate, net promotor score etc.Make sure to capture your audiences attention in your business displays with our gratis customizable Track Employee Engagement Metrics Score Action Steps For Employee Engagement Slides Pdf. These are great for business strategies, office conferences, capital raising or task suggestions. If you desire to acquire more customers for your tech business and ensure they stay satisfied, create your own sales presentation with these plain slides. The following slide depicts key performance indicators to review employee engagement progress after executing strategies. It includes elements such as voluntary turnover rate, absenteeism, retention rate, customer satisfaction rate, net promotor score etc.
Employee Key Performance Indicators Performance Indicators Report Icon Structure PDF
Showcasing this set of slides titled Employee Key Performance Indicators Performance Indicators Report Icon Structure PDF The topics addressed in these templates are Employee Key, Performance, Indicators Performance All the content presented in this PPT design is completely editable. Download it and make adjustments in color, background, font etc. as per your unique business setting.
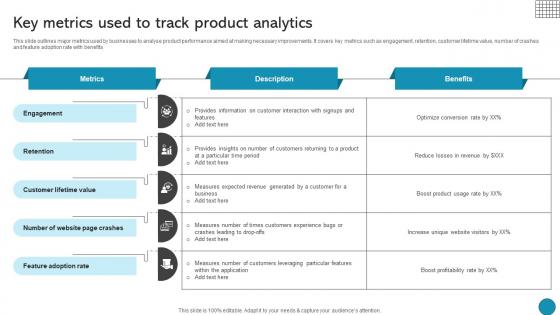
Key Metrics Used To Track Product Analytics Driving Business Success Integrating Product
This slide outlines major metrics used by businesses to analyse product performance aimed at making necessary improvements. It covers key metrics such as engagement, retention, customer lifetime value, number of crashes and feature adoption rate with benefits Find a pre-designed and impeccable Key Metrics Used To Track Product Analytics Driving Business Success Integrating Product. The templates can ace your presentation without additional effort. You can download these easy-to-edit presentation templates to make your presentation stand out from others. So, what are you waiting for Download the template from Slidegeeks today and give a unique touch to your presentation. This slide outlines major metrics used by businesses to analyse product performance aimed at making necessary improvements. It covers key metrics such as engagement, retention, customer lifetime value, number of crashes and feature adoption rate with benefits
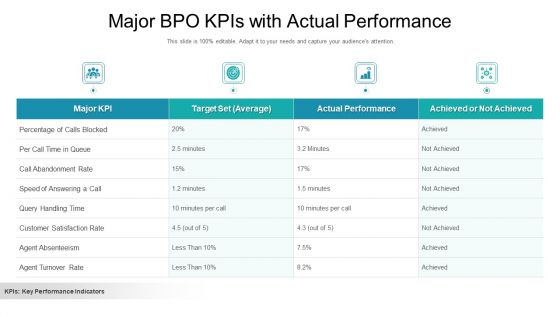
Major BPO Kpis With Actual Performance Ppt Inspiration Infographic Template PDF
Showcasing this set of slides titled major bpo kpis with actual performance ppt inspiration infographic template pdf. The topics addressed in these templates are target, actual performance, major kpi. All the content presented in this PPT design is completely editable. Download it and make adjustments in color, background, font etc. as per your unique business setting.
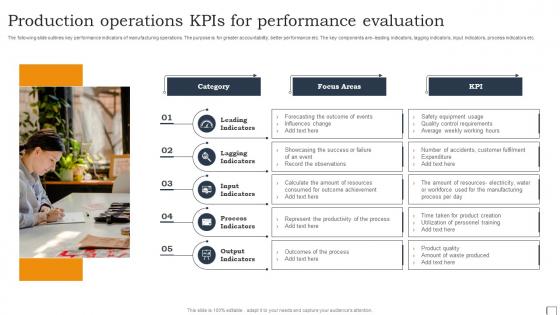
Production Operations KPIs For Performance Evaluation Structure Pdf
The following slide outlines key performance indicators of manufacturing operations. The purpose is for greater accountability, better performance etc. The key components are- leading indicators, lagging indicators, input indicators, process indicators etc. Pitch your topic with ease and precision using this Production Operations KPIs For Performance Evaluation Structure Pdf. This layout presents information on Leading Indicators, Lagging Indicators, Input Indicators. It is also available for immediate download and adjustment. So, changes can be made in the color, design, graphics or any other component to create a unique layout. The following slide outlines key performance indicators of manufacturing operations. The purpose is for greater accountability, better performance etc. The key components are- leading indicators, lagging indicators, input indicators, process indicators etc.
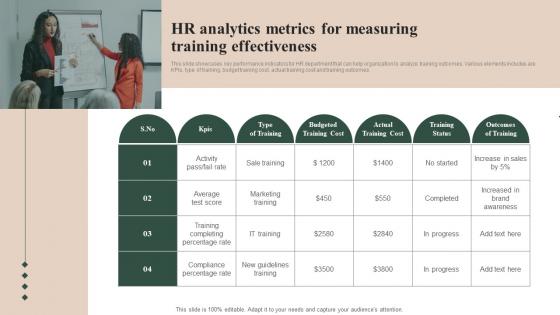
HR Analytics Metrics For Measuring Training Effectiveness Infographics Pdf
This slide showcases key performance indicators for HR department that can help organization to analyze training outcomes. Various elements includes are KPIs, type of training, budget training cost, actual training cost and training outcomes Showcasing this set of slides titled HR Analytics Metrics For Measuring Training Effectiveness Infographics Pdf The topics addressed in these templates are Percentage Rate, Training Completing, Marketing Training All the content presented in this PPT design is completely editable. Download it and make adjustments in color, background, font etc. as per your unique business setting. This slide showcases key performance indicators for HR department that can help organization to analyze training outcomes. Various elements includes are KPIs, type of training, budget training cost, actual training cost and training outcomes.
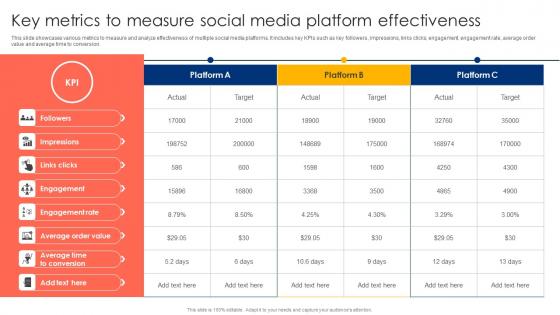
Key Metrics To Measure Social Media Platform Effectiveness Ppt Layouts Background Designs Pdf
This slide showcases various metrics to measure and analyze effectiveness of multiple social media platforms. It includes key KPIs such as key followers, impressions, links clicks, engagement, engagement rate, average order value and average time to conversion. Showcasing this set of slides titled Key Metrics To Measure Social Media Platform Effectiveness Ppt Layouts Background Designs Pdf. The topics addressed in these templates are Engagement, Engagement Rate, Average Order. All the content presented in this PPT design is completely editable. Download it and make adjustments in color, background, font etc. as per your unique business setting. This slide showcases various metrics to measure and analyze effectiveness of multiple social media platforms. It includes key KPIs such as key followers, impressions, links clicks, engagement, engagement rate, average order value and average time to conversion.
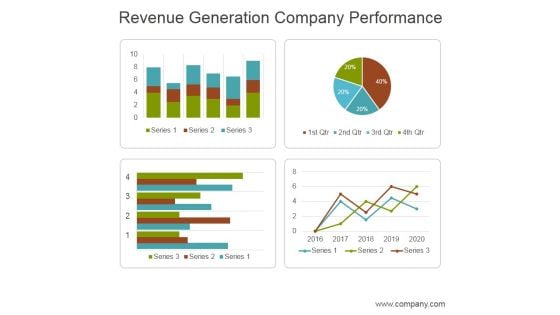
Revenue Generation Company Performance Ppt PowerPoint Presentation Layouts
This is a revenue generation company performance ppt powerpoint presentation layouts. This is a four stage process. The stages in this process are business, marketing, management, revenue, performance.
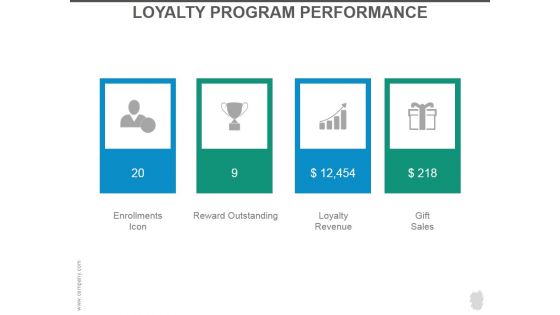
Loyalty Program Performance Ppt PowerPoint Presentation Slides
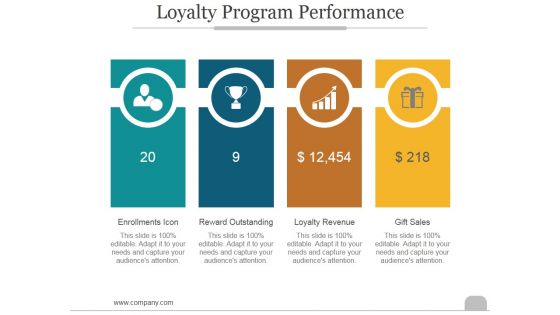
This is a loyalty program performance ppt powerpoint presentation slides. This is a four stage process. The stages in this process are enrollments icon, reward outstanding, loyalty revenue, gift sales.
Loyalty Program Performance Ppt PowerPoint Presentation Introduction
This is a loyalty program performance ppt powerpoint presentation introduction. This is a four stage process. The stages in this process are enrollments icon, reward outstanding, loyalty revenue, gift sales.
Human Resource Analytics Metrics Improvement Strategies Professional Pdf
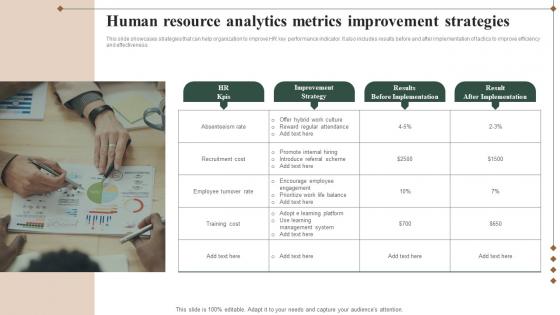
This slide showcases strategies that can help organization to improve HR key performance indicator. It also includes results before and after implementation of tactics to improve efficiency and effectiveness.Showcasing this set of slides titled Human Resource Analytics Metrics Improvement Strategies Professional Pdf The topics addressed in these templates are Absenteeism Rate, Employee Turnover, Training Cost All the content presented in this PPT design is completely editable. Download it and make adjustments in color, background, font etc. as per your unique business setting. This slide showcases strategies that can help organization to improve HR key performance indicator. It also includes results before and after implementation of tactics to improve efficiency and effectiveness.
Fiscal Department Framework With Key Metrics Rules Pdf
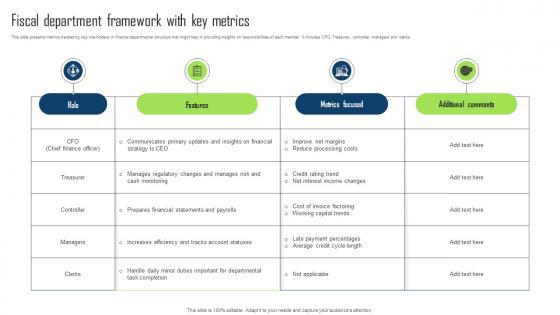
This slide presents metrics tracked by key role holders in finance departmental structure that might help in providing insights on responsibilities of each member. It includes CFO, Treasurer, controller, managers and clerks. Showcasing this set of slides titled Fiscal Department Framework With Key Metrics Rules Pdf. The topics addressed in these templates are Fiscal Department, Framework With Key Metrics, Insights On Responsibilities. All the content presented in this PPT design is completely editable. Download it and make adjustments in color, background, font etc. as per your unique business setting. This slide presents metrics tracked by key role holders in finance departmental structure that might help in providing insights on responsibilities of each member. It includes CFO, Treasurer, controller, managers and clerks.
Business Framework How To Measure Key Performance Indicator PowerPoint Presentation
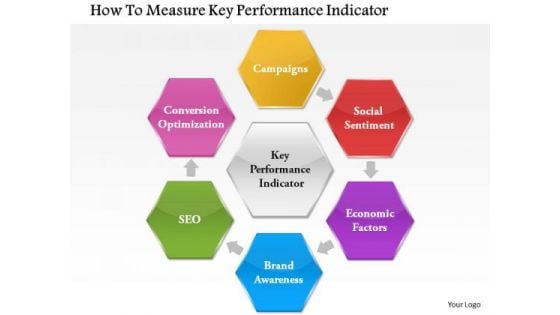
This Power Point diagram slide has been crafted with graphic of flower petal diagram. This PPT slide contains the concept of measuring the key performance and indicate it. Use this PPT slide for your management related presentation.
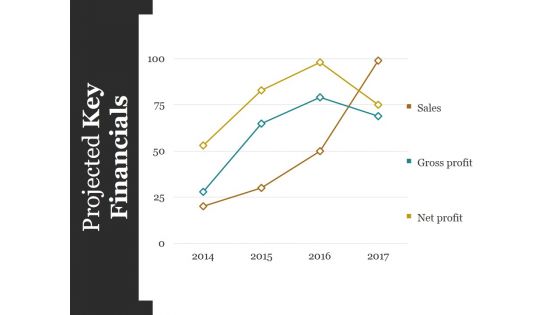
Projected Key Financials Template Ppt PowerPoint Presentation Styles Graphics Design
This is a projected key financials template ppt powerpoint presentation styles graphics design. This is a four stage process. The stages in this process are sales, gross profit, net profit.
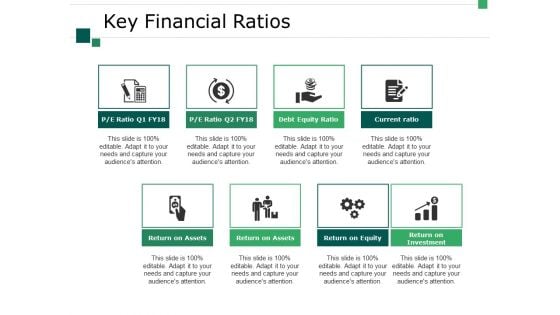
Key Financial Ratios Ppt PowerPoint Presentation Outline Slide
This is a key financial ratios ppt powerpoint presentation outline slide. This is a eight stage process. The stages in this process are return on assets, return on equity, return on investment, current ratio, debt equity ratio.

Impact Of Blockchain Integration On Key Metrics Supply Chain Evolution Harnessing The Power BCT SS V
This slide depicts the positive impact integration of blockchain has on various metrics within supply chain ecosystem of an organization. It includes before and after analysis with relevant key insights. Create an editable Impact Of Blockchain Integration On Key Metrics Supply Chain Evolution Harnessing The Power BCT SS V that communicates your idea and engages your audience. Whether you are presenting a business or an educational presentation, pre-designed presentation templates help save time. Impact Of Blockchain Integration On Key Metrics Supply Chain Evolution Harnessing The Power BCT SS V is highly customizable and very easy to edit, covering many different styles from creative to business presentations. Slidegeeks has creative team members who have crafted amazing templates. So, go and get them without any delay. This slide depicts the positive impact integration of blockchain has on various metrics within supply chain ecosystem of an organization. It includes before and after analysis with relevant key insights.
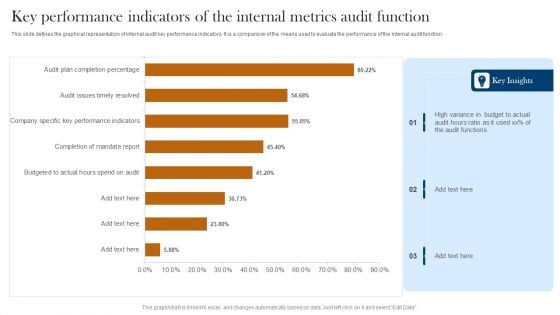
Key Performance Indicators Of The Internal Metrics Audit Function Infographics PDF
This slide defines the graphical representation of internal audit key performance indicators. It is a comparison of the means used to evaluate the performance of the internal audit function. Pitch your topic with ease and precision using this Key Performance Indicators Of The Internal Metrics Audit Function Infographics PDF. This layout presents information on High Variance, Budget To Actual, Audit Functions. It is also available for immediate download and adjustment. So, changes can be made in the color, design, graphics or any other component to create a unique layout.
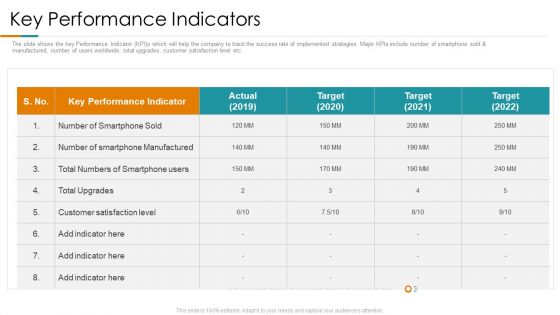
Key Performance Indicators Ppt Inspiration Layouts PDF
The slide shows the key Performance Indicator KPIs which will help the company to track the success rate of implemented strategies. Major KPIs include number of smartphone sold and manufactured, number of users worldwide, total upgrades, customer satisfaction level etc. Deliver an awe-inspiring pitch with this creative key performance indicators ppt inspiration layouts pdf. bundle. Topics like performance, target, manufactured can be discussed with this completely editable template. It is available for immediate download depending on the needs and requirements of the user.
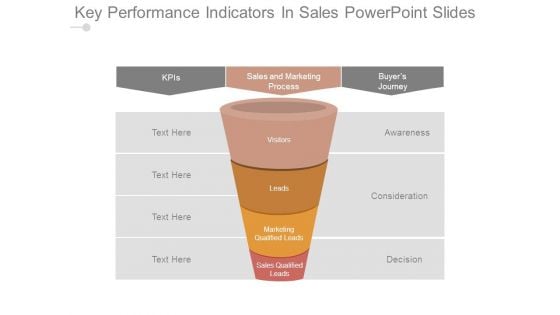
Key Performance Indicators In Sales Powerpoint Slides
This is a key performance indicators in sales powerpoint slides. This is a four stage process. The stages in this process are kpis, sales and marketing process, buyers journey, awareness, consideration, decision, visitors, leads, marketing qualified leads, sales qualified leads.
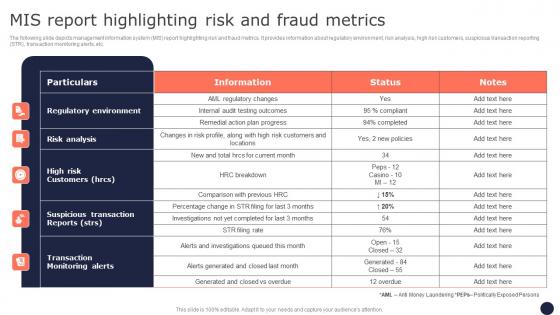
Mis Report Highlighting Risk And Fraud Metrics Mitigating Corporate Scams And Robberies Portrait Pdf
The following slide depicts management information system MIS report highlighting risk and fraud metrics. It provides information about regulatory environment, risk analysis, high risk customers, suspicious transaction reporting STR, transaction monitoring alerts, etc. The Mis Report Highlighting Risk And Fraud Metrics Mitigating Corporate Scams And Robberies Portrait Pdf is a compilation of the most recent design trends as a series of slides. It is suitable for any subject or industry presentation, containing attractive visuals and photo spots for businesses to clearly express their messages. This template contains a variety of slides for the user to input data, such as structures to contrast two elements, bullet points, and slides for written information. Slidegeeks is prepared to create an impression. The following slide depicts management information system MIS report highlighting risk and fraud metrics. It provides information about regulatory environment, risk analysis, high risk customers, suspicious transaction reporting STR, transaction monitoring alerts, etc.
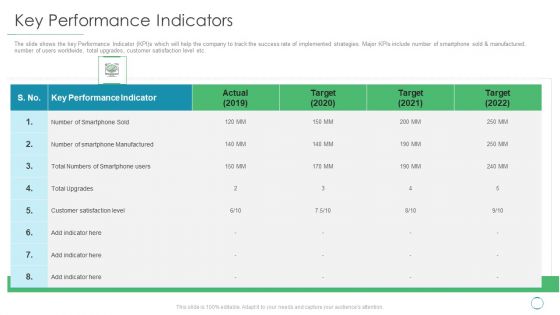
Key Performance Indicators Ppt Gallery Files PDF
The slide shows the key Performance Indicator KPIs which will help the company to track the success rate of implemented strategies. Major KPIs include number of smartphone sold and manufactured, number of users worldwide, total upgrades, customer satisfaction level etc. Deliver an awe inspiring pitch with this creative key performance indicators ppt gallery files pdf bundle. Topics like key performance indicators can be discussed with this completely editable template. It is available for immediate download depending on the needs and requirements of the user.

Key Performance Indicators Template 2 Ppt PowerPoint Presentation Microsoft
This is a key performance indicators template 2 ppt powerpoint presentation microsoft. This is a four stage process. The stages in this process are business, table, marketing, strategy, data.

Recruitment Metrics For Human Resource Analytics Management Topics Pdf
This slide showcase key performance indicator that can help organization to measure effectiveness of recruitment process. It includes key pointers such as time to hire, sourcing channel efficiency, number of qualified candidates and submit to interview ratio.Showcasing this set of slides titled Recruitment Metrics For Human Resource Analytics Management Topics Pdf The topics addressed in these templates are Recruitment Process, Identify Bottleneck, Difference Between All the content presented in this PPT design is completely editable. Download it and make adjustments in color, background, font etc. as per your unique business setting. This slide showcase key performance indicator that can help organization to measure effectiveness of recruitment process. It includes key pointers such as time to hire, sourcing channel efficiency, number of qualified candidates and submit to interview ratio.
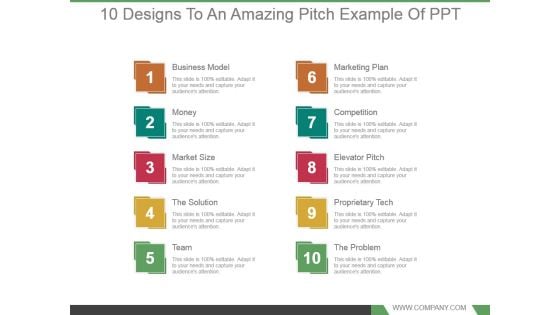
10 Designs To An Amazing Pitch Example Of Ppt
This is a 10 designs to an amazing pitch example of ppt. This is a ten stage process. The stages in this process are business model, money, market size, the solution, team, marketing plan, competition, elevator pitch, proprietary tech, the problem.
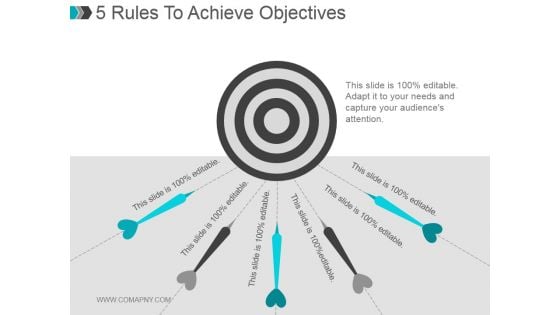
5 Rules To Achieve Objectives Ppt PowerPoint Presentation Slide
This is a 5 rules to achieve objectives ppt powerpoint presentation slide. This is a one stage process. The stages in this process are business, arrows, target, strategy, success.
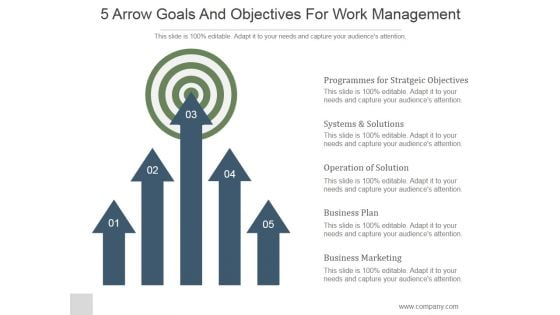
5 Arrow Goals And Objectives For Work Management Ppt PowerPoint Presentation Example File
This is a 5 arrow goals and objectives for work management ppt powerpoint presentation example file. This is a five stage process. The stages in this process are programmer for strategic objectives, systems and solutions, operation of solution, business plan, business marketing.
4 Means To Achieve Company Goal Ppt PowerPoint Presentation Clipart
This is a 4 means to achieve company goal ppt powerpoint presentation clipart. This is a four stage process. The stages in this process are arrows, targets, success, marketing, presentation.
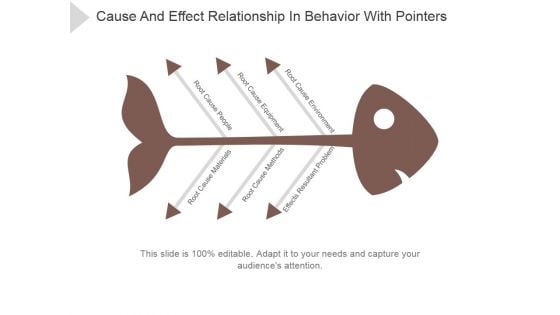
Cause And Effect Relationship In Behavior With Pointers Ppt PowerPoint Presentation Shapes
This is a cause and effect relationship in behavior with pointers ppt powerpoint presentation shapes. This is a six stage process. The stages in this process are root cause materials, root cause methods, effects resultant problem, root cause people, root cause equipment.
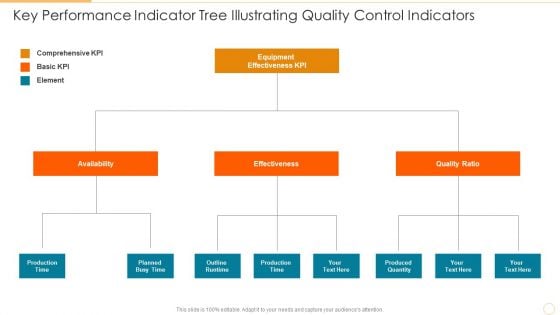
Key Performance Indicator Tree Illustrating Quality Control Indicators Information PDF
Presenting key performance indicator tree illustrating quality control indicators information pdf to dispense important information. This template comprises three stages. It also presents valuable insights into the topics including availability, effectiveness, quality ratio. This is a completely customizable PowerPoint theme that can be put to use immediately. So, download it and address the topic impactfully.
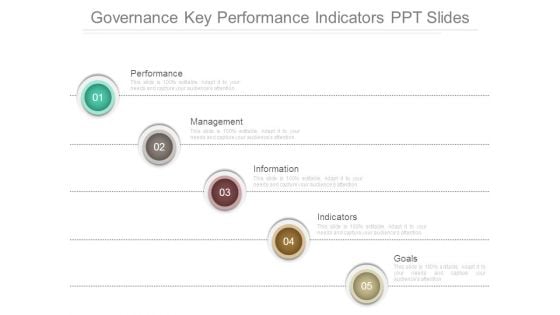
Governance Key Performance Indicators Ppt Slides
This is a governance key performance indicators ppt slides. This is a five stage process. The stages in this process are performance, management, information, indicators, goals.
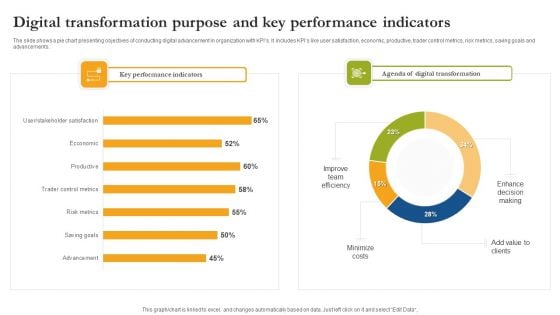
Digital Transformation Purpose And Key Performance Indicators Formats PDF
The slide shows a pie chart presenting objectives of conducting digital advancement in organization with KPIs. It includes KPIs like user satisfaction, economic, productive, trader control metrics, risk metrics, saving goals and advancements. Pitch your topic with ease and precision using this Digital Transformation Purpose And Key Performance Indicators Formats PDF. This layout presents information on Key Performance Indicators, Digital Transformation, Minimize Costs. It is also available for immediate download and adjustment. So, changes can be made in the color, design, graphics or any other component to create a unique layout.
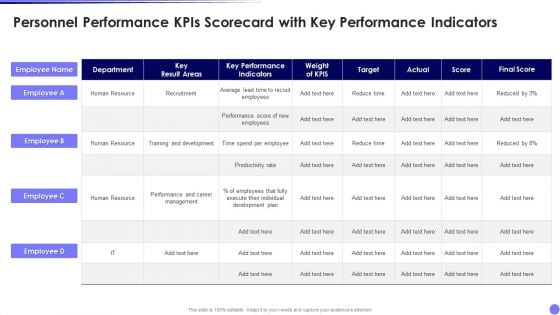
Personnel Performance Kpis Scorecard With Key Performance Indicators Designs PDF
Pitch your topic with ease and precision using this Personnel Performance Kpis Scorecard With Key Performance Indicators Designs PDF. This layout presents information on Key Performance Indicators, Target, Final Score, Employee. It is also available for immediate download and adjustment. So, changes can be made in the color, design, graphics or any other component to create a unique layout.
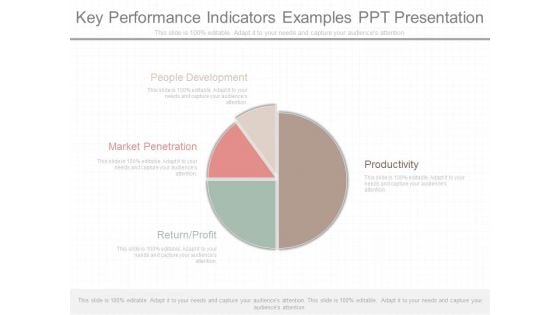
Key Performance Indicators Examples Ppt Presentation
This is a key performance indicators examples ppt presentation. This is a four stage process. The stages in this process are people development, productivity, market penetration, return profit.

Key Performance Indicators Sample Diagram Ppt Slides
This is a Key Performance Indicators Sample Diagram Ppt Slides. This is a four stage process. The stages in this process are strategize, measure, innovate, propagate.
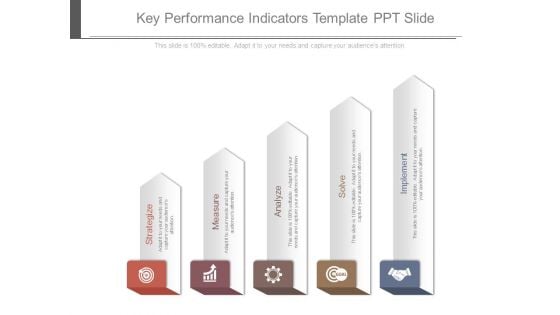
Key Performance Indicators Template Ppt Slide
This is a key performance indicators template ppt slide. This is a five stage process. The stages in this process are strategize, measure, analyze, solve, implement.
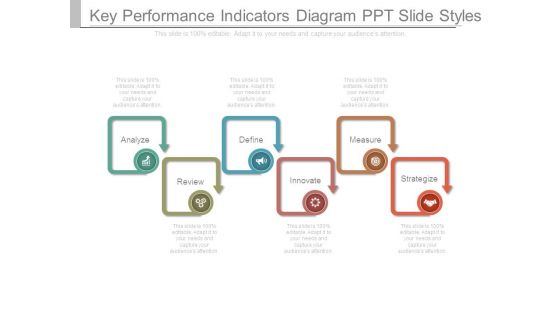
Key Performance Indicators Diagram Ppt Slide Styles
This is a key performance indicators diagram ppt slide styles. This is a six stage process. The stages in this process are analyze, define, measure, review, innovate, strategize.
Key Performance Indicators For Business Powerpoint Topics
This is a key performance indicators for business powerpoint topics. This is a eight stage process. The stages in this process are business, marketing, tables, management.
Corporate Key Performance Indicator Icon Inspiration PDF
Showcasing this set of slides titled Corporate Key Performance Indicator Icon Inspiration PDF. The topics addressed in these templates are Corporate Key, Performance Indicator Icon. All the content presented in this PPT design is completely editable. Download it and make adjustments in color, background, font etc. as per your unique business setting.
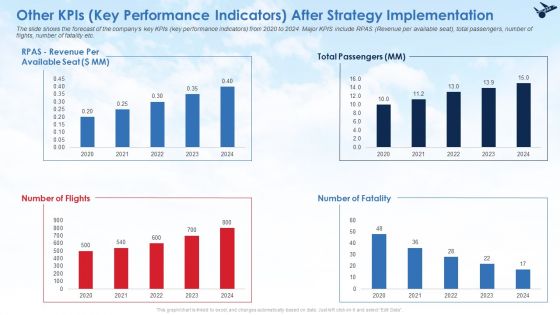
Other Kpis Key Performance Indicators After Strategy Implementation Infographics PDF
The slide shows the forecast of the companys key KPIs key performance indicators from 2020 to 2024. Major KPIS include RPAS Revenue per available seat, total passengers, number of flights, number of fatality etc. Deliver and pitch your topic in the best possible manner with this other kpis key performance indicators after strategy implementation infographics pdf. Use them to share invaluable insights on other kpis key performance indicators after strategy implementation and impress your audience. This template can be altered and modified as per your expectations. So, grab it now.
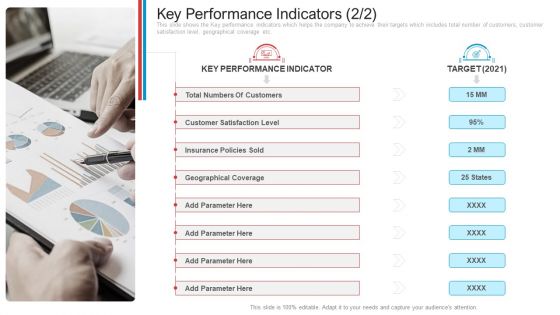
Key Performance Indicators Customers Introduction PDF
This slide shows the Key performance indicators which helps the company to achieve their targets which includes total number of customers, customer satisfaction level, geographical coverage etc. Presenting key performance indicators customers introduction pdf. to provide visual cues and insights. Share and navigate important information on seven stages that need your due attention. This template can be used to pitch topics like total numbers of customers, customer satisfaction level, insurance policies sold, geographical coverage, key performance indicator. In addtion, this PPT design contains high resolution images, graphics, etc, that are easily editable and available for immediate download.


 Continue with Email

 Home
Home


