linear programming
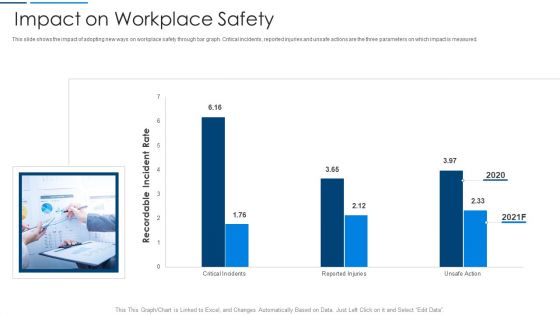
Information Technology Transformation Organization Impact On Workplace Safety Brochure PDF
This slide shows the impact of adopting new ways on workplace safety through bar graph. Critical incidents, reported injuries and unsafe actions are the three parameters on which impact is measured. Deliver an awe inspiring pitch with this creative information technology transformation organization impact on workplace safety brochure pdf bundle. Topics like impact on workplace safety can be discussed with this completely editable template. It is available for immediate download depending on the needs and requirements of the user.
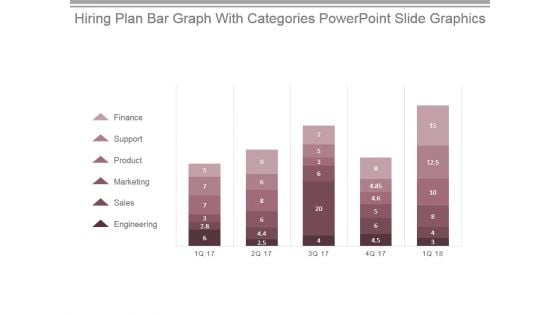
Hiring Plan Bar Graph With Categories Powerpoint Slide Graphics
This is a hiring plan bar graph with categories powerpoint slide graphics. This is a five stage process. The stages in this process are finance, support, product, marketing, sales, engineering.
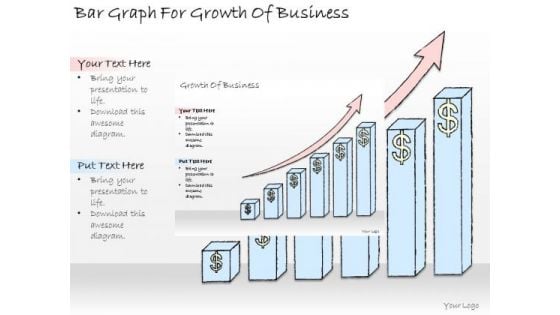
Ppt Slide Bar Graph For Growth Of Business Plan
Edit Your Work With Our PPT Slide bar graph for growth of business plan Powerpoint Templates. They Will Help You Give The Final Form. Be Your Own Editor With Our Business Plan Powerpoint Templates. Align Your Thoughts As Per Your Wishes.
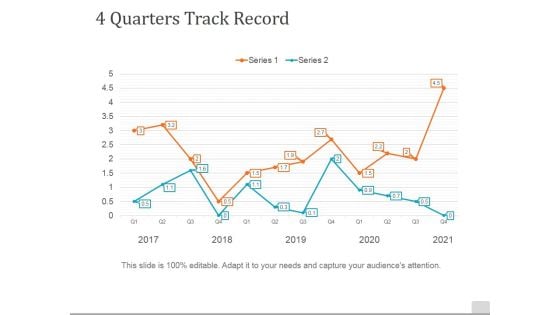
4 Quarters Track Record Template 1 Ppt PowerPoint Presentation Slides Example
This is a 4 quarters track record template 1 ppt powerpoint presentation slides example. This is a two stage process. The stages in this process are management, business, marketing, graph, line chart.
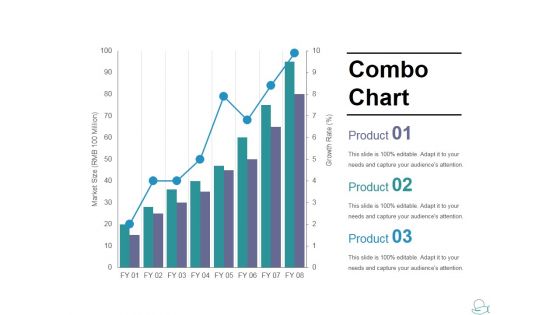
Combo Chart Ppt PowerPoint Presentation Slides Show
This is a combo chart ppt powerpoint presentation slides show. This is a three stage process. The stages in this process are combo chart, market size, product, bar graph, growth.
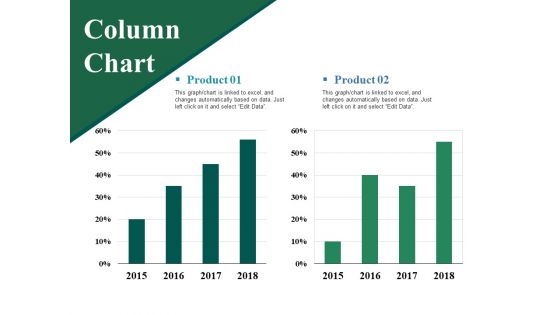
Column Chart Ppt PowerPoint Presentation Layouts Vector
This is a column chart ppt powerpoint presentation layouts vector. This is a two stage process. The stages in this process are product, column chart, bar graph, percentage, finance.
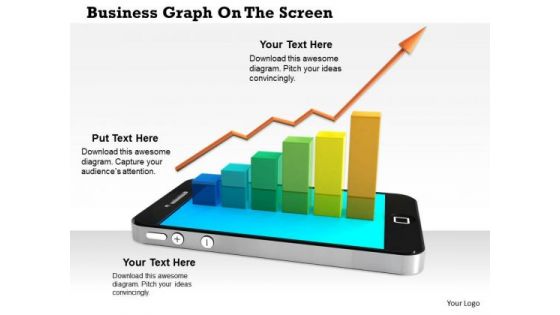
Stock Photo Arrow Growth Bar Graph On Phone Pwerpoint Slide
This graphic image has been designed with graphic of smart phone with growth bar graph. This image contains the concept of business growth analysis. Use this image for business and marketing related analysis presentations. Display finance growth analysis in an graphical way with this exclusive image.
Business Strategy Plan 3d Man Climbs On Bar Graph Character
Good Camaraderie Is A Key To Teamwork. Our Business Strategy Plan 3d Man Climbs On Bar Graph Character Powerpoint Templates Can Be A Cementing Force. Our People Powerpoint Templates Are An Agent Of Change. Let Your Thoughts Go Down Uncharted Courses.
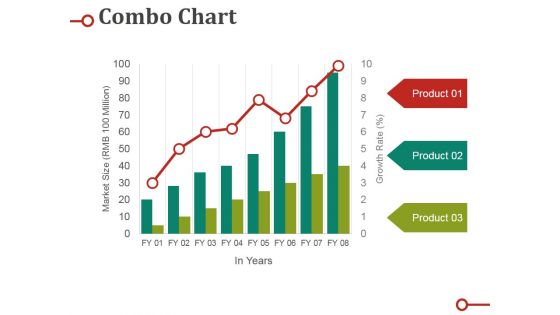
Combo Chart Ppt PowerPoint Presentation Gallery Sample
This is a combo chart ppt powerpoint presentation gallery sample. This is a three stage process. The stages in this process are market size, product, growth rate, bar, graph.
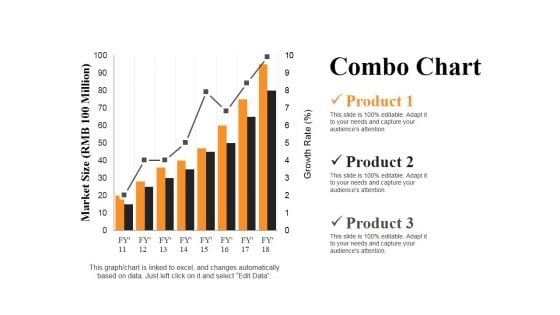
Combo Chart Ppt PowerPoint Presentation Summary Slides
This is a combo chart ppt powerpoint presentation summary slides. This is a three stage process. The stages in this process are market size, product, growth rate, bar graph, success.
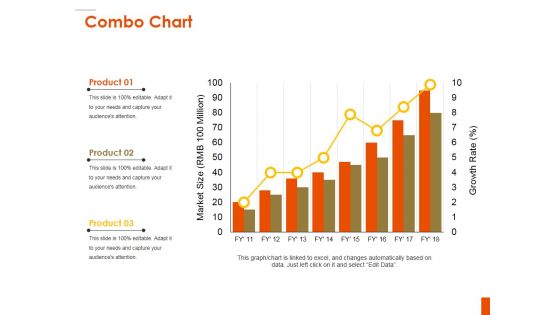
Combo Chart Ppt PowerPoint Presentation Inspiration Background
This is a combo chart ppt powerpoint presentation inspiration background. This is a three stage process. The stages in this process are product, bar graph, market size, growth, growth rate.
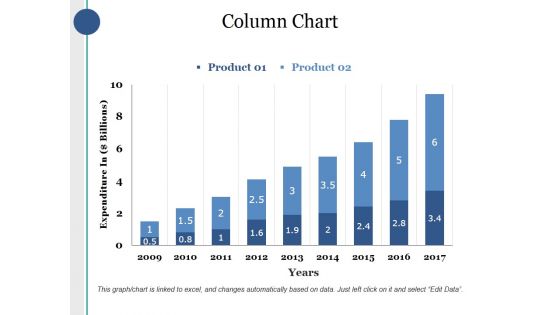
Column Chart Ppt PowerPoint Presentation Infographics Deck
This is a column chart ppt powerpoint presentation infographics deck. This is a two stage process. The stages in this process are product, expenditure in, years, bar graph, growth.
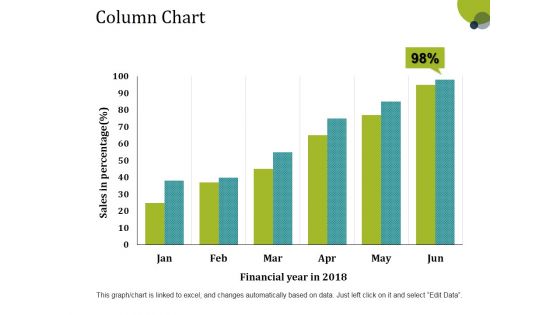
Column Chart Ppt PowerPoint Presentation Layouts Tips
This is a column chart ppt powerpoint presentation layouts tips. This is a six stage process. The stages in this process are sales in percentage, financial year, bar graph, growth, success.
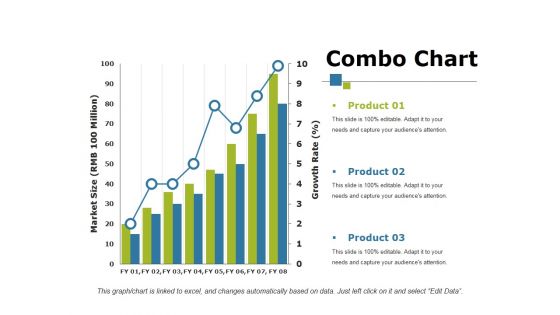
Combo Chart Ppt PowerPoint Presentation Show Influencers
This is a combo chart ppt powerpoint presentation show influencers. This is a three stage process. The stages in this process are product, bar graph, growth, growth rate, market size.
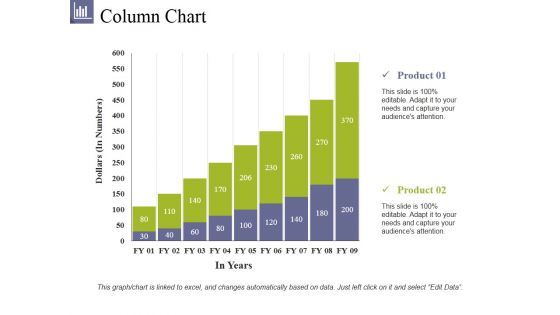
Column Chart Ppt PowerPoint Presentation File Summary
This is a column chart ppt powerpoint presentation file summary. This is a two stage process. The stages in this process are product, dollars, in years, bar graph, growth.
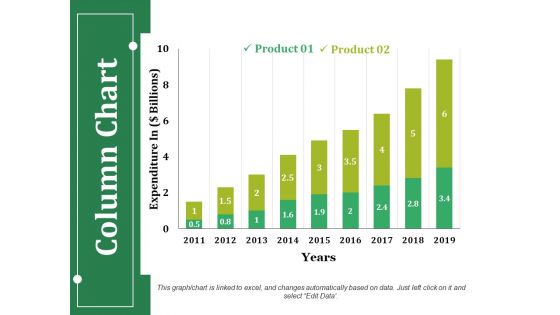
Column Chart Ppt PowerPoint Presentation Infographics Guidelines
This is a column chart ppt powerpoint presentation infographics guidelines. This is a two stage process. The stages in this process are product, expenditure in, years, business, bar graph.
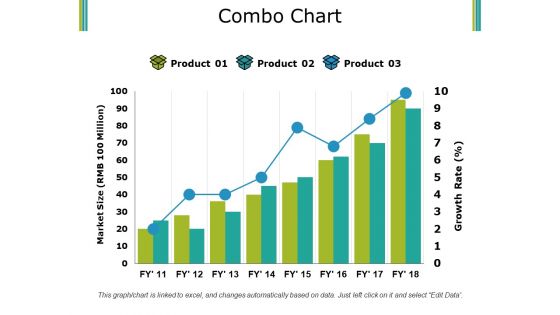
Combo Chart Ppt PowerPoint Presentation Pictures Summary
This is a combo chart ppt powerpoint presentation pictures summary. This is a three stage process. The stages in this process are product, market size, growth rate, bar graph, success.

Bar Graph Growth Success PowerPoint Templates And PowerPoint Themes 0812
Bar Graph Growth Success PowerPoint Templates And PowerPoint Themes 0812-Microsoft Powerpoint Templates and Background with bar graph with earth business growth concept Change the world with our Bar Graph Growth Success PowerPoint Templates And PowerPoint Themes 0812. You will come out on top.
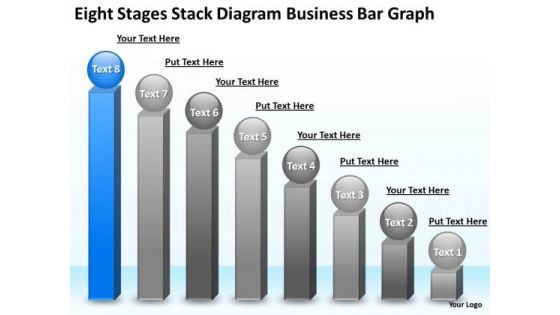
Business PowerPoint Presentation Bar Graph Constructing Plan Templates
We present our business powerpoint presentation bar graph constructing plan templates.Present our Business PowerPoint Templates because Our PowerPoint Templates and Slides will embellish your thoughts. See them provide the desired motivation to your team. Present our Spheres PowerPoint Templates because Our PowerPoint Templates and Slides are Clear and concise. Use them and dispel any doubts your team may have. Use our Competition PowerPoint Templates because You should Bet on your luck with our PowerPoint Templates and Slides. Be assured that you will hit the jackpot. Download our Shapes PowerPoint Templates because Our PowerPoint Templates and Slides will let Your superior ideas hit the target always and everytime. Download our Success PowerPoint Templates because You can Create a matrix with our PowerPoint Templates and Slides. Feel the strength of your ideas click into place.Use these PowerPoint slides for presentations relating to bar, graph, statistics, economy, render, success, representation, diagram, graphic, achievment, obstruction, chevron, accounting, finances, energy eco, steps, figure, tall, barrier, strategy, ladder, up, planning, high, climb, stripes, growth, maintenance, profit, successful, repair, return, gradient, sustainability, financial, construction, upwards, increasing. The prominent colors used in the PowerPoint template are Blue, Gray, White. Our Business PowerPoint Presentation Bar Graph Constructing Plan Templates deliver the bounty you deserve. Earn ample dividends from your efforts.
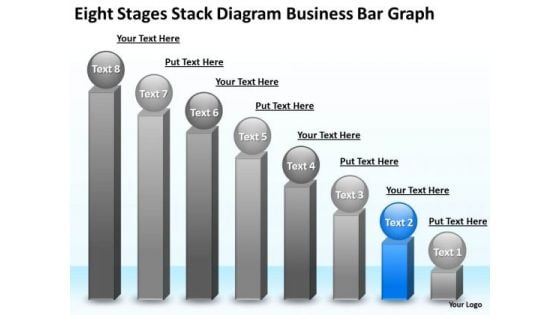
Business PowerPoint Presentation Bar Graph Strategic Planning Slides
We present our business powerpoint presentation bar graph strategic planning Slides.Download and present our Business PowerPoint Templates because Our PowerPoint Templates and Slides will let Your superior ideas hit the target always and everytime. Use our Spheres PowerPoint Templates because They will Put the wind in your sails. Skim smoothly over the choppy waters of the market. Present our Competition PowerPoint Templates because Our PowerPoint Templates and Slides will Embellish your thoughts. They will help you illustrate the brilliance of your ideas. Download and present our Shapes PowerPoint Templates because Our PowerPoint Templates and Slides will give you great value for your money. Be assured of finding the best projection to highlight your words. Download our Success PowerPoint Templates because Our PowerPoint Templates and Slides will effectively help you save your valuable time. They are readymade to fit into any presentation structure. Use these PowerPoint slides for presentations relating to bar, graph, statistics, economy, render, success, representation, diagram, graphic, achievment, obstruction, chevron, accounting, finances, energy eco, steps, figure, tall, barrier, strategy, ladder, up, planning, high, climb, stripes, growth, maintenance, profit, successful, repair, return, gradient, sustainability, financial, construction, upwards, increasing. The prominent colors used in the PowerPoint template are Blue, Gray, White. Meet your audience on equal terms. Level the field with our Business PowerPoint Presentation Bar Graph Strategic Planning Slides.
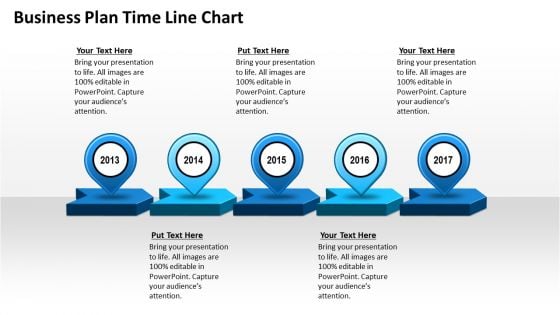
Business Plan Time Line Chart PowerPoint Templates Ppt Slides Graphics
We present our Business Plan Time Line Chart PowerPoint Templates PPT Slides Graphics.Present our Marketing PowerPoint Templates because customer satisfaction is a mantra of the marketplace. Building a loyal client base is an essential element of your business. Download our Time planning PowerPoint Templates because you have some great folks working with you, thinking with you. Present our Timelines PowerPoint Templates because they will Amplify your thoughts via our appropriate templates. Use our Arrows PowerPoint Templates because you are buzzing with ideas. Present our Business PowerPoint Templates because this layout helps you to bring some important aspects of your business process to the notice of all concerned. Streamline the flow of information across the board.Use these PowerPoint slides for presentations relating to Art, Background, Button, Call, City, Colorful, Concept, Country, Destination, Editable, Flag, Fuel, Geography, Graphic, Home, Icon, Illustration, Journey, Land, Locate, Location, Macro, Map, Mapping, Mark, Navigate, Needle, Petrol, Pin, Pinpoint, Place, Pointing, Pump, Push, Pushpin, Restaurant, Road, Roadmap, Service, Set, Shiny, Space, Symbol, Town, Travel, Trip. The prominent colors used in the PowerPoint template are Blue, Blue light, Gray. You can be sure our Business Plan Time Line Chart PowerPoint Templates PPT Slides Graphics are Excellent. You can be sure our Country PowerPoint templates and PPT Slides are Stylish. Professionals tell us our Business Plan Time Line Chart PowerPoint Templates PPT Slides Graphics are Majestic. Use our Colorful PowerPoint templates and PPT Slides are Charming. Use our Business Plan Time Line Chart PowerPoint Templates PPT Slides Graphics are Energetic. Use our Button PowerPoint templates and PPT Slides are Excellent. Put your thoughts effortlessly together. Our Business Plan Time Line Chart PowerPoint Templates Ppt Slides Graphics will create a classic ensemble.
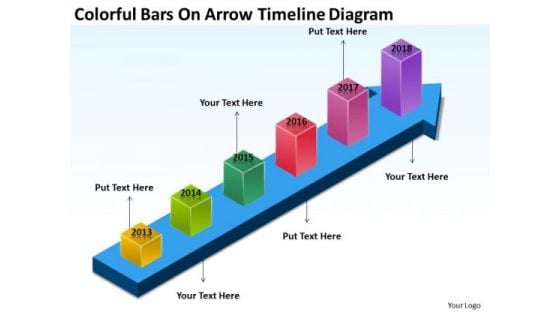
Colorful Bars On Arrow Timeline Diagram Developing Business Plan PowerPoint Slides
We present our colorful bars on arrow timeline diagram developing business plan PowerPoint Slides.Use our Arrows PowerPoint Templates because It can Bubble and burst with your ideas. Download our Business PowerPoint Templates because our PowerPoint Templates and Slides are a looking glass. Train them on the magnificent future you have in mind. Present our Finance PowerPoint Templates because Our PowerPoint Templates and Slides are like the strings of a tennis racquet. Well strung to help you serve aces. Download and present our Marketing PowerPoint Templates because Our PowerPoint Templates and Slides will let you Hit the target. Go the full distance with ease and elan. Present our Success PowerPoint Templates because Our PowerPoint Templates and Slides are focused like a searchlight beam. They highlight your ideas for your target audience.Use these PowerPoint slides for presentations relating to achievement, analyzing, arrow sign, aspirations, bar graph, bull market, business, chart, concepts, data, diagram, expressing positivity, finance, graph, graphic, grow, growth, height chart, idea, illustration, image, improvement, inflation, investment, making money, market, marketing, measure, money, moving, moving up, number, price, profit, progress, report, rise, savings, shiny, sign, solution, statistic, stock, stock market, success, symbol, up, white. The prominent colors used in the PowerPoint template are Blue, Yellow, Green. Our Colorful Bars On Arrow Timeline Diagram Developing Business Plan PowerPoint Slides conform to all clauses. They are amenable to any conditions.
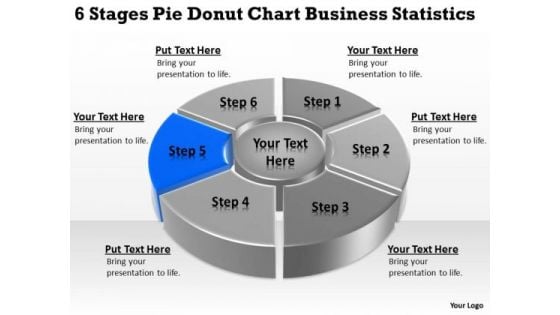
Templates Free Download Statistics Startup Business Plan Outline PowerPoint
We present our templates free download statistics startup business plan outline PowerPoint.Download our Process and Flows PowerPoint Templates because It can be used to Set your controls for the heart of the sun. Our PowerPoint Templates and Slides will be the propellant to get you there. Download our Circle Charts PowerPoint Templates because Our PowerPoint Templates and Slides will steer your racing mind. Hit the right buttons and spur on your audience. Present our Marketing PowerPoint Templates because You can Raise a toast with our PowerPoint Templates and Slides. Spread good cheer amongst your audience. Present our Flow Charts PowerPoint Templates because You can Double your output with our PowerPoint Templates and Slides. They make beating deadlines a piece of cake. Use our Business PowerPoint Templates because You can Rise to the occasion with our PowerPoint Templates and Slides. You will bring your audience on their feet in no time.Use these PowerPoint slides for presentations relating to Infographic, graph, chart, data, icon, diagram, progress, bar, line, download, button, pie, search, time, statistics, percent, segment, cloud, business, concept, sign,loading, symbol, template, circle, graphic, modern, status, visualization, roundabstract, management, mba, manage, illustration, weakness, strategy, project, clipart, guidelines, direction, design, organization, commerce, conceptual,heirarchy, resource, theoretical, action, goals, performance. The prominent colors used in the PowerPoint template are Blue, Gray, White. Display your class with our Templates Free Download Statistics Startup Business Plan Outline PowerPoint. Demonstrate your expertise to your audience.
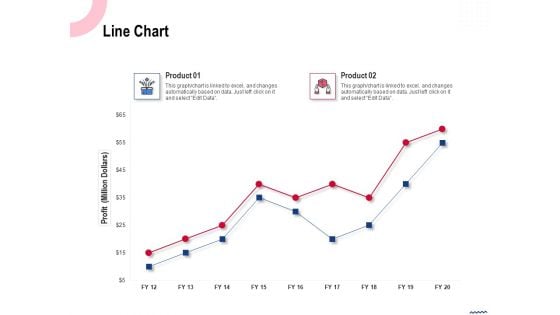
Wireless Phone Information Management Plan Line Chart Slides PDF
Presenting this set of slides with name wireless phone information management plan line chart slides pdf. The topics discussed in these slides are product 1, product 2. This is a completely editable PowerPoint presentation and is available for immediate download. Download now and impress your audience.
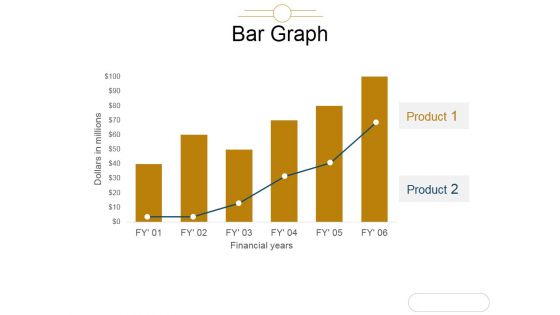
Bar Graph Ppt PowerPoint Presentation Model Graphic Tips
This is a bar graph ppt powerpoint presentation model graphic tips. This is a two stage process. The stages in this process are we are dollars in millions, financials years, bar graph, product, business.
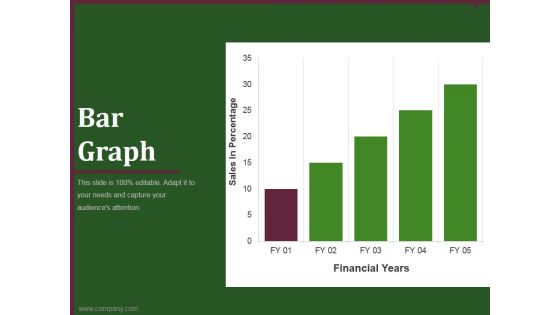
bar graph template 1 ppt powerpoint presentation infographics
This is a bar graph template 1 ppt powerpoint presentation infographics. This is a five stage process. The stages in this process are business, marketing, graph, analysis, growth.

Lego Bar Graph Business PowerPoint Templates And PowerPoint Themes 0712
Lego Bar Graph Business PowerPoint Templates And PowerPoint Themes 0712-Microsoft Powerpoint Templates and Background with bar graphs Exhibit your plan with our Lego Bar Graph Business PowerPoint Templates And PowerPoint Themes 0712. Display the clarity of your ideas.

Laptop Globe Bar Graph Dollar Coins Ppt Slides Graphics
Icons of laptop, globe and bar graph with dollar coins have been used to design this icon PPT slide. Download these icons to display concepts of technology and financial growth. Use this slide to build an exclusive presentation.
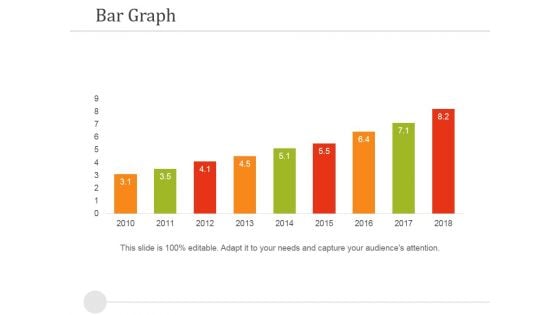
Bar Graph Ppt PowerPoint Presentation Outline File Formats
This is a bar graph ppt powerpoint presentation outline file formats. This is a nine stage process. The stages in this process are bar graph, business, management, success, strategy.
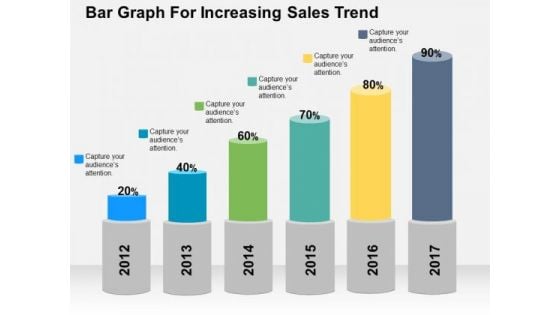
Bar Graph For Increasing Sales Trend PowerPoint Template
Deliver amazing presentations with our above template showing bar graph with percentage values. You may download this slide to depict increase in sales trends. Capture the attention of your audience using this diagram.
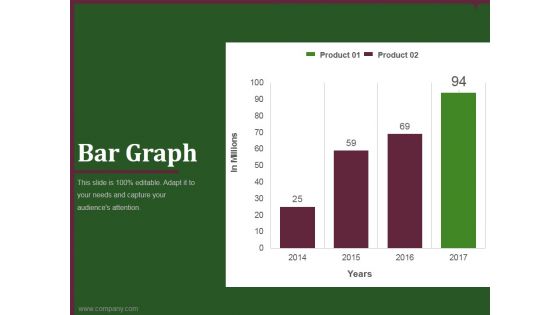
bar graph template 2 ppt powerpoint presentation gallery
This is a bar graph template 2 ppt powerpoint presentation gallery. This is a four stage process. The stages in this process are business, marketing, product, analysis, growth.
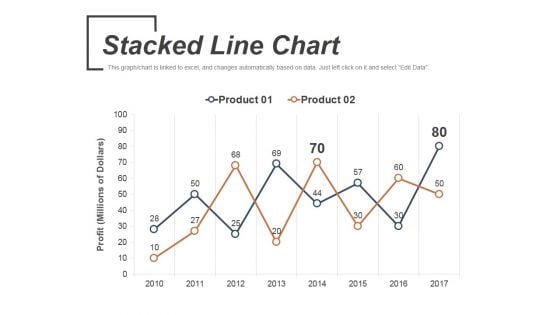
Stacked Line Chart Ppt PowerPoint Presentation Outline Examples
This is a stacked line chart ppt powerpoint presentation outline examples. This is a two stage process. The stages in this process are product, stacked line chart, business, marketing, profit.
Combo Chart Ppt PowerPoint Presentation Icon Format Ideas
This is a combo chart ppt powerpoint presentation icon format ideas. This is a three stage process. The stages in this process are bar, marketing, strategy, planning, growth.
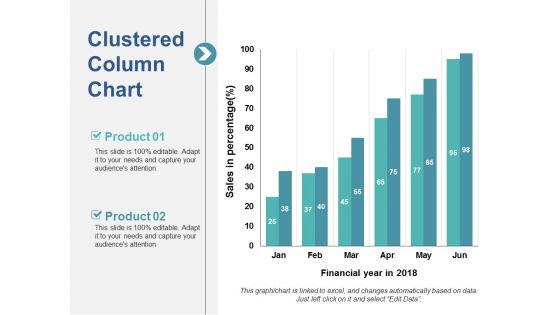
Clustered Column Chart Ppt PowerPoint Presentation Slides Smartart
This is a clustered column chart ppt powerpoint presentation slides smartart. This is a two stage process. The stages in this process are bar, marketing, strategy, planning, finance.
Column Chart Ppt PowerPoint Presentation Icon Show
This is a column chart ppt powerpoint presentation icon show. This is a two stage process. The stages in this process are column chart, product, years, bar graph, growth.

4 Quarter Track Record Ppt PowerPoint Presentation Model Influencers
This is a 4 quarter track record ppt powerpoint presentation model influencers. This is a two stage process. The stages in this process are line, success, growth, strategy, business.
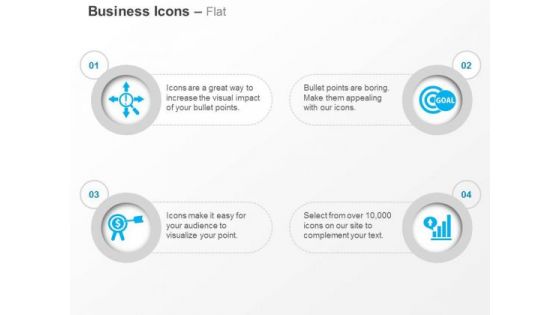
Time Management Target Goal Bar Graph Ppt Slides Graphics
This power point template has been crafted with icons of time management, target, goal and bar graph. This icon slide can be used for business analysis and time planning. Build an innovative presentation with all these professional icons.
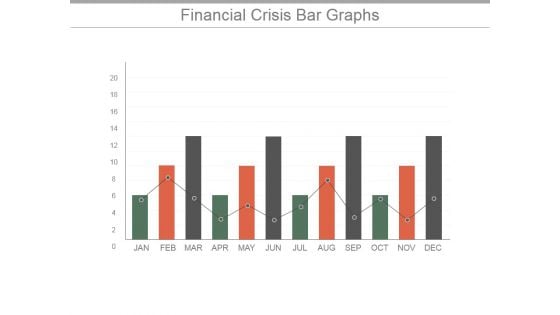
Financial Crisis Bar Graphs Ppt PowerPoint Presentation Background Images
This is a financial crisis bar graphs ppt powerpoint presentation background images. This is a twelve stage process. The stages in this process are business, analysis, strategy, finance, success, management.
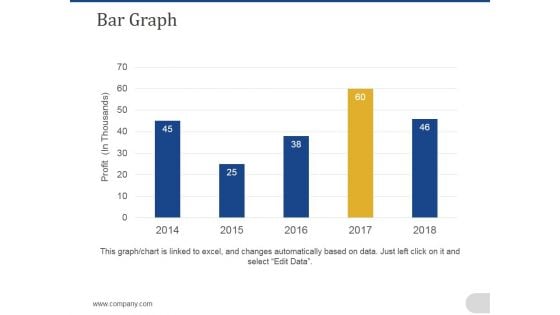
Bar Graph Ppt PowerPoint Presentation Slides File Formats
This is a bar graph ppt powerpoint presentation slides file formats. This is a five stage process. The stages in this process are business, marketing, bar graph, timeline, analysis, planning.
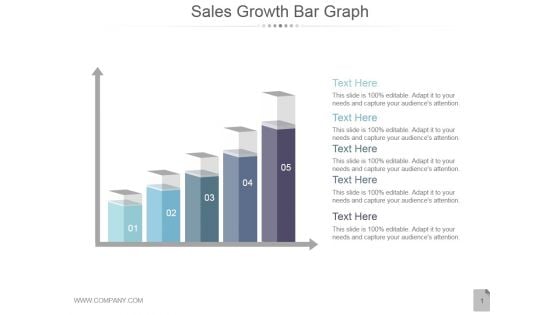
Sales Growth Bar Graph Ppt PowerPoint Presentation Background Image
This is a sales growth bar graph ppt powerpoint presentation background image. This is a five stage process. The stages in this process are arrows, success, business, marketing, process.
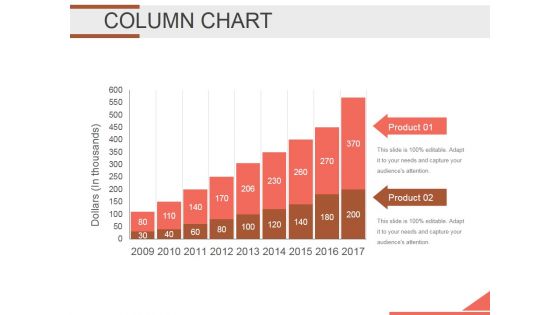
Column Chart Ppt PowerPoint Presentation Background Designs
This is a column chart ppt powerpoint presentation background designs. This is a two stage process. The stages in this process are bar graph, finance, marketing, strategy, analysis, business.
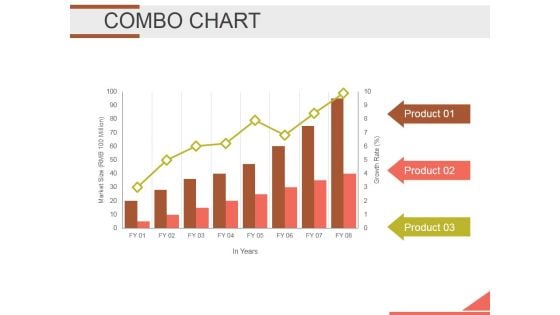
Combo Chart Ppt PowerPoint Presentation Infographics Infographics
This is a combo chart ppt powerpoint presentation infographics infographics. This is a three stage process. The stages in this process are bar graph, growth, finance, marketing, strategy, business.
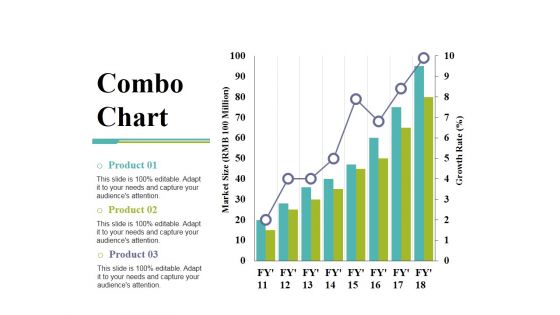
Combo Chart Ppt PowerPoint Presentation Show Deck
This is a combo chart ppt powerpoint presentation show deck. This is a three stage process. The stages in this process are growth rate, market size, product, bar graph, growth.
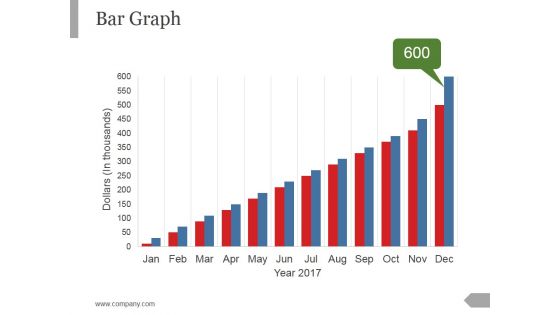
Bar Graph Ppt PowerPoint Presentation Infographic Template Visuals
This is a bar graph ppt powerpoint presentation infographic template visuals. This is a twelve stage process. The stages in this process are business, marketing, management, growth, planning.

Bar Graph Ppt PowerPoint Presentation Visual Aids Styles
This is a bar graph ppt powerpoint presentation visual aids styles. This is a five stage process. The stages in this process are finance, analysis, planning, business, process.
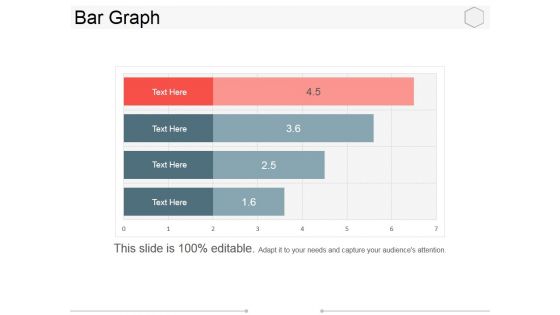
Bar Graph Ppt PowerPoint Presentation Portfolio Example Topics
This is a bar graph ppt powerpoint presentation portfolio example topics. This is a four stage process. The stages in this process are business, marketing, management, success, planning.
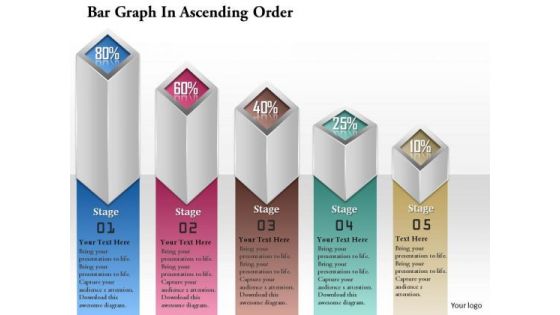
Business Diagram Bar Graph In Descending Order Presentation Template
This diagram displays bar graph in descending order. It contains bar graph with icons depicting decline in business profit. Download this diagram as a tool for business presentations.
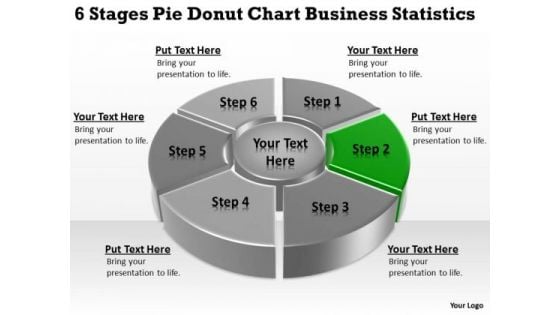
Templates Download Statistics Business Plan For Small PowerPoint Slides
We present our templates download statistics business plan for small PowerPoint Slides.Download our Process and Flows PowerPoint Templates because Our PowerPoint Templates and Slides will give you great value for your money. Be assured of finding the best projection to highlight your words. Present our Circle Charts PowerPoint Templates because You should Press the right buttons with our PowerPoint Templates and Slides. They will take your ideas down the perfect channel. Download our Shapes PowerPoint Templates because It will get your audience in sync. Download our Business PowerPoint Templates because You will get more than you ever bargained for. Download and present our Marketing PowerPoint Templates because Our PowerPoint Templates and Slides are focused like a searchlight beam. They highlight your ideas for your target audience.Use these PowerPoint slides for presentations relating to Infographic, graph, chart, data, icon, diagram, progress, bar, line, download, button, pie, search, time, statistics, percent, segment, cloud, business, concept, sign,loading, symbol, template, circle, graphic, full, element, report, level, black, shape, computer, modern, status, visualization, round, section, web,design, statistics, growth, colorful, info, stats, information, indicator. The prominent colors used in the PowerPoint template are Green, Gray, Black. Get up real close with our Templates Download Statistics Business Plan For Small PowerPoint Slides. Your goals will come within touching distance.
Bar Graph Success PowerPoint Templates And PowerPoint Themes 0912
Bar Graph Success PowerPoint Templates And PowerPoint Themes Presentations-Microsoft Powerpoint Templates and Background with bar graph-Bar Graph Success PowerPoint Templates And PowerPoint Themes PresentationsThis PPT can be used for presentations relating to-Bar graph, success, business, cylinders, spheres, shapes Do it better than the best. Our Bar Graph Success PowerPoint Templates And PowerPoint Themes 0912 do it exceedingly well.

Graph Finance PowerPoint Templates And PowerPoint Backgrounds 0511
Microsoft PowerPoint Template and Background with financial success concept golden compass with growing bar chart from golden coins Instruct your team with our Graph Finance PowerPoint Templates And PowerPoint Backgrounds 0511. Make sure your presentation gets the attention it deserves.
Business Data Graph Finance PowerPoint Templates And PowerPoint Backgrounds 0511
Microsoft PowerPoint Template and Background with increasing bar chart business data graph with world map Address baseless allegations with our Business Data Graph Finance PowerPoint Templates And PowerPoint Backgrounds 0511. Give appropriate answers to clear all doubts.
Business Data Graph Finance PowerPoint Themes And PowerPoint Slides 0511
Microsoft PowerPoint Slide and Theme with increasing bar chart business data graph with world map The audience will erupt in applause. Touch their hearts with our Business Data Graph Finance PowerPoint Themes And PowerPoint Slides 0511.
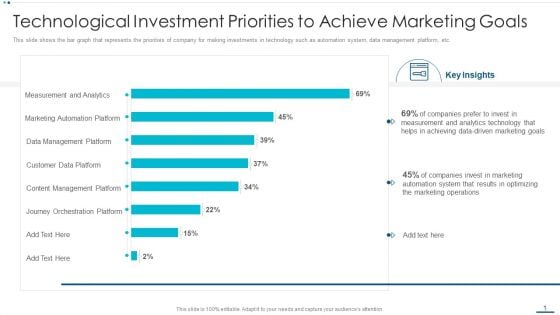
Strategic B2B Marketing Plan Technological Investment Priorities To Achieve Marketing Goals Inspiration PDF
This slide shows the bar graph that represents the priorities of company for making investments in technology such as automation system, data management platform, etc.Deliver an awe inspiring pitch with this creative strategic b2b marketing plan technological investment priorities to achieve marketing goals inspiration pdf bundle. Topics like measurement and analytics, marketing automation platform, data management platform can be discussed with this completely editable template. It is available for immediate download depending on the needs and requirements of the user.
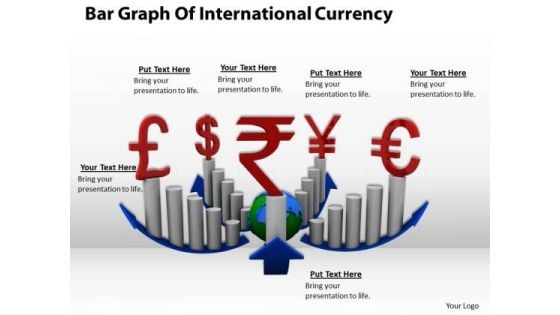
Stock Photo Bar Graph Of International Currency PowerPoint Template
Plan For All Contingencies With Our stock photo bar graph of international currency powerpoint template Powerpoint Templates. Douse The Fire Before It Catches. Generate Camaraderie With Our Globe Powerpoint Templates. Good Wishes Will Come Raining Down.
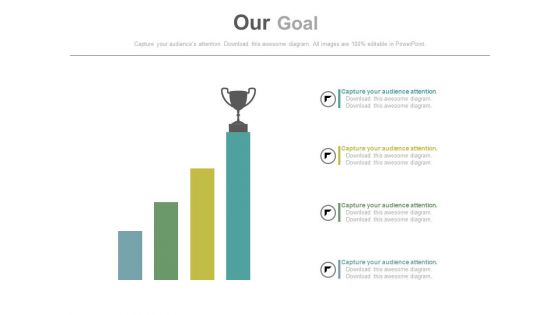
Growth Bar Graph With Trophy On Top Powerpoint Slides
This PowerPoint template has been designed with growth bar graph and trophy onto of it. Download this PPT slide to define and achieve goals with more success. This diagram may be used for goal planning related topics.
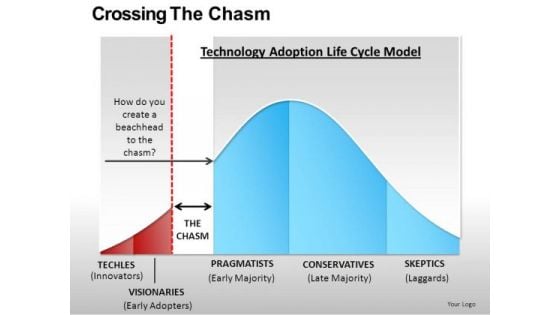
Life Cycle Charts Technology Adoption Model PowerPoint Templates
Life_Cycle_Charts_Technology_Adoption_Model_PowerPoint_templates-These high quality powerpoint pre-designed slides and powerpoint templates have been carefully created by our professional team to help you impress your audience. All slides have been created and are 100% editable in powerpoint. Each and every property of any graphic - color, size, orientation, shading, outline etc. can be modified to help you build an effective powerpoint presentation. Any text can be entered at any point in the powerpoint template or slide. Simply DOWNLOAD, TYPE and PRESENT! These PowerPoint presentation slides can be used to represent themes relating to --Alone, apart, chasm, clipart, communication, concept, couple, crack, divide, divorce, estranged, female, figure, gap, gender, graphic, illustration, isolated, isolation, issues, loneliness, love, male, man, people, problems, romance, silhouette, stick, symbol, vector, woman-Life_Cycle_Charts_Technology_Adoption_Model_PowerPoint_templates Engage the audience with your thoughts. Our Life Cycle Charts Technology Adoption Model PowerPoint Templates will keep them engrossed.
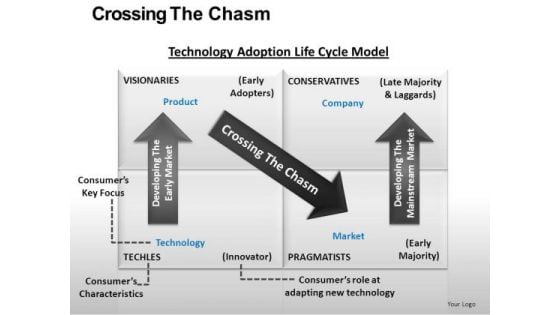
Technology Adoption Lifecycle Chart Table PowerPoint Ppt Slides
Technology_Adoption_LifeCycle_Chart_Table_PowerPoint_PPT_Slides-These high quality powerpoint pre-designed slides and powerpoint templates have been carefully created by our professional team to help you impress your audience. All slides have been created and are 100% editable in powerpoint. Each and every property of any graphic - color, size, orientation, shading, outline etc. can be modified to help you build an effective powerpoint presentation. Any text can be entered at any point in the powerpoint template or slide. Simply DOWNLOAD, TYPE and PRESENT! These PowerPoint presentation slides can be used to represent themes relating to --Alone, apart, chasm, clipart, communication, concept, couple, crack, divide, divorce, estranged, female, figure, gap, gender, graphic, illustration, isolated, isolation, issues, loneliness, love, male, man, people, problems, romance, silhouette, stick, symbol, vector, woman-Technology_Adoption_LifeCycle_Chart_Table_PowerPoint_PPT_Slides Launch products with our Technology Adoption Lifecycle Chart Table PowerPoint Ppt Slides. Download without worries with our money back guaranteee.
Customer Service Reporting Icon With Bar Graph Ppt Styles File Formats PDF
Presenting customer service reporting icon with bar graph ppt styles file formats pdf to dispense important information. This template comprises three stages. It also presents valuable insights into the topics including customer service reporting icon with bar graph. This is a completely customizable PowerPoint theme that can be put to use immediately. So, download it and address the topic impactfully.
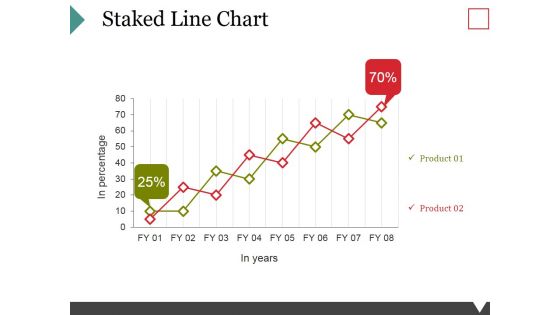
Staked Line Chart Ppt PowerPoint Presentation Model Graphics Download
This is a staked line chart ppt powerpoint presentation model graphics download. This is a two stage process. The stages in this process are business, marketing, growth, finance, management.

Abstract Bar Graph Global PowerPoint Templates And PowerPoint Themes 0512
Microsoft Powerpoint Templates and Background with bar graphs-Abstract Bar Graph Global PowerPoint Templates And PowerPoint Themes 0512-These PowerPoint designs and slide layouts can be used for themes relating to -Bar graph global, abstract, background, business, finance, success Present like a director with our Abstract Bar Graph Global PowerPoint Templates And PowerPoint Themes 0512. Make sure your presentation gets the attention it deserves.


 Continue with Email

 Home
Home


