org chart
7 Stages Concentric Proces System Business Plan Example PowerPoint Templates
We present our 7 stages concentric proces system business plan example PowerPoint templates.Download and present our Business PowerPoint Templates because Our PowerPoint Templates and Slides are like the strings of a tennis racquet. Well strung to help you serve aces. Use our Circle Charts PowerPoint Templates because It can Leverage your style with our PowerPoint Templates and Slides. Charm your audience with your ability. Download and present our Layers PowerPoint Templates because Our PowerPoint Templates and Slides will generate and maintain the level of interest you desire. They will create the impression you want to imprint on your audience. Use our Shapes PowerPoint Templates because They will Put the wind in your sails. Skim smoothly over the choppy waters of the market. Download our Leadership PowerPoint Templates because Our PowerPoint Templates and Slides will fulfill your every need. Use them and effectively satisfy the desires of your audience.Use these PowerPoint slides for presentations relating to flow, process, chart, concentric, around, sequence, collective, loop, graphic element, step, community, advertise, retail, business, blank, concept, arrow, vector, rotation, presentation, teamwork, diagram, circle, old, flowchart, abstract, wheel, pie, object, system, relationship, round, retro, brand, direction, production, motion, operation, organization, organize, movement, vintage, background, grunge, financial, repetitive, communication. The prominent colors used in the PowerPoint template are Green, Gray, Black. Illustrate your plans for greater efficiency with our 7 Stages Concentric Proces System Business Plan Example PowerPoint Templates. Work out how to get more for less.
7 Stages Concentric Proces System Sample Business Plans PowerPoint Templates
We present our 7 stages concentric proces system sample business plans PowerPoint templates.Download and present our Business PowerPoint Templates because You can Connect the dots. Fan expectations as the whole picture emerges. Use our Circle Charts PowerPoint Templates because Our PowerPoint Templates and Slides will Embellish your thoughts. They will help you illustrate the brilliance of your ideas. Download our Layers PowerPoint Templates because you can Add colour to your speech with our PowerPoint Templates and Slides. Your presentation will leave your audience speechless. Download and present our Shapes PowerPoint Templates because You canTake a leap off the starting blocks with our PowerPoint Templates and Slides. They will put you ahead of the competition in quick time. Present our Leadership PowerPoint Templates because Your success is our commitment. Our PowerPoint Templates and Slides will ensure you reach your goal.Use these PowerPoint slides for presentations relating to flow, process, chart, concentric, around, sequence, collective, loop, graphic element, step, community, advertise, retail, business, blank, concept, arrow, vector, rotation, presentation, teamwork, diagram, circle, old, flowchart, abstract, wheel, pie, object, system, relationship, round, retro, brand, direction, production, motion, operation, organization, organize, movement, vintage, background, grunge, financial, repetitive, communication. The prominent colors used in the PowerPoint template are Green, Black, Gray. Be the game changer with our 7 Stages Concentric Proces System Sample Business Plans PowerPoint Templates. Your thoughts will turn the tide.
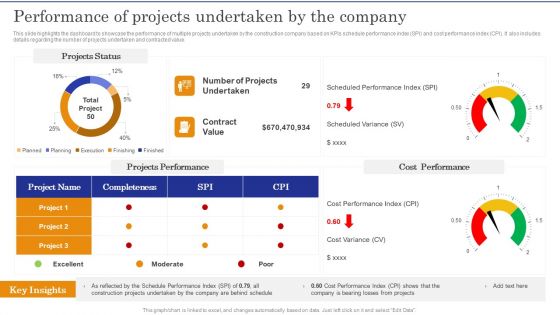
Construction Site Safety Measure Performance Of Projects Undertaken By The Company Slides PDF
This slide highlights the dashboard to showcase the performance of multiple projects undertaken by the construction company based on KPIs schedule performance index SPI and cost performance index CPI. It also includes details regarding the number of projects undertaken and contracted value.Take your projects to the next level with our ultimate collection of Construction Site Safety Measure Performance Of Projects Undertaken By The Company Slides PDF. Slidegeeks has designed a range of layouts that are perfect for representing task or activity duration, keeping track of all your deadlines at a glance. Tailor these designs to your exact needs and give them a truly corporate look with your own brand colors they all make your projects stand out from the rest.
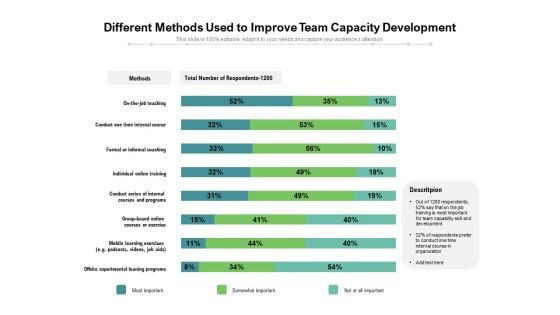
Different Methods Used To Improve Team Capacity Development Ppt PowerPoint Presentation Styles Brochure PDF
Pitch your topic with ease and precision using this different methods used to improve team capacity development ppt powerpoint presentation styles brochure pdf. This layout presents information on on the job teaching, conduct one time internal course, formal or informal coaching, individual online training, conduct series of internal, courses and programs. It is also available for immediate download and adjustment. So, changes can be made in the color, design, graphics or any other component to create a unique layout.
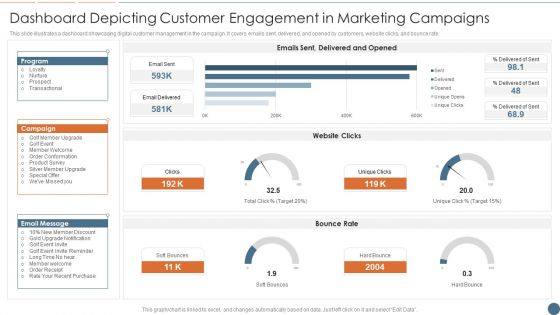
Dashboard Depicting Customer Engagement In Marketing Campaigns Inspiration PDF
This slide illustrates a dashboard showcasing digital customer management in the campaign. It covers emails sent, delivered, and opened by customers, website clicks, and bounce rate. Pitch your topic with ease and precision using this Dashboard Depicting Customer Engagement In Marketing Campaigns Inspiration PDF. This layout presents information on Program, Campaign, Email Message. It is also available for immediate download and adjustment. So, changes can be made in the color, design, graphics or any other component to create a unique layout.
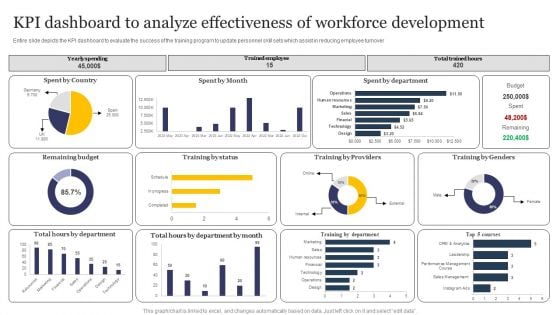
KPI Dashboard To Analyze Effectiveness Of Workforce Development Formats PDF
Entire slide depicts the KPI dashboard to evaluate the success of the training program to update personnel skill sets which assist in reducing employee turnover. Pitch your topic with ease and precision using this KPI Dashboard To Analyze Effectiveness Of Workforce Development Formats PDF. This layout presents information on Kpi Dashboard, Analyze Effectiveness, Workforce Development. It is also available for immediate download and adjustment. So, changes can be made in the color, design, graphics or any other component to create a unique layout.
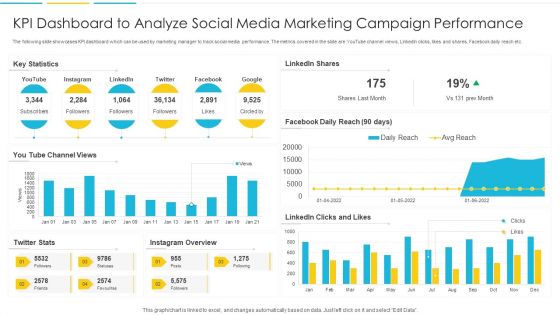
KPI Dashboard To Analyze Social Media Marketing Campaign Performance Rules PDF
The following slide showcases KPI dashboard which can be used by marketing manager to track social media performance. The metrics covered in the slide are YouTube channel views, LinkedIn clicks, likes and shares, Facebook daily reach etc. Pitch your topic with ease and precision using this KPI Dashboard To Analyze Social Media Marketing Campaign Performance Rules PDF. This layout presents information on Dashboard, Marketing, Analyze. It is also available for immediate download and adjustment. So, changes can be made in the color, design, graphics or any other component to create a unique layout.
Consumer Journey Mapping Techniques Dashboard For Tracking Social Media Platforms Introduction PDF
This slide covers the KPI dashboard for analyzing social media channels. It includes metrics such as social media followers, Facebook daily reach, Facebook engaged users and page impressions, etc. Pitch your topic with ease and precision using this Consumer Journey Mapping Techniques Dashboard For Tracking Social Media Platforms Introduction PDF. This layout presents information on Linkedin Key Metrics, Social Media Followers, Awareness. It is also available for immediate download and adjustment. So, changes can be made in the color, design, graphics or any other component to create a unique layout.
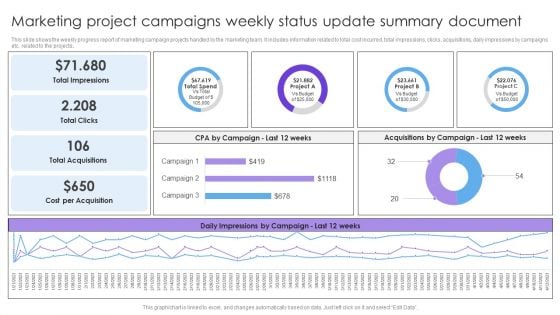
Marketing Project Campaigns Weekly Status Update Summary Document Formats PDF
This slide shows the weekly progress report of marketing campaign projects handled by the marketing team. It includes information related to total cost incurred, total impressions, clicks, acquisitions, daily impressions by campaigns etc. related to the projects. Pitch your topic with ease and precision using this Marketing Project Campaigns Weekly Status Update Summary Document Formats PDF. This layout presents information on Total Impressions, Total Clicks, Total Acquisitions. It is also available for immediate download and adjustment. So, changes can be made in the color, design, graphics or any other component to create a unique layout.
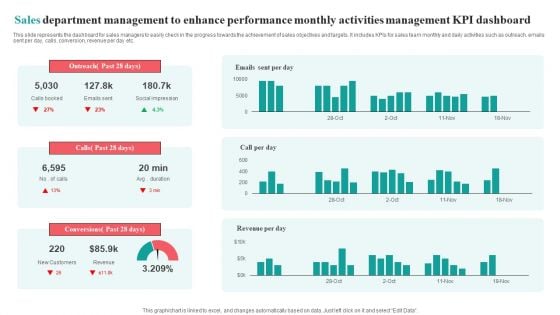
Sales Department Management To Enhance Performance Monthly Activities Management KPI Dashboard Brochure PDF
This slide represents the dashboard for sales managers to easily check in the progress towards the achievement of sales objectives and targets. It includes KPIs for sales team monthly and daily activities such as outreach, emails sent per day, calls, conversion, revenue per day etc.Pitch your topic with ease and precision using this Sales Department Management To Enhance Performance Monthly Activities Management KPI Dashboard Brochure PDF. This layout presents information on Social Impression, Conversions Past, Outreach Past. It is also available for immediate download and adjustment. So, changes can be made in the color, design, graphics or any other component to create a unique layout.
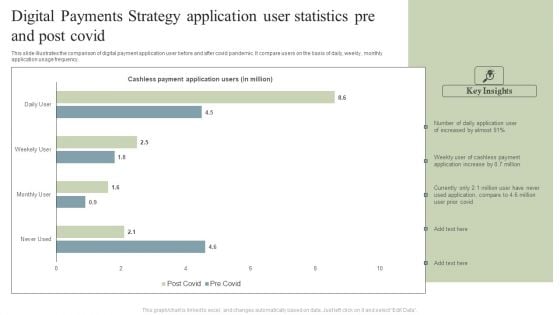
Digital Payments Strategy Application User Statistics Pre And Post Covid Pictures PDF
This slide illustrates the comparison of digital payment application user before and after covid pandemic. It compare users on the basis of daily, weekly, monthly application usage frequency. Pitch your topic with ease and precision using this Digital Payments Strategy Application User Statistics Pre And Post Covid Pictures PDF. This layout presents information on Cashless Payment, Application Users, Cashless Payment, Application Increase. It is also available for immediate download and adjustment. So, changes can be made in the color, design, graphics or any other component to create a unique layout.
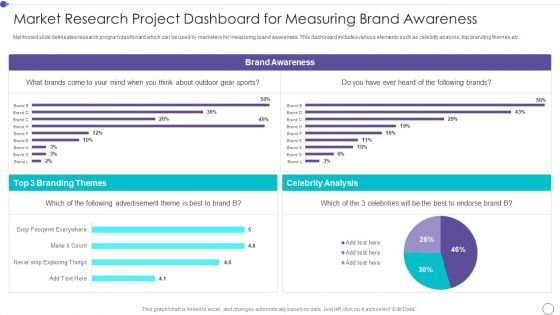
Market Research Project Dashboard For Measuring Brand Awareness Rules PDF
Mentioned slide delineates research program dashboard which can be used by marketers for measuring brand awareness. This dashboard includes various elements such as celebrity analysis, top branding themes etc. Pitch your topic with ease and precision using this market research project dashboard for measuring brand awareness rules pdf. This layout presents information on brand awareness, celebrity analysis, advertisement. It is also available for immediate download and adjustment. So, changes can be made in the color, design, graphics or any other component to create a unique layout.
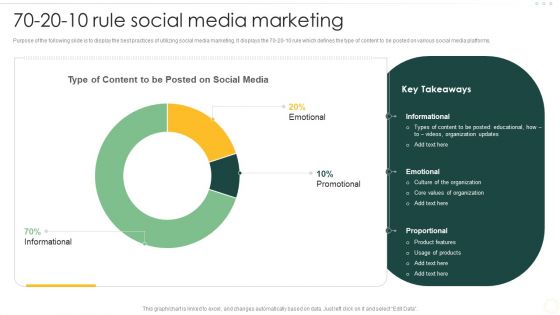
Effective Organizational B2B And B2C 70 20 10 Rule Social Media Marketing Diagrams PDF
Purpose of the following slide is to display the best practices of utilizing social media marketing. It displays the 70-20-10 rule which defines the type of content to be posted on various social media platforms. Do you have an important presentation coming up Are you looking for something that will make your presentation stand out from the rest Look no further than Effective Organizational B2B And B2C 70 20 10 Rule Social Media Marketing Diagrams PDF. With our professional designs, you can trust that your presentation will pop and make delivering it a smooth process. And with Slidegeeks, you can trust that your presentation will be unique and memorable. So why wait Grab Effective Organizational B2B And B2C 70 20 10 Rule Social Media Marketing Diagrams PDF today and make your presentation stand out from the rest.

Customer Engagement Methods For Online Platforms Emerging Trends In Mobile Shopping Industry Diagrams PDF
This slide includes statistics related to mobile commerce market size, average time spend by consumers on phone and age based categorization of consumers who do research online before making a purchase. Do you have an important presentation coming up. Are you looking for something that will make your presentation stand out from the rest. Look no further than Customer Engagement Methods For Online Platforms Emerging Trends In Mobile Shopping Industry Diagrams PDF. With our professional designs, you can trust that your presentation will pop and make delivering it a smooth process. And with Slidegeeks, you can trust that your presentation will be unique and memorable. So why wait. Grab Customer Engagement Methods For Online Platforms Emerging Trends In Mobile Shopping Industry Diagrams PDF today and make your presentation stand out from the rest.
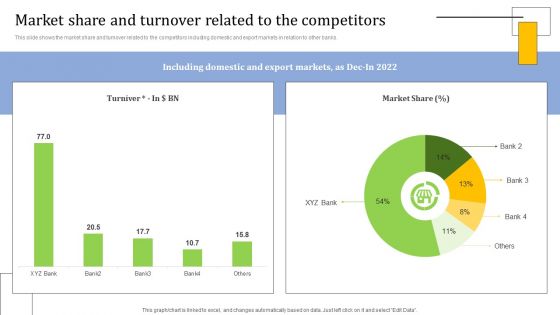
Strategies For Credit Risk Management Market Share And Turnover Related To The Diagrams PDF
This slide shows the market share and turnover related to the competitors including domestic and export markets in relation to other banks. Do you have an important presentation coming up Are you looking for something that will make your presentation stand out from the rest Look no further than Strategies For Credit Risk Management Market Share And Turnover Related To The Diagrams PDF. With our professional designs, you can trust that your presentation will pop and make delivering it a smooth process. And with Slidegeeks, you can trust that your presentation will be unique and memorable. So why wait Grab Strategies For Credit Risk Management Market Share And Turnover Related To The Diagrams PDF today and make your presentation stand out from the rest.
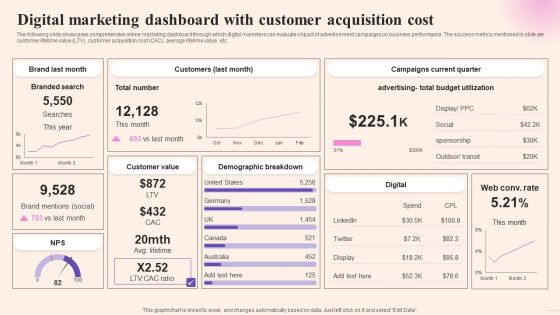
Comprehensive Guide To Build Marketing Digital Marketing Dashboard With Customer Acquisition Diagrams PDF
The following slide showcases comprehensive online marketing dashboard through which digital marketers can evaluate impact of advertisement campaigns on business performance. The success metrics mentioned in slide are customer lifetime value LTV, customer acquisition cost CAC, average lifetime value, etc. Do you have an important presentation coming up Are you looking for something that will make your presentation stand out from the rest Look no further than Comprehensive Guide To Build Marketing Digital Marketing Dashboard With Customer Acquisition Diagrams PDF. With our professional designs, you can trust that your presentation will pop and make delivering it a smooth process. And with Slidegeeks, you can trust that your presentation will be unique and memorable. So why wait Grab Comprehensive Guide To Build Marketing Digital Marketing Dashboard With Customer Acquisition Diagrams PDF today and make your presentation stand out from the rest.
Enterprise SMS Marketing Subscribers Tracking Dashboard Ppt PowerPoint Presentation Diagram PDF
This slide represents the key metrics dashboard to monito and track the SMS marketing subscribers of the enterprise. It includes details related to KPIs such as total subscribers, new subscribers, total unsubscribes etc. Do you have an important presentation coming up Are you looking for something that will make your presentation stand out from the rest Look no further than Enterprise SMS Marketing Subscribers Tracking Dashboard Ppt PowerPoint Presentation Diagram PDF. With our professional designs, you can trust that your presentation will pop and make delivering it a smooth process. And with Slidegeeks, you can trust that your presentation will be unique and memorable. So why wait Grab Enterprise SMS Marketing Subscribers Tracking Dashboard Ppt PowerPoint Presentation Diagram PDF today and make your presentation stand out from the rest.
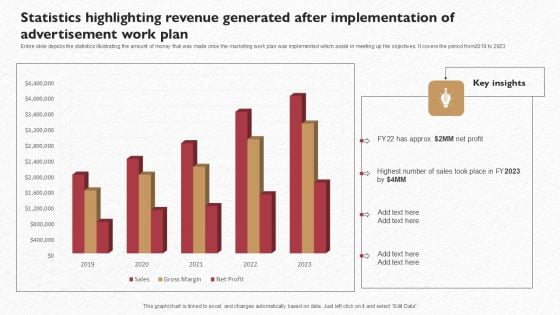
Statistics Highlighting Revenue Generated After Implementation Of Advertisement Work Plan Professional PDF

Nielsen Business Profile Revenue And Operating Income Ppt PowerPoint Presentation Diagram PDF
This slide highlights the Nielsen company revenue and operating income for the last 3 years. It includes the data in million of US dollars with a key takeaways section. This Nielsen Business Profile Revenue And Operating Income Ppt PowerPoint Presentation Diagram PDF from Slidegeeks makes it easy to present information on your topic with precision. It provides customization options, so you can make changes to the colors, design, graphics, or any other component to create a unique layout. It is also available for immediate download, so you can begin using it right away. Slidegeeks has done good research to ensure that you have everything you need to make your presentation stand out. Make a name out there for a brilliant performance.
IT Business Alignment Framework Dashboard For Tracking Business And IT Alignment Diagrams PDF
This slide depicts the dashboard for business and IT alignment by covering details of total sales, customer support service, percentage of business operations aligned IT, usage of communication channels, and top performer associates.This IT Business Alignment Framework Dashboard For Tracking Business And IT Alignment Diagrams PDF from Slidegeeks makes it easy to present information on your topic with precision. It provides customization options, so you can make changes to the colors, design, graphics, or any other component to create a unique layout. It is also available for immediate download, so you can begin using it right away. Slidegeeks has done good research to ensure that you have everything you need to make your presentation stand out. Make a name out there for a brilliant performance.

Traditional Marketing Guide To Increase Audience Engagement Cost Spent On Traditional Marketing Channels Diagrams PDF
This slide provides an overview of the cost spent on various marketing forms. The forms covered are print, broadcasting, outdoor, one on one and referral marketing. This Traditional Marketing Guide To Increase Audience Engagement Cost Spent On Traditional Marketing Channels Diagrams PDF from Slidegeeks makes it easy to present information on your topic with precision. It provides customization options, so you can make changes to the colors, design, graphics, or any other component to create a unique layout. It is also available for immediate download, so you can begin using it right away. Slidegeeks has done good research to ensure that you have everything you need to make your presentation stand out. Make a name out there for a brilliant performance.
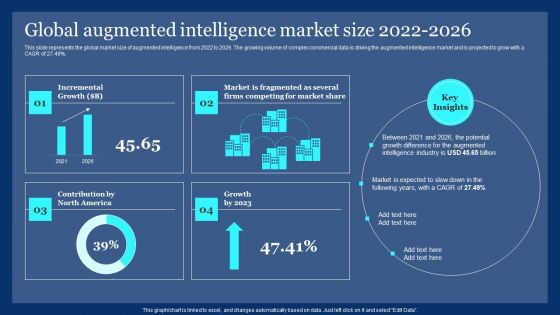
Global Augmented Intelligence Market Size 2022 2026 Ppt PowerPoint Presentation Diagram PDF
This slide represents the global market size of augmented intelligence from 2022 to 2026. The growing volume of complex commercial data is driving the augmented intelligence market and is projected to grow with a CAGR of 27.49 percent. This Global Augmented Intelligence Market Size 2022 2026 Ppt PowerPoint Presentation Diagram PDF from Slidegeeks makes it easy to present information on your topic with precision. It provides customization options, so you can make changes to the colors, design, graphics, or any other component to create a unique layout. It is also available for immediate download, so you can begin using it right away. Slidegeeks has done good research to ensure that you have everything you need to make your presentation stand out. Make a name out there for a brilliant performance.
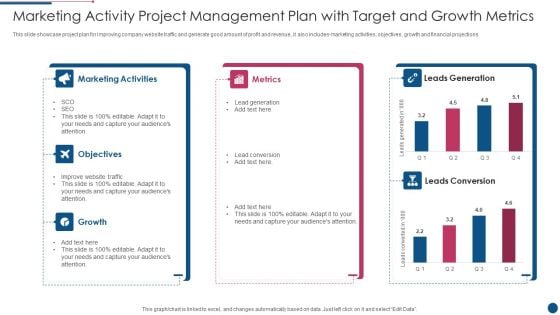
Marketing Activity Project Management Plan With Target And Growth Metrics Introduction PDF
This slide showcase project plan for improving company website traffic and generate good amount of profit and revenue, it also includes marketing activities, objectives, growth and financial projections. Pitch your topic with ease and precision using this Marketing Activity Project Management Plan With Target And Growth Metrics Introduction PDF. This layout presents information on Marketing Activities, Metrics, Growth. It is also available for immediate download and adjustment. So, changes can be made in the color, design, graphics or any other component to create a unique layout.

Domestic Budget Plan Income And Expenditure Analysis Dashboard Ppt PowerPoint Presentation Layouts Clipart Images PDF
The slide presents a dashboard to analyze and monitor income and expenses for formulating savings plan. It includes income, expenses, savings, top five expenses and unplanned expenses.Pitch your topic with ease and precision using this Domestic Budget Plan Income And Expenditure Analysis Dashboard Ppt PowerPoint Presentation Layouts Clipart Images PDF. This layout presents information on Unplanned Expenses, Expenses, Key Metrics. It is also available for immediate download and adjustment. So, changes can be made in the color, design, graphics or any other component to create a unique layout.
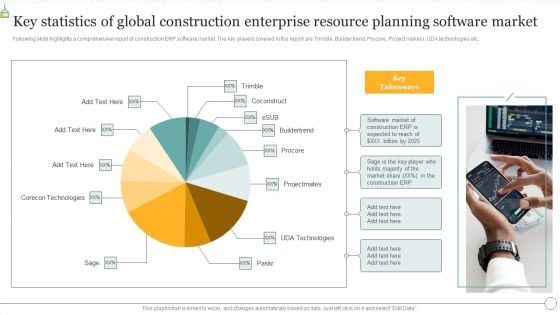
Key Statistics Of Global Construction Enterprise Resource Planning Software Market Sample PDF
Following slide highlights a comprehensive report of construction ERP software market. The key players covered in the report are Trimble, Builder trend, Procore, Project makers, UDA technologies etc. Pitch your topic with ease and precision using this Key Statistics Of Global Construction Enterprise Resource Planning Software Market Sample PDF. This layout presents information on Key Statistics, Global Construction Enterprise, Resource Planning Software Market. It is also available for immediate download and adjustment. So, changes can be made in the color, design, graphics or any other component to create a unique layout.
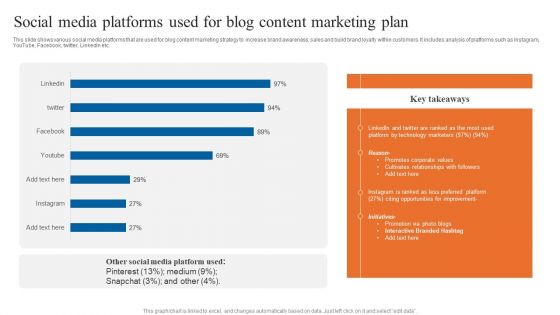
Social Media Platforms Used For Blog Content Marketing Plan Portrait PDF
This slide shows various social media platforms that are used for blog content marketing strategy to increase brand awareness, sales and build brand loyalty within customers. It includes analysis of platforms such as Instagram, YouTube, Facebook, twitter, LinkedIn etc. Pitch your topic with ease and precision using this Social Media Platforms Used For Blog Content Marketing Plan Portrait PDF. This layout presents information on Social Media Platforms, Content Marketing Plan, Promotes Corporate Values. It is also available for immediate download and adjustment. So, changes can be made in the color, design, graphics or any other component to create a unique layout.
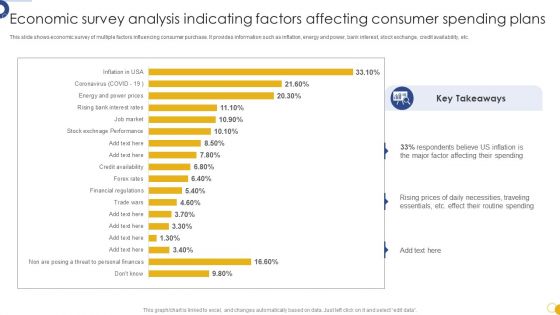
Economic Survey Analysis Indicating Factors Affecting Consumer Spending Plans Download PDF
This slide shows economic survey of multiple factors influencing consumer purchase. It provides information such as inflation, energy and power, bank interest, stock exchange, credit availability, etc. Pitch your topic with ease and precision using this Economic Survey Analysis Indicating Factors Affecting Consumer Spending Plans Download PDF. This layout presents information on Economic Survey Analysis, Indicating Factors Affecting, Consumer Spending Plans. It is also available for immediate download and adjustment. So, changes can be made in the color, design, graphics or any other component to create a unique layout.
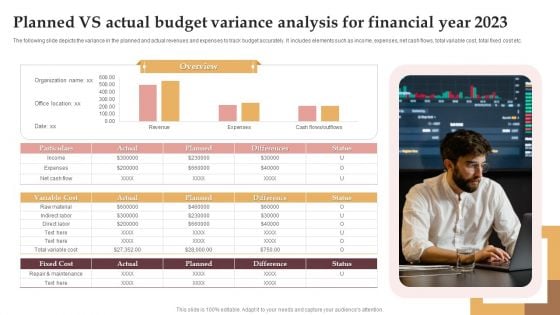
Planned Vs Actual Budget Variance Analysis For Financial Year 2023 Inspiration PDF
The following slide depicts the variance in the planned and actual revenues and expenses to track budget accurately. It includes elements such as income, expenses, net cash flows, total variable cost, total fixed cost etc. Pitch your topic with ease and precision using this Planned Vs Actual Budget Variance Analysis For Financial Year 2023 Inspiration PDF. This layout presents information on Budget Variance Analysis, Variable Cost, Fixed Cost. It is also available for immediate download and adjustment. So, changes can be made in the color, design, graphics or any other component to create a unique layout.
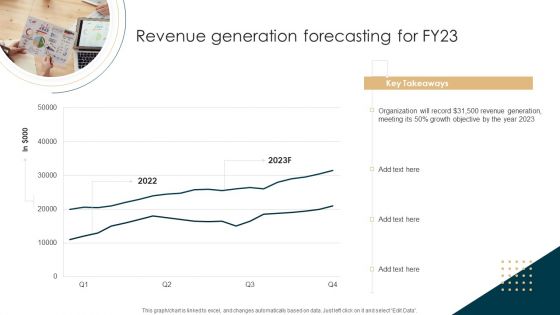
Tactical Planning Guide For Supervisors Revenue Generation Forecasting For Fy23 Elements PDF
Do you have an important presentation coming up Are you looking for something that will make your presentation stand out from the rest Look no further than Tactical Planning Guide For Supervisors Revenue Generation Forecasting For Fy23 Elements PDF. With our professional designs, you can trust that your presentation will pop and make delivering it a smooth process. And with Slidegeeks, you can trust that your presentation will be unique and memorable. So why wait Grab Tactical Planning Guide For Supervisors Revenue Generation Forecasting For Fy23 Elements PDF today and make your presentation stand out from the rest.
SFA Dashboard To Track Performance Ppt PowerPoint Presentation Icon Example File PDF
This Slide visually represents sales force automation dashboard to track performance which can be utilized by marketing managers to streamline the process of automated selling. It includes information about sales pipeline, competitors, opportunities, key competitors, etc. Pitch your topic with ease and precision using this sfa dashboard to track performance ppt powerpoint presentation icon example file pdf. This layout presents information on sales pipeline, sales pipeline by sales rep, key competitors, forecast by month, key opportunities. It is also available for immediate download and adjustment. So, changes can be made in the color, design, graphics or any other component to create a unique layout.
Saas Cloud Security Analysis With KPI Dashboard Ppt PowerPoint Presentation Icon Slides PDF
The following slide highlights the assessment of Software as a security to meet safety standards. It includes key elements such as critical incidents, risk analysis, number of open tasks etc. Pitch your topic with ease and precision using this Saas Cloud Security Analysis With KPI Dashboard Ppt PowerPoint Presentation Icon Slides PDF. This layout presents information on Quarterly Incident Severity, Incident Risk Analysis, Critical Incidents. It is also available for immediate download and adjustment. So, changes can be made in the color, design, graphics or any other component to create a unique layout.
Market Insights Research Results With KPI Dashboard Ppt PowerPoint Presentation Icon File Formats PDF
The given below slide highlights the KPAs of market research associated with customer satisfaction. It includes net promoter score, customer effort score, monthly NPS and CES trend etc.Pitch your topic with ease and precision using this Market Insights Research Results With KPI Dashboard Ppt PowerPoint Presentation Icon File Formats PDF. This layout presents information on Satisfaction Score, Customer Effort, Customer Score. It is also available for immediate download and adjustment. So, changes can be made in the color, design, graphics or any other component to create a unique layout.
Promotional Investments Barriers For B2B Sales And Marketing Data Quality Icons PDF
This slide depicts top investment challenges in B2B sales and marketing data quality. It includes barriers such as cost, better ROI with others, inadequate understanding of data quality, lack of results evidenced and absence of decision makers.Pitch your topic with ease and precision using this Promotional Investments Barriers For B2B Sales And Marketing Data Quality Icons PDF. This layout presents information on Loyalty Increases, Products Instagram, Business Presence. It is also available for immediate download and adjustment. So, changes can be made in the color, design, graphics or any other component to create a unique layout.
Statistical Data On Social Platforms Data Analysis Services Offered By Marketing Agencies Icons PDF
This slide shows the statistics related to social media services provided by the marketing agencies to their clients. It includes various services such as content creation, social media monitoring, strategy building, campaign analysis etc. Pitch your topic with ease and precision using this Statistical Data On Social Platforms Data Analysis Services Offered By Marketing Agencies Icons PDF. This layout presents information on Statistical Data, Social Platforms Data, Analysis Services, Marketing Agencies. It is also available for immediate download and adjustment. So, changes can be made in the color, design, graphics or any other component to create a unique layout.
Effect Of Pandemic On Education By Global School Closures Icons PDF
The slide illustrates the impact of COVID-19 on schools worldwide to estimate the educational loss to learners. The data included is the number of learners impacted by COVID from march 25 to april 30, 2020. Pitch your topic with ease and precision using this Effect Of Pandemic On Education By Global School Closures Icons PDF. This layout presents information on Total Estimated, Localized Level Educational, Institutions Closure. It is also available for immediate download and adjustment. So, changes can be made in the color, design, graphics or any other component to create a unique layout.
Actual Time Marketing Challenges In Using Social Data Ppt PowerPoint Presentation Icon Infographics PDF
The slide inculcates a survey highlighting various barriers in real-time marketing for using social data to increase customer engagement. Various challenges included are inadequate budget, inappropriate skills, limited search analytical tools, etc. Pitch your topic with ease and precision using this Actual Time Marketing Challenges In Using Social Data Ppt PowerPoint Presentation Icon Infographics PDF. This layout presents information on Inadequate Budget, Inappropriate Skills, Limited Staff Abilities, Quick Responses. It is also available for immediate download and adjustment. So, changes can be made in the color, design, graphics or any other component to create a unique layout.
Yearly Status Report For Average Customer Effort Score Assessment Ppt Icon Layout Ideas PDF
The slide carries a summary report to assess average CES for predicting the customer behaviour and purchasing habits. Various elements included are average rating, yearly graphs and key takeaways. Pitch your topic with ease and precision using this Yearly Status Report For Average Customer Effort Score Assessment Ppt Icon Layout Ideas PDF. This layout presents information on Good Customer Experience, Easy To Purchase, Processes, Increase Churn Rate. It is also available for immediate download and adjustment. So, changes can be made in the color, design, graphics or any other component to create a unique layout.
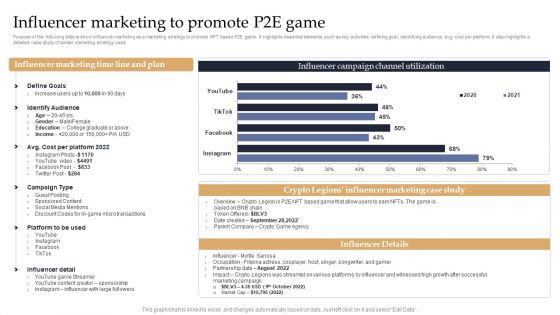
Web 3 0 Blockchain Based P2E Mobile Game Sector Report Promotional Plan Influencer Marketing Formats PDF
Purpose of the following slide is show influencer marketing as a marketing strategy to promote NFT based P2E game. It highlights essential elements such as key activities defining goal, identifying audience, avg. cost per platform. It also highlights a detailed case study of similar marketing strategy used. Do you have an important presentation coming up. Are you looking for something that will make your presentation stand out from the rest. Look no further than Web 3 0 Blockchain Based P2E Mobile Game Sector Report Promotional Plan Influencer Marketing Formats PDF. With our professional designs, you can trust that your presentation will pop and make delivering it a smooth process. And with Slidegeeks, you can trust that your presentation will be unique and memorable. So why wait. Grab Web 3 0 Blockchain Based P2E Mobile Game Sector Report Promotional Plan Influencer Marketing Themes PDF today and make your presentation stand out from the rest.
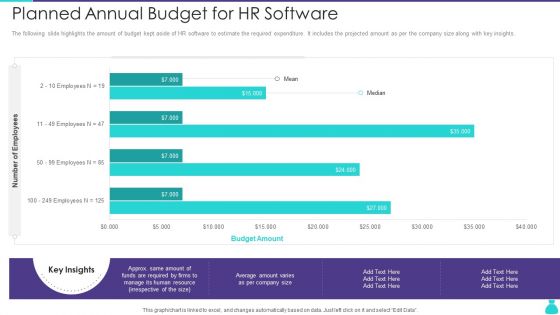
Planned Annual Budget For HR Software Ppt PowerPoint Presentation Gallery Outfit PDF
The following slide highlights the amount of budget kept aside of HR software to estimate the required expenditure. It includes the projected amount as per the company size along with key insights. Pitch your topic with ease and precision using this Planned Annual Budget For HR Software Ppt PowerPoint Presentation Gallery Outfit PDF. This layout presents information on Budget Amount, Employee. It is also available for immediate download and adjustment. So, changes can be made in the color, design, graphics or any other component to create a unique layout.
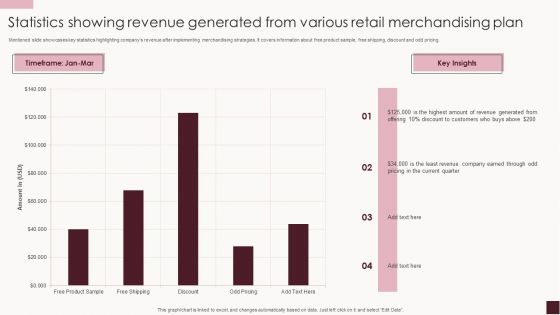
Statistics Showing Revenue Generated From Various Retail Merchandising Plan Background PDF
Mentioned slide showcases key statistics highlighting companys revenue after implementing merchandising strategies. It covers information about free product sample, free shipping, discount and odd pricing. Pitch your topic with ease and precision using this Statistics Showing Revenue Generated From Various Retail Merchandising Plan Background PDF. This layout presents information on Highest Amount, Discount Customers, Revenue Generated. It is also available for immediate download and adjustment. So, changes can be made in the color, design, graphics or any other component to create a unique layout.
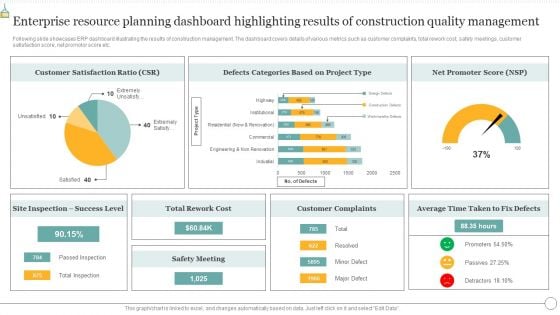
Enterprise Resource Planning Dashboard Highlighting Results Of Construction Quality Management Summary PDF
Following slide exhibits various functionalities that constructing company look for in ERP software. The multiple functionalities covered in the slide are project tracking, job costing, project estimating, improved accuracy, process automation etc. Pitch your topic with ease and precision using this Enterprise Resource Planning Dashboard Highlighting Results Of Construction Quality Management Summary PDF. This layout presents information on Technology Efficiency, Process Automation, Improved Accuracy. It is also available for immediate download and adjustment. So, changes can be made in the color, design, graphics or any other component to create a unique layout.
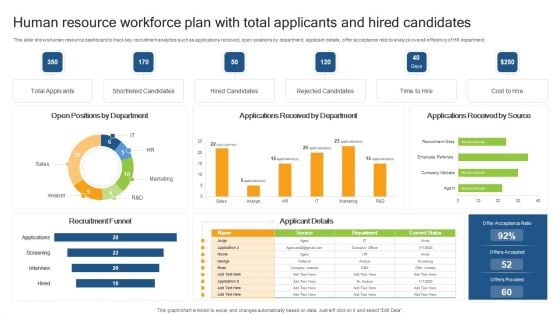
Human Resource Workforce Plan With Total Applicants And Hired Candidates Clipart PDF
This slide shows human resource dashboard to track key recruitment analytics such as applications received, open positions by department, applicant details, offer acceptance ratio to analyze overall efficiency of HR department. Pitch your topic with ease and precision using this Human Resource Workforce Plan With Total Applicants And Hired Candidates Clipart PDF. This layout presents information on Total Applicants, Shortlisted Candidates, Recruitment Funnel. It is also available for immediate download and adjustment. So, changes can be made in the color, design, graphics or any other component to create a unique layout.
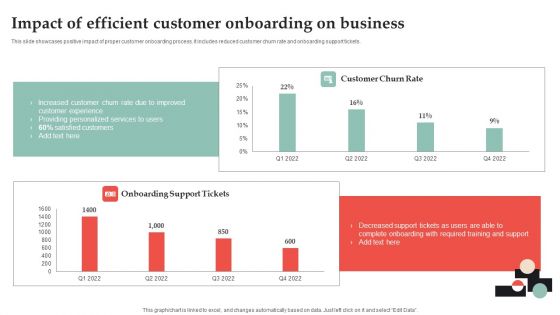
Customer Onboarding Journey Optimization Plan Impact Of Efficient Customer Graphics PDF
This slide showcases positive impact of proper customer onboarding process. It includes reduced customer churn rate and onboarding support tickets. This Customer Onboarding Journey Optimization Plan Impact Of Efficient Customer Graphics PDF from Slidegeeks makes it easy to present information on your topic with precision. It provides customization options, so you can make changes to the colors, design, graphics, or any other component to create a unique layout. It is also available for immediate download, so you can begin using it right away. Slidegeeks has done good research to ensure that you have everything you need to make your presentation stand out. Make a name out there for a brilliant performance.
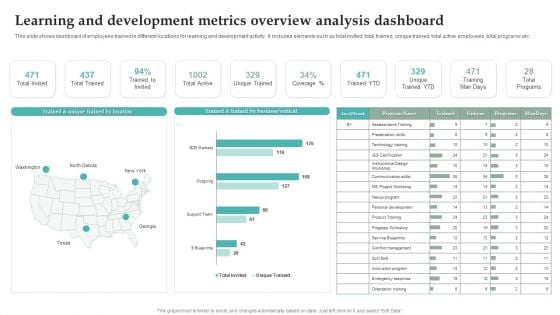
Learning And Development Metrics Overview Analysis Dashboard Graphics PDF
This slide shows dashboard of employees trained in different locations for learning and development activity. It includes elements such as total invited, total trained, unique trained, total active employees, total programs etc. Pitch your topic with ease and precision using this Learning And Development Metrics Overview Analysis Dashboard Graphics PDF. This layout presents information on Unique Trained YTD, Training Man Days, Total Programs. It is also available for immediate download and adjustment. So, changes can be made in the color, design, graphics or any other component to create a unique layout.
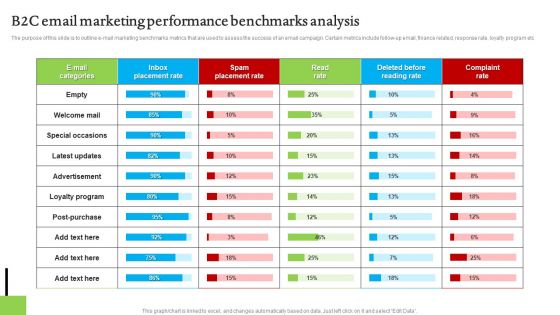
B2C Email Marketing Performance Benchmarks Analysis Topics PDF
The purpose of this slide is to outline e-mail marketing benchmarks metrics that are used to assess the success of an email campaign. Certain metrics include follow-up email, finance related, response rate, loyalty program etc. Pitch your topic with ease and precision using this B2C Email Marketing Performance Benchmarks Analysis Topics PDF. This layout presents information on Advertisement, Loyalty Program, Performance Benchmarks Analysis. It is also available for immediate download and adjustment. So, changes can be made in the color, design, graphics or any other component to create a unique layout.
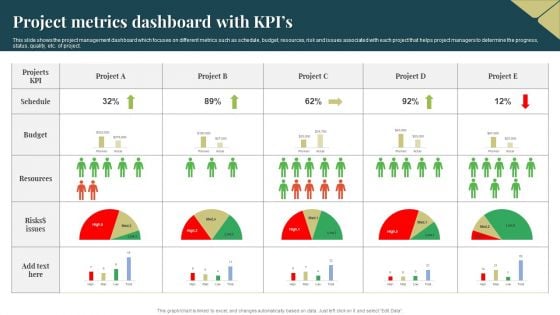
Project Metrics Dashboard With Kpis Ideas PDF
This slide shows the project management dashboard which focuses on different metrics such as schedule, budget, resources, risk and issues associated with each project that helps project managers to determine the progress, status, quality, etc. of project. Pitch your topic with ease and precision using this Project Metrics Dashboard With Kpis Ideas PDF. This layout presents information on Resources, Budget, Risks. It is also available for immediate download and adjustment. So, changes can be made in the color, design, graphics or any other component to create a unique layout.
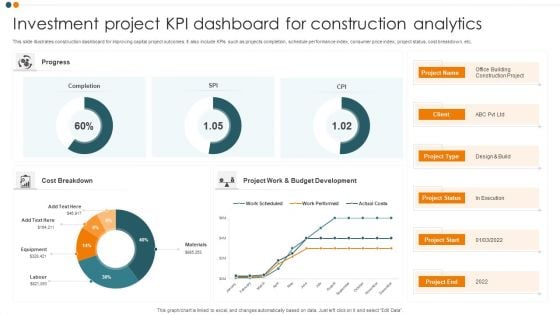
Investment Project KPI Dashboard For Construction Analytics Background PDF
This slide illustrates construction dashboard for improving capital project outcomes. It also include KPIs such as projects completion, schedule performance index, consumer price index, project status, cost breakdown, etc. Pitch your topic with ease and precision using this Investment Project KPI Dashboard For Construction Analytics Background PDF. This layout presents information on Cost Breakdown, Completion, Progress. It is also available for immediate download and adjustment. So, changes can be made in the color, design, graphics or any other component to create a unique layout.
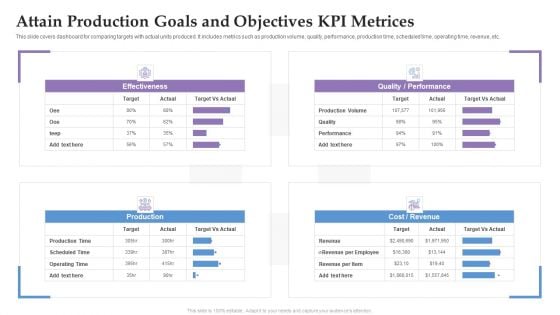
Attain Production Goals And Objectives KPI Metrices Ppt Summary Format Ideas PDF
This slide covers dashboard for comparing targets with actual units produced. It includes metrics such as production volume, quality, performance, production time, scheduled time, operating time, revenue, etc. Pitch your topic with ease and precision using this Attain Production Goals And Objectives KPI Metrices Ppt Summary Format Ideas PDF. This layout presents information on Production, Cost, Revenue, Performance. It is also available for immediate download and adjustment. So, changes can be made in the color, design, graphics or any other component to create a unique layout.
Multiple Project Progress Tracking Report Dashboard With Key Performance Indicators Brochure PDF
This slide shows the dashboard representing status of various projects and tracking their performance with the help of key performance indicators which are as follows schedule, budget, resources, risk and issues and quality of projects.Pitch your topic with ease and precision using this Multiple Project Progress Tracking Report Dashboard With Key Performance Indicators Brochure PDF. This layout presents information on Risks Issues, Quality Open Defects, Techno Blogger. It is also available for immediate download and adjustment. So, changes can be made in the color, design, graphics or any other component to create a unique layout.
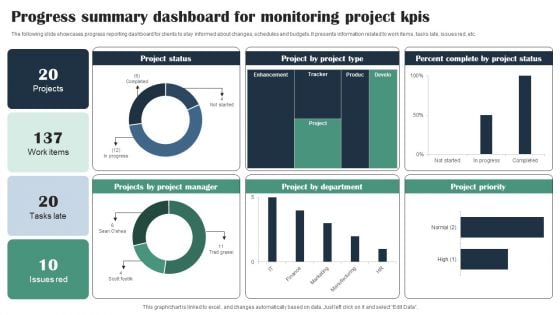
Progress Summary Dashboard For Monitoring Project Kpis Infographics PDF
The following slide showcases progress reporting dashboard for clients to stay informed about changes, schedules and budgets. It presents information related to work items, tasks late, issues red, etc. Pitch your topic with ease and precision using this Progress Summary Dashboard For Monitoring Project Kpis Infographics PDF. This layout presents information on Project Status, Project Manager, Project Type, Percent Complete. It is also available for immediate download and adjustment. So, changes can be made in the color, design, graphics or any other component to create a unique layout.

Summary Report For Post Hospital Visit Patient Experience Assessment Survey Survey SS
Following slides demonstrates summarized report for survey conducted by manager to improve hospital services. It includes key components such as appointment scheduling process, hospital visit frequency, wafting area experience, hospital cleanliness, staff behavior, etc. Pitch your topic with ease and precision using this Summary Report For Post Hospital Visit Patient Experience Assessment Survey Survey SS. This layout presents information on General Services, Appointment, Behavior. It is also available for immediate download and adjustment. So, changes can be made in the color, design, graphics or any other component to create a unique layout.
Cost For Hyperautomation Implementation Hyperautomation Software Solutions IT Icons PDF
This slide outlines the pricing for hyper-automation implementation, including the increased budget for information technology solutions, training of existing staff, staff increase or creation of new posts, and external technical consulting.Do you have an important presentation coming up Are you looking for something that will make your presentation stand out from the rest Look no further than Cost For Hyperautomation Implementation Hyperautomation Software Solutions IT Icons PDF. With our professional designs, you can trust that your presentation will pop and make delivering it a smooth process. And with Slidegeeks, you can trust that your presentation will be unique and memorable. So why wait Grab Cost For Hyperautomation Implementation Hyperautomation Software Solutions IT Icons PDF today and make your presentation stand out from the rest.
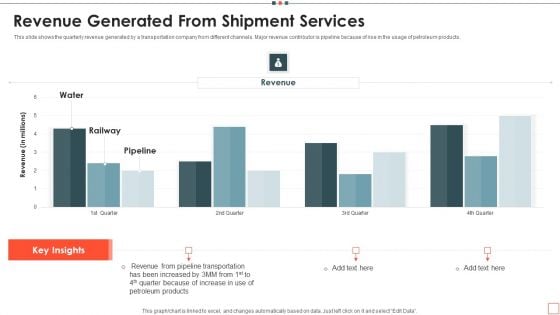
Revenue Generated From Shipment Services Topics PDF
This slide shows the quarterly revenue generated by a transportation company from different channels. Major revenue contributor is pipeline because of rise in the usage of petroleum products. Pitch your topic with ease and precision using this Shipment Services Company Monthly Dashboard Designs PDF. This layout presents information on Revenue Generated From Shipment Services. It is also available for immediate download and adjustment. So, changes can be made in the color, design, graphics or any other component to create a unique layout.
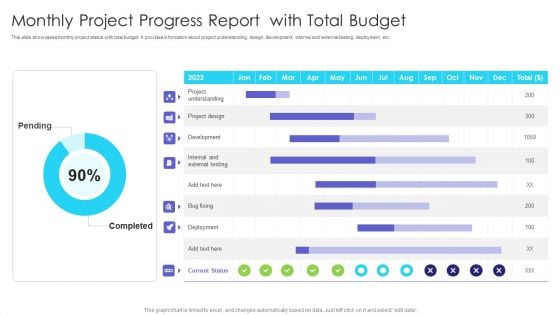
Monthly Project Progress Report With Total Budget Ppt Inspiration Shapes PDF
This slide showcases monthly project status with total budget. It provides information about project understanding, design, development, internal and external testing, deployment, etc. Pitch your topic with ease and precision using this Monthly Project Progress Report With Total Budget Ppt Inspiration Shapes PDF. This layout presents information on Pending, Completed, Project Understanding. It is also available for immediate download and adjustment. So, changes can be made in the color, design, graphics or any other component to create a unique layout.
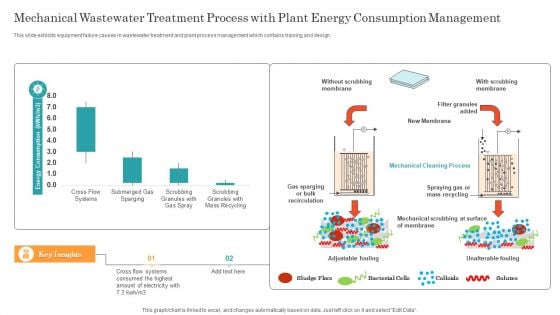
Mechanical Wastewater Treatment Process With Plant Energy Consumption Management Ppt Pictures File Formats PDF
This slide exhibits equipment failure causes in wastewater treatment and plant process management which contains training and design. Pitch your topic with ease and precision using this Mechanical Wastewater Treatment Process With Plant Energy Consumption Management Ppt Pictures File Formats PDF. This layout presents information on Cross Flow Systems, Mechanical Cleaning Process, New Membrane. It is also available for immediate download and adjustment. So, changes can be made in the color, design, graphics or any other component to create a unique layout.
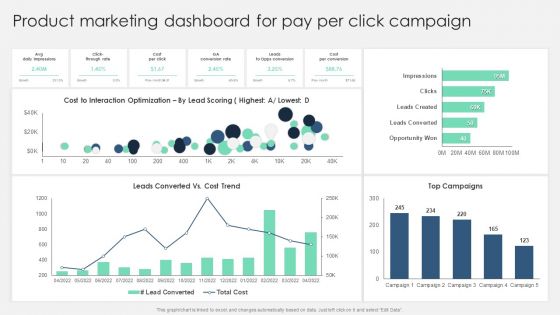
Product Marketing Dashboard For Pay Per Click Campaign Sample PDF
Take your projects to the next level with our ultimate collection of Product Marketing Dashboard For Pay Per Click Campaign Sample PDF. Slidegeeks has designed a range of layouts that are perfect for representing task or activity duration, keeping track of all your deadlines at a glance. Tailor these designs to your exact needs and give them a truly corporate look with your own brand colors they will make your projects stand out from the rest.
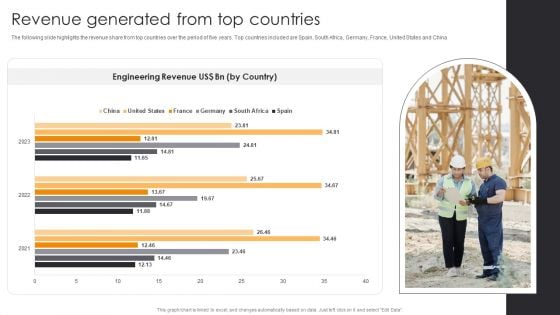
Revenue Generated From Top Countries Engineering Company Financial Analysis Report Sample PDF
Take your projects to the next level with our ultimate collection of Revenue Generated From Top Countries Engineering Company Financial Analysis Report Sample PDF. Slidegeeks has designed a range of layouts that are perfect for representing task or activity duration, keeping track of all your deadlines at a glance. Tailor these designs to your exact needs and give them a truly corporate look with your own brand colors they all make your projects stand out from the rest.
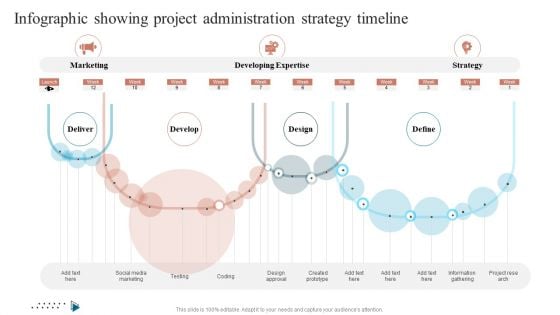
Infographic Showing Project Administration Strategy Timeline Background PDF
This slide covers a dashboard which includes 4 steps in IT process. It also includes project budget, workload, upcoming deadlines and overdue tasks.Pitch your topic with ease and precision using this Infographic Showing Project Administration Strategy Timeline Background PDF. This layout presents information on Developing Expertise, Design Approval, Created Prototype . It is also available for immediate download and adjustment. So, changes can be made in the color, design, graphics or any other component to create a unique layout.
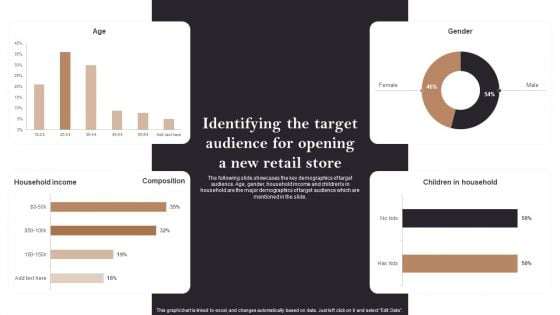
Identifying The Target Audience For Opening A New Retail Store Opening Retail Store In Untapped Graphics PDF
Take your projects to the next level with our ultimate collection of Identifying The Target Audience For Opening A New Retail Store Opening Retail Store In Untapped Graphics PDF. Slidegeeks has designed a range of layouts that are perfect for representing task or activity duration, keeping track of all your deadlines at a glance. Tailor these designs to your exact needs and give them a truly corporate look with your own brand colors they all make your projects stand out from the rest.
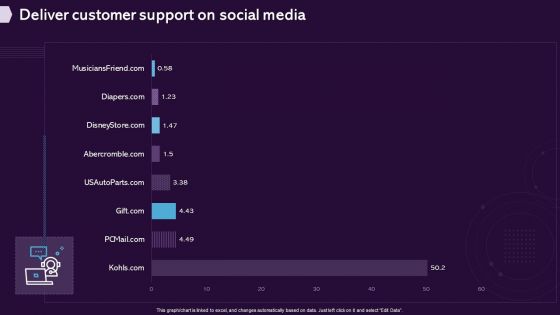
Enhancing CX Strategy Deliver Customer Support On Social Media Brochure PDF
Take your projects to the next level with our ultimate collection of Enhancing CX Strategy Deliver Customer Support On Social Media Brochure PDF. Slidegeeks has designed a range of layouts that are perfect for representing task or activity duration, keeping track of all your deadlines at a glance. Tailor these designs to your exact needs and give them a truly corporate look with your own brand colors they will make your projects stand out from the rest.


 Continue with Email

 Home
Home


