quarterly sales
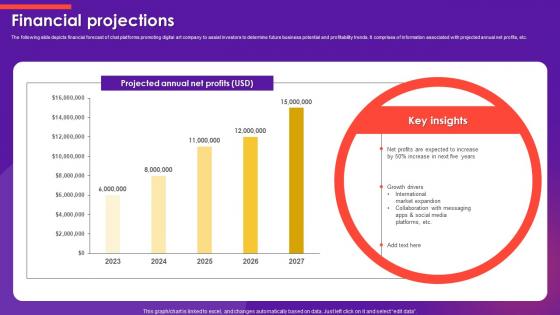
Financial Projections Emoji Marketplace Investor Funding Elevator Pitch Deck
The following slide depicts financial forecast of chat platforms promoting digital art company to assist investors to determine future business potential and profitability trends. It comprises of information associated with projected annual net profits, etc. Slidegeeks is here to make your presentations a breeze with NNNNNNNNNNNNNNNNNNNNNNNNNNNNNNNNNNNNNN With our easy-to-use and customizable templates, you can focus on delivering your ideas rather than worrying about formatting. With a variety of designs to choose from, you are sure to find one that suits your needs. And with animations and unique photos, illustrations, and fonts, you can make your presentation pop. So whether you are giving a sales pitch or presenting to the board, make sure to check out Slidegeeks first The following slide depicts financial forecast of chat platforms promoting digital art company to assist investors to determine future business potential and profitability trends. It comprises of information associated with projected annual net profits, etc.
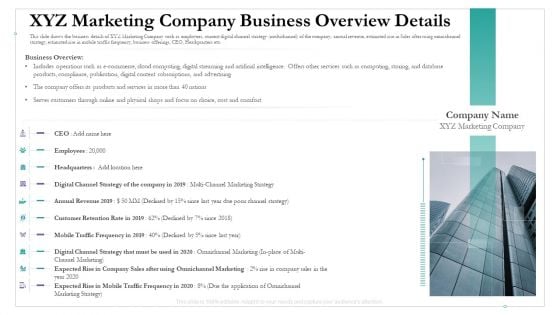
Cross Channel Marketing Benefits XYZ Marketing Company Business Overview Details Diagrams PDF
This slide shows the business details of XYZ Marketing Company such as employees, current digital channel strategy multichannel of the company, annual revenue, estimated rise in Sales after using omnichannel strategy, estimated rise in mobile traffic frequency, business offerings, CEO, Headquarters etc. Presenting cross channel marketing benefits XYZ marketing company business overview details diagrams pdf to provide visual cues and insights. Share and navigate important information on ten stages that need your due attention. This template can be used to pitch topics like annual revenue 2019, digital channel strategy that must be used in 2020, customer retention rate in 2019, expected rise in mobile traffic frequency in 2020. In addtion, this PPT design contains high-resolution images, graphics, etc, that are easily editable and available for immediate download.
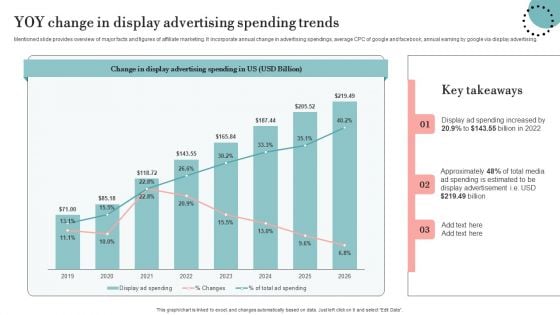
YOY Change In Display Advertising Spending Trends Rules PDF
Mentioned slide provides overview of major facts and figures of affiliate marketing. It incorporate annual change in advertising spendings, average CPC of google and facebook, annual earning by google via display advertising. Slidegeeks is here to make your presentations a breeze with YOY Change In Display Advertising Spending Trends Rules PDF With our easy to use and customizable templates, you can focus on delivering your ideas rather than worrying about formatting. With a variety of designs to choose from, you are sure to find one that suits your needs. And with animations and unique photos, illustrations, and fonts, you can make your presentation pop. So whether you are giving a sales pitch or presenting to the board, make sure to check out Slidegeeks first.
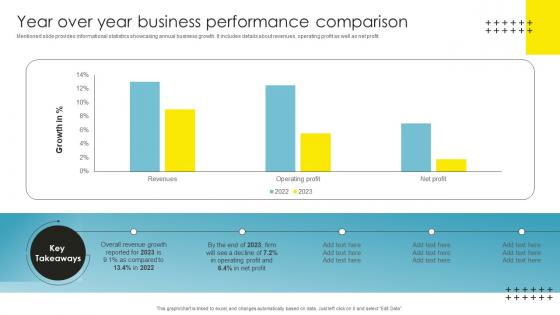
Strategic Brand Management Year Over Year Business Performance Brochure Pdf
Mentioned slide provides informational statistics showcasing annual business growth. It includes details about revenues, operating profit as well as net profit. Slidegeeks is here to make your presentations a breeze with Strategic Brand Management Year Over Year Business Performance Brochure Pdf With our easy to use and customizable templates, you can focus on delivering your ideas rather than worrying about formatting. With a variety of designs to choose from, you are sure to find one that suits your needs. And with animations and unique photos, illustrations, and fonts, you can make your presentation pop. So whether you are giving a sales pitch or presenting to the board, make sure to check out Slidegeeks first. Mentioned slide provides informational statistics showcasing annual business growth. It includes details about revenues, operating profit as well as net profit.
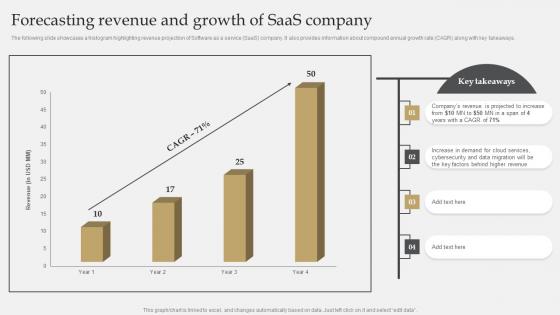
IT Industry Market Research Forecasting Revenue And Growth Of SaaS Company Elements Pdf
The following slide showcases a histogram highlighting revenue projection of Software as a service SaaS company. It also provides information about compound annual growth rate CAGR along with key takeaways. Slidegeeks is here to make your presentations a breeze with IT Industry Market Research Forecasting Revenue And Growth Of SaaS Company Elements Pdf With our easy-to-use and customizable templates, you can focus on delivering your ideas rather than worrying about formatting. With a variety of designs to choose from, you are sure to find one that suits your needs. And with animations and unique photos, illustrations, and fonts, you can make your presentation pop. So whether you are giving a sales pitch or presenting to the board, make sure to check out Slidegeeks first. The following slide showcases a histogram highlighting revenue projection of Software as a service SaaS company. It also provides information about compound annual growth rate CAGR along with key takeaways.
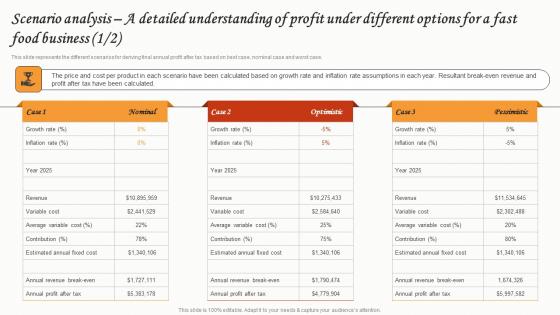
Scenario Analysis A Detailed Understanding Of Profit Small Restaurant Business Download Pdf
This slide represents the different scenarios for deriving final annual profit after tax based on best case, nominal case and worst case. Slidegeeks is here to make your presentations a breeze with Scenario Analysis A Detailed Understanding Of Profit Small Restaurant Business Download Pdf With our easy-to-use and customizable templates, you can focus on delivering your ideas rather than worrying about formatting. With a variety of designs to choose from, you are sure to find one that suits your needs. And with animations and unique photos, illustrations, and fonts, you can make your presentation pop. So whether you are giving a sales pitch or presenting to the board, make sure to check out Slidegeeks first. This slide represents the different scenarios for deriving final annual profit after tax based on best case, nominal case and worst case.
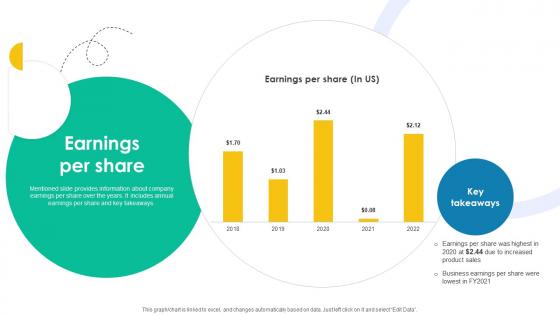
Earnings Per Share Medical Research And Development Company Profile CP SS V
Mentioned slide provides information about company earnings per share over the years. It includes annual earnings per share and key takeaways. Slidegeeks is here to make your presentations a breeze with Earnings Per Share Medical Research And Development Company Profile CP SS V With our easy-to-use and customizable templates, you can focus on delivering your ideas rather than worrying about formatting. With a variety of designs to choose from, you are sure to find one that suits your needs. And with animations and unique photos, illustrations, and fonts, you can make your presentation pop. So whether you are giving a sales pitch or presenting to the board, make sure to check out Slidegeeks first Mentioned slide provides information about company earnings per share over the years. It includes annual earnings per share and key takeaways.
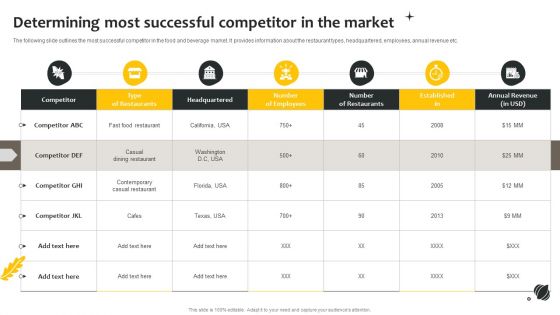
Effective Online And Offline Promotional Determining Most Successful Competitor In The Market Professional PDF
The following slide outlines the most successful competitor in the food and beverage market. It provides information about the restaurant types, headquartered, employees, annual revenue etc. Slidegeeks is here to make your presentations a breeze with Effective Online And Offline Promotional Determining Most Successful Competitor In The Market Professional PDF With our easy-to-use and customizable templates, you can focus on delivering your ideas rather than worrying about formatting. With a variety of designs to choose from, youre sure to find one that suits your needs. And with animations and unique photos, illustrations, and fonts, you can make your presentation pop. So whether youre giving a sales pitch or presenting to the board, make sure to check out Slidegeeks first.
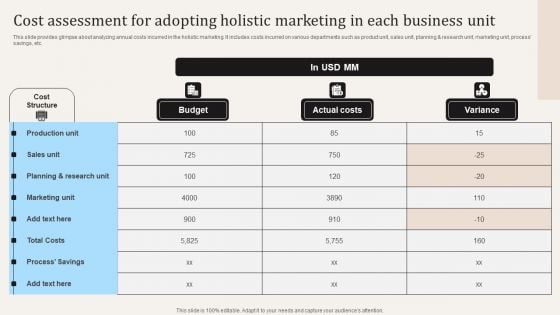
Cost Assessment For Adopting Holistic Marketing In Each Business Unit Ppt PowerPoint Presentation File Outline PDF
This slide provides glimpse about analyzing annual costs incurred in the holistic marketing. It includes costs incurred on various departments such as product unit, sales unit, planning and research unit, marketing unit, process savings, etc. Welcome to our selection of the Cost Assessment For Adopting Holistic Marketing In Each Business Unit Ppt PowerPoint Presentation File Outline PDF. These are designed to help you showcase your creativity and bring your sphere to life. Planning and Innovation are essential for any business that is just starting out. This collection contains the designs that you need for your everyday presentations. All of our PowerPoints are 100 percent editable, so you can customize them to suit your needs. This multi purpose template can be used in various situations. Grab these presentation templates today.
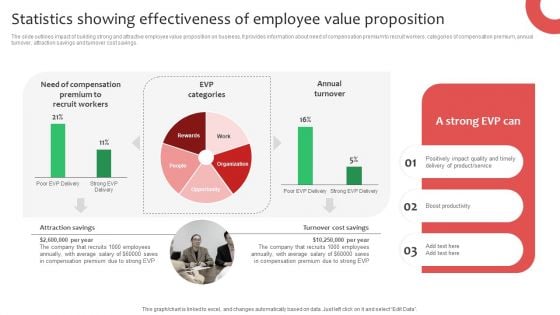
Statistics Showing Effectiveness Of Employee Value Proposition Ppt Layouts Example Introduction PDF
The slide outlines impact of building strong and attractive employee value proposition on business. It provides information about need of compensation premium to recruit workers, categories of compensation premium, annual turnover, attraction savings and turnover cost savings. Slidegeeks is here to make your presentations a breeze with Statistics Showing Effectiveness Of Employee Value Proposition Ppt Layouts Example Introduction PDF With our easy to use and customizable templates, you can focus on delivering your ideas rather than worrying about formatting. With a variety of designs to choose from, you are sure to find one that suits your needs. And with animations and unique photos, illustrations, and fonts, you can make your presentation pop. So whether you are giving a sales pitch or presenting to the board, make sure to check out Slidegeeks first.
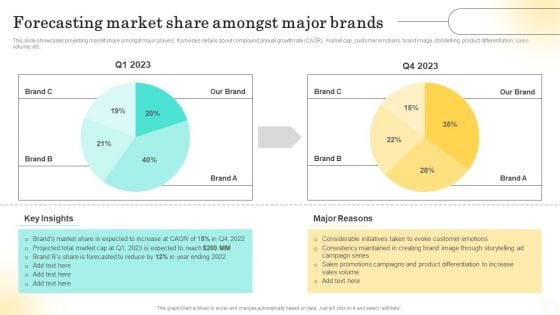
Emotional Marketing Strategy To Nurture Forecasting Market Share Amongst Major Brands Microsoft PDF
This slide showcases projecting market share amongst major players. It provides details about compound annual growth rate CAGR, market cap, customer emotions, brand image, storytelling, product differentiation, sales volume, etc. Explore a selection of the finest Emotional Marketing Strategy To Nurture Forecasting Market Share Amongst Major Brands Microsoft PDF here. With a plethora of professionally designed and pre-made slide templates, you can quickly and easily find the right one for your upcoming presentation. You can use our Emotional Marketing Strategy To Nurture Forecasting Market Share Amongst Major Brands Microsoft PDF to effectively convey your message to a wider audience. Slidegeeks has done a lot of research before preparing these presentation templates. The content can be personalized and the slides are highly editable. Grab templates today from Slidegeeks.
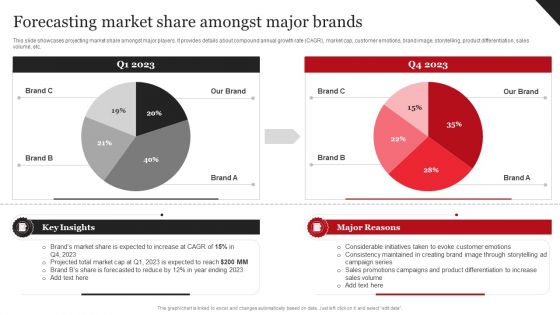
Coca Cola Emotional Marketing Strategy Forecasting Market Share Amongst Major Brands Pictures PDF
This slide showcases projecting market share amongst major players. It provides details about compound annual growth rate CAGR, market cap, customer emotions, brand image, storytelling, product differentiation, sales volume, etc. Coming up with a presentation necessitates that the majority of the effort goes into the content and the message you intend to convey. The visuals of a PowerPoint presentation can only be effective if it supplements and supports the story that is being told. Keeping this in mind our experts created Coca Cola Emotional Marketing Strategy Forecasting Market Share Amongst Major Brands Pictures PDF to reduce the time that goes into designing the presentation. This way, you can concentrate on the message while our designers take care of providing you with the right template for the situation.
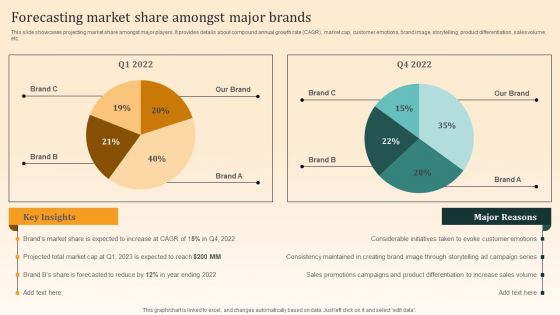
Nike Emotional Branding Strategy Forecasting Market Share Amongst Major Brands Microsoft PDF
This slide showcases projecting market share amongst major players. It provides details about compound annual growth rate CAGR, market cap, customer emotions, brand image, storytelling, product differentiation, sales volume, etc. Coming up with a presentation necessitates that the majority of the effort goes into the content and the message you intend to convey. The visuals of a PowerPoint presentation can only be effective if it supplements and supports the story that is being told. Keeping this in mind our experts created Nike Emotional Branding Strategy Forecasting Market Share Amongst Major Brands Microsoft PDF to reduce the time that goes into designing the presentation. This way, you can concentrate on the message while our designers take care of providing you with the right template for the situation.
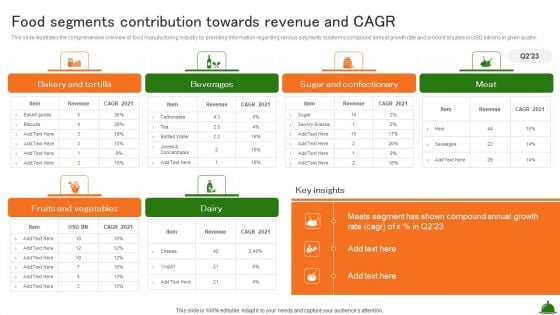
Food Segments Contribution Towards Revenue And Cagr Industry Analysis Of Food Elements PDF
This slide illustrates the comprehensive overview of food manufacturing industry by providing information regarding various segments subitems compound annual growth rate and amount of sales in USD billions in given quatre.Explore a selection of the finest Food Segments Contribution Towards Revenue And Cagr Industry Analysis Of Food Elements PDF here. With a plethora of professionally designed and pre-made slide templates, you can quickly and easily find the right one for your upcoming presentation. You can use our Food Segments Contribution Towards Revenue And Cagr Industry Analysis Of Food Elements PDF to effectively convey your message to a wider audience. Slidegeeks has done a lot of research before preparing these presentation templates. The content can be personalized and the slides are highly editable. Grab templates today from Slidegeeks.
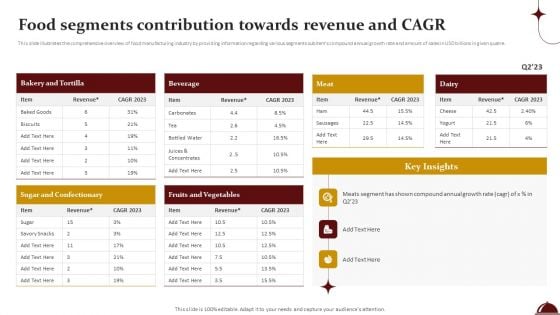
Food Processing Industry Latest Insights Trends And Analytics Food Segments Contribution Towards Revenue And Cagr Professional PDF
This slide illustrates the comprehensive overview of food manufacturing industry by providing information regarding various segments subitems compound annual growth rate and amount of sales in USD billions in given quatre. Slidegeeks is one of the best resources for PowerPoint templates. You can download easily and regulate Food Processing Industry Latest Insights Trends And Analytics Food Segments Contribution Towards Revenue And Cagr Professional PDF for your personal presentations from our wonderful collection. A few clicks is all it takes to discover and get the most relevant and appropriate templates. Use our Templates to add a unique zing and appeal to your presentation and meetings. All the slides are easy to edit and you can use them even for advertisement purposes.

Financial Comparison With Competitors Web Design And Development Company Profile Topics PDF
This slide covers the comparison with competitors on the basis of financials such as annual revenue, net profit, operating profits, EBITDA, market share and total projects completed in 2022 Slidegeeks is here to make your presentations a breeze with Financial Comparison With Competitors Web Design And Development Company Profile Topics PDF With our easy to use and customizable templates, you can focus on delivering your ideas rather than worrying about formatting. With a variety of designs to choose from, youre sure to find one that suits your needs. And with animations and unique photos, illustrations, and fonts, you can make your presentation pop. So whether you our giving a sales pitch or presenting to the board, make sure to check out Slidegeeks first.
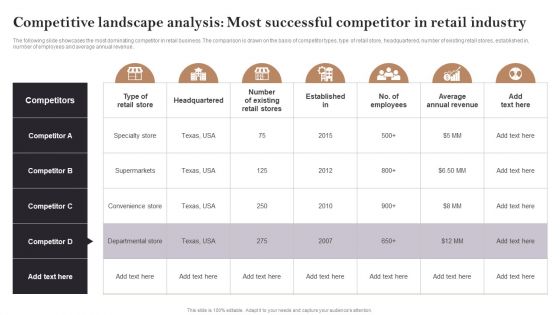
Competitive Landscape Analysis Most Successful Competitor In Retail Industry Ideas PDF
The following slide showcases the most dominating competitor in retail business. The comparison is drawn on the basis of competitor types, type of retail store, headquartered, number of existing retail stores, established in, number of employees and average annual revenue. Slidegeeks is here to make your presentations a breeze with Competitive Landscape Analysis Most Successful Competitor In Retail Industry Ideas PDF With our easy-to-use and customizable templates, you can focus on delivering your ideas rather than worrying about formatting. With a variety of designs to choose from, you are sure to find one that suits your needs. And with animations and unique photos, illustrations, and fonts, you can make your presentation pop. So whether you are giving a sales pitch or presenting to the board, make sure to check out Slidegeeks first.
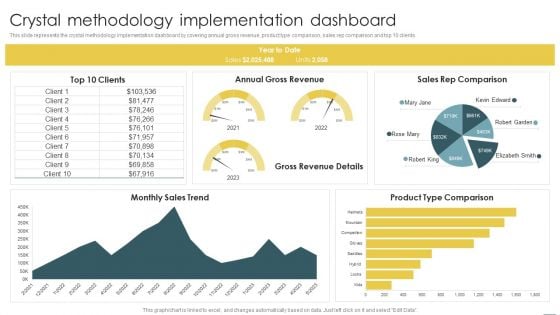
Crystal Methods In Agile Framework Crystal Methodology Implementation Dashboard Introduction PDF
This slide represents the crystal methodology implementation dashboard by covering annual gross revenue, product type comparison, sales rep comparison and top 10 clients. Here you can discover an assortment of the finest PowerPoint and Google Slides templates. With these templates, you can create presentations for a variety of purposes while simultaneously providing your audience with an eye catching visual experience. Download Crystal Methods In Agile Framework Crystal Methodology Implementation Dashboard Introduction PDF to deliver an impeccable presentation. These templates will make your job of preparing presentations much quicker, yet still, maintain a high level of quality. Slidegeeks has experienced researchers who prepare these templates and write high quality content for you. Later on, you can personalize the content by editing the Crystal Methods In Agile Framework Crystal Methodology Implementation Dashboard Introduction PDF.
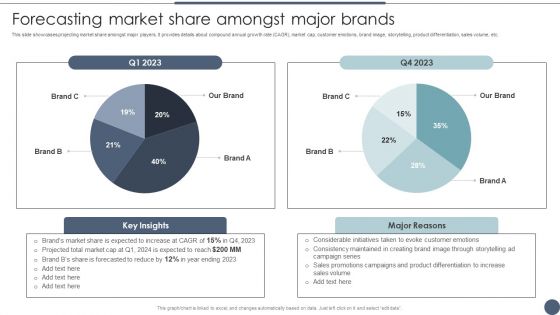
Forecasting Market Share Amongst Major Brands Utilizing Emotional And Rational Branding For Improved Consumer Themes PDF
This slide showcases projecting market share amongst major players. It provides details about compound annual growth rate CAGR, market cap, customer emotions, brand image, storytelling, product differentiation, sales volume, etc. This modern and well-arranged Forecasting Market Share Amongst Major Brands Utilizing Emotional And Rational Branding For Improved Consumer Themes PDF provides lots of creative possibilities. It is very simple to customize and edit with the Powerpoint Software. Just drag and drop your pictures into the shapes. All facets of this template can be edited with Powerpoint no extra software is necessary. Add your own material, put your images in the places assigned for them, adjust the colors, and then you can show your slides to the world, with an animated slide included.
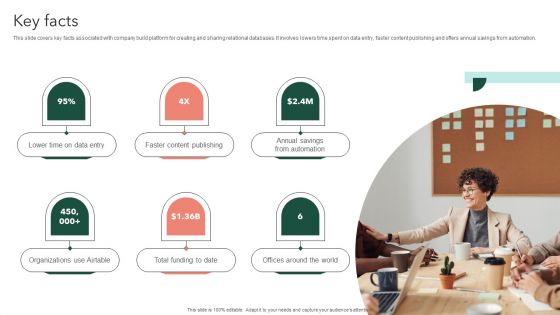
Airtable Capital Funding Pitch Deck Key Facts Portrait PDF
This slide covers key facts associated with company build platform for creating and sharing relational databases. It involves lowers time spent on data entry, faster content publishing and offers annual savings from automation. Slidegeeks is here to make your presentations a breeze with Airtable Capital Funding Pitch Deck Key Facts Portrait PDF With our easy to use and customizable templates, you can focus on delivering your ideas rather than worrying about formatting. With a variety of designs to choose from, you are sure to find one that suits your needs. And with animations and unique photos, illustrations, and fonts, you can make your presentation pop. So whether you are giving a sales pitch or presenting to the board, make sure to check out Slidegeeks first.
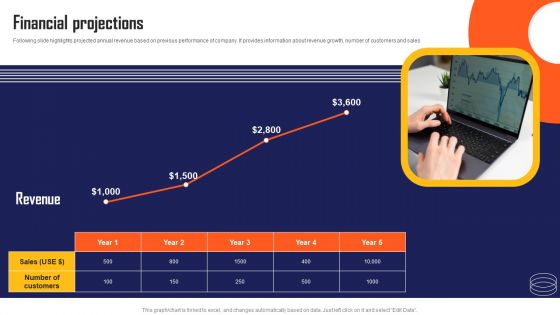
Marketing Automation App Fundraising Pitch Deck Financial Projections Ideas PDF
Following slide highlights projected annual revenue based on previous performance of company. It provides information about revenue growth, number of customers and sales Do you have to make sure that everyone on your team knows about any specific topic I yes, then you should give Marketing Automation App Fundraising Pitch Deck Financial Projections Ideas PDF a try. Our experts have put a lot of knowledge and effort into creating this impeccable Marketing Automation App Fundraising Pitch Deck Financial Projections Ideas PDF. You can use this template for your upcoming presentations, as the slides are perfect to represent even the tiniest detail. You can download these templates from the Slidegeeks website and these are easy to edit. So grab these today.
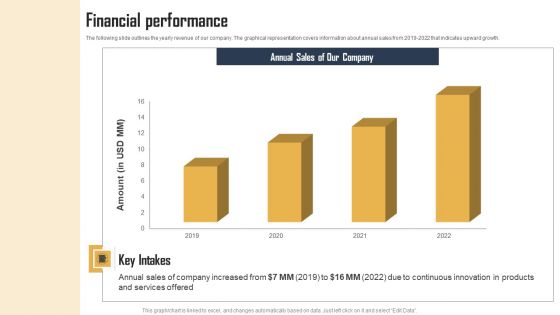
Ecommerce Photo Editing Services Fundraising Deck Financial Performance Demonstration PDF
The following slide outlines the yearly revenue of our company. The graphical representation covers information about annual sales from 2019-2022 that indicates upward growth. This Ecommerce Photo Editing Services Fundraising Deck Financial Performance Demonstration PDF from Slidegeeks makes it easy to present information on your topic with precision. It provides customization options, so you can make changes to the colors, design, graphics, or any other component to create a unique layout. It is also available for immediate download, so you can begin using it right away. Slidegeeks has done good research to ensure that you have everything you need to make your presentation stand out. Make a name out there for a brilliant performance.
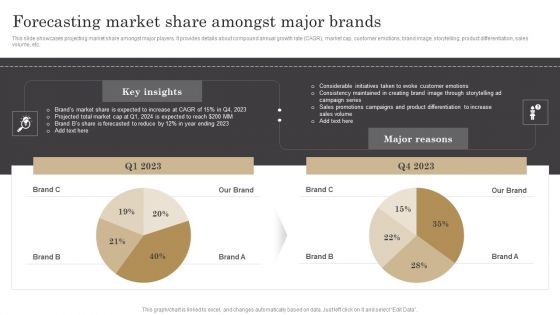
Forecasting Market Share Amongst Major Brands Ppt Show Visuals PDF
This slide showcases projecting market share amongst major players. It provides details about compound annual growth rate CAGR, market cap, customer emotions, brand image, storytelling, product differentiation, sales volume, etc. Explore a selection of the finest Forecasting Market Share Amongst Major Brands Ppt Show Visuals PDF here. With a plethora of professionally designed and pre made slide templates, you can quickly and easily find the right one for your upcoming presentation. You can use our Forecasting Market Share Amongst Major Brands Ppt Show Visuals PDF to effectively convey your message to a wider audience. Slidegeeks has done a lot of research before preparing these presentation templates. The content can be personalized and the slides are highly editable. Grab templates today from Slidegeeks.
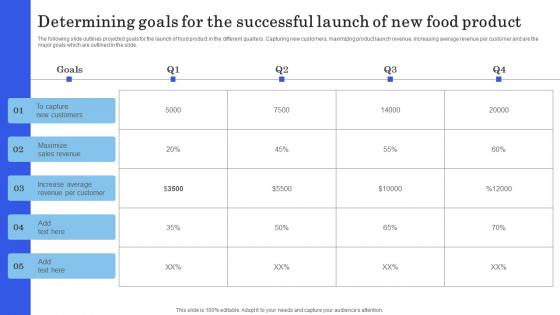
Launching New Commodity Determining Goals For The Successful Launch Of New Food Download Pdf
The following slide outlines projected goals for the launch of food product in the different quarters. Capturing new customers, maximizing product launch revenue, increasing average revenue per customer and are the major goals which are outlined in the slide. Slidegeeks is here to make your presentations a breeze with Launching New Commodity Determining Goals For The Successful Launch Of New Food Download Pdf With our easy-to-use and customizable templates, you can focus on delivering your ideas rather than worrying about formatting. With a variety of designs to choose from, you are sure to find one that suits your needs. And with animations and unique photos, illustrations, and fonts, you can make your presentation pop. So whether you are giving a sales pitch or presenting to the board, make sure to check out Slidegeeks first The following slide outlines projected goals for the launch of food product in the different quarters. Capturing new customers, maximizing product launch revenue, increasing average revenue per customer and are the major goals which are outlined in the slide.
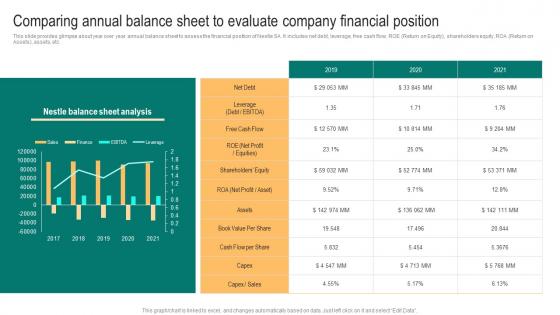
Packaged Food Business Comparing Annual Balance Sheet To Evaluate Company Ideas Pdf
This slide provides glimpse about year over year annual balance sheet to assess the financial position of Nestle SA. It includes net debt, leverage, free cash flow, ROE Return on Equity, shareholders equity, ROA Return on Assets, assets, etc. Slidegeeks is here to make your presentations a breeze with Packaged Food Business Comparing Annual Balance Sheet To Evaluate Company Ideas Pdf With our easy-to-use and customizable templates, you can focus on delivering your ideas rather than worrying about formatting. With a variety of designs to choose from, you are sure to find one that suits your needs. And with animations and unique photos, illustrations, and fonts, you can make your presentation pop. So whether you are giving a sales pitch or presenting to the board, make sure to check out Slidegeeks first This slide provides glimpse about year over year annual balance sheet to assess the financial position of Nestle SA. It includes net debt, leverage, free cash flow, ROE Return on Equity, shareholders equity, ROA Return on Assets, assets, etc.
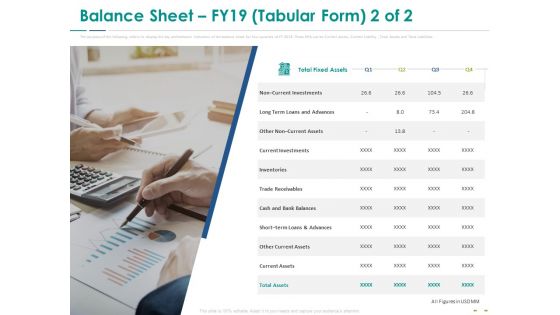
Stock Market Research Report Balance Sheet FY19 Tabular Form Investments Designs PDF
The purpose of the following slide is to display a tabular representation of the key performance indicators of the balance sheet for four quarters of FY 2019. These KPIs can be Current assets, Current Liability , Total Assets and Total Liabilities. This is a stock market research report balance sheet fy19 tabular form investments designs pdf template with various stages. Focus and dispense information on one stages using this creative set, that comes with editable features. It contains large content boxes to add your information on topics like non current investments, long term loans and advances, current investments, inventories, trade receivables. You can also showcase facts, figures, and other relevant content using this PPT layout. Grab it now.
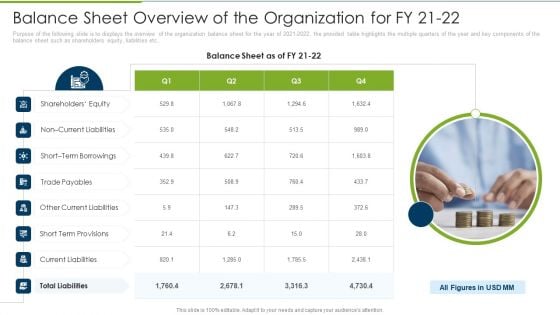
Debt Collection Improvement Plan Balance Sheet Overview Of The Organization For Fy 21 To 22 Themes PDF
Purpose of the following slide is to displays the overview of the organization balance sheet for the year of 2021-2022, the provided table highlights the multiple quarters of the year and key components of the balance sheet such as shareholders equity, liabilities etc. Presenting debt collection improvement plan balance sheet overview of the organization for fy 21 to 22 themes pdf to provide visual cues and insights. Share and navigate important information on four stages that need your due attention. This template can be used to pitch topics like shareholders equity, short term borrowings, trade payables, current liabilities, total liabilities. In addtion, this PPT design contains high resolution images, graphics, etc, that are easily editable and available for immediate download.
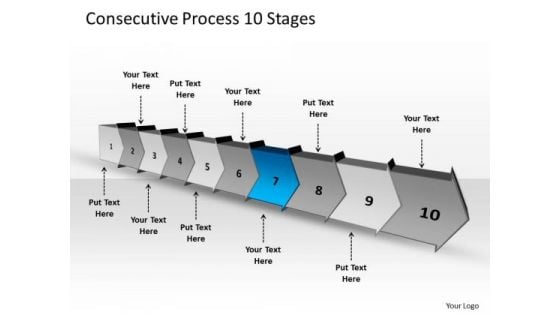
Consecutive Process 10 Stages Visio Flow Chart PowerPoint Slides
We present our consecutive process 10 stages vision flow chart PowerPoint Slides. Use our Marketing PowerPoint Templates because, Drive home your reasons and chart the path ahead to arrive at tour destination and achieve the goal. Use our Arrows PowerPoint Templates because, You have some exciting plans to spread goodwill among the underprivileged, Expound on your ideas and show to your colleagues how they can help others and in the process increase your Brand value. Use our Business PowerPoint Templates because, Marketing Strategy Business Template: - Maximizing sales of your product is the intended destination. Use our Process and Flows PowerPoint Templates because, your quicksilver ideas are the arrows in your quiver. Use our Leadership PowerPoint Templates because, expand on your plans to overcome such obstacles and reassure the team that they shall continue to roll along merrily. Use these PowerPoint slides for presentations relating to Advertising, arrow, background, banner, bookmark, card, choice, concept, creative, design, direction, flow, idea, illustration, info graphic, instruction, label, layout, marketing, modern, next, options, process, product, promotion, sequence, simple, step, symbol, template, triangle. The prominent colors used in the PowerPoint template are Blue, Gray, and White Cross all bridges easily with our Consecutive Process 10 Stages Visio Flow Chart PowerPoint Slides. You will come out on top.
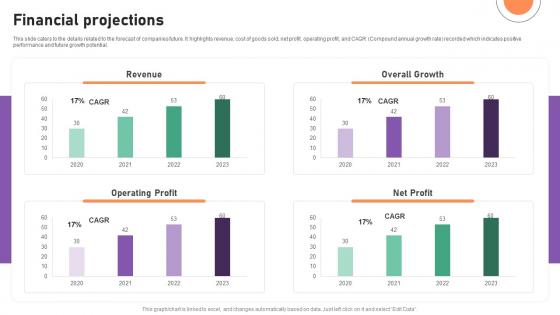
Financial Projections Financial Management Software Capital Raising Deck Sample Pdf
This slide caters to the details related to the forecast of companies future. It highlights revenue, cost of goods sold, net profit, operating profit, and CAGR Compound annual growth rate recorded which indicates positive performance and future growth potential. Slidegeeks is here to make your presentations a breeze with Financial Projections Financial Management Software Capital Raising Deck Sample Pdf With our easy to use and customizable templates, you can focus on delivering your ideas rather than worrying about formatting. With a variety of designs to choose from, you are sure to find one that suits your needs. And with animations and unique photos, illustrations, and fonts, you can make your presentation pop. So whether you are giving a sales pitch or presenting to the board, make sure to check out Slidegeeks first. This slide caters to the details related to the forecast of companies future. It highlights revenue, cost of goods sold, net profit, operating profit, and CAGR Compound annual growth rate recorded which indicates positive performance and future growth potential.
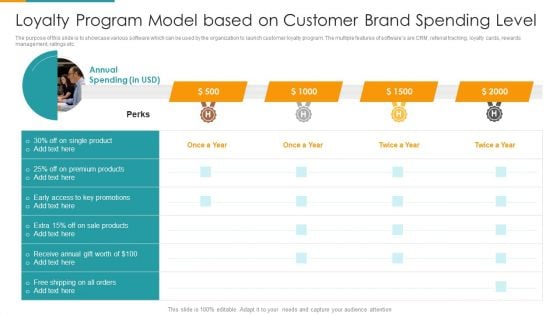
Loyalty Program Model Based On Customer Brand Spending Level Ppt PowerPoint Presentation Gallery Background Images PDF
The purpose of this slide is to showcase various software which can be used by the organization to launch customer loyalty program. The multiple features of softwares are CRM, referral tracking, loyalty cards, rewards management, ratings etc. Showcasing this set of slides titled loyalty program model based on customer brand spending level ppt powerpoint presentation gallery background images pdf. The topics addressed in these templates are annual spending, premium products, sale products. All the content presented in this PPT design is completely editable. Download it and make adjustments in color, background, font etc. as per your unique business setting.
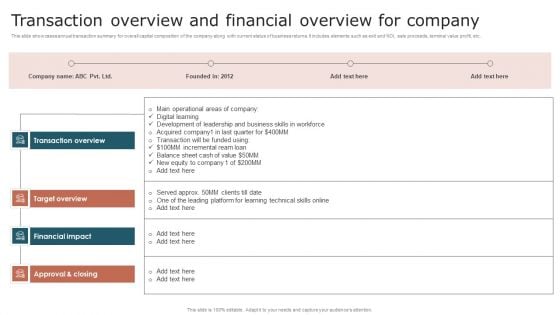
Transaction Overview And Financial Overview For Company Download PDF
This slide showcases annual transaction summary for overall capital composition of the company along with current status of business returns. It includes elements such as exit and NOI, sale proceeds, terminal value profit, etc. Showcasing this set of slides titled Transaction Overview And Financial Overview For Company Download PDF. The topics addressed in these templates are Target Overview, Financial Impact, Transaction Overview. All the content presented in this PPT design is completely editable. Download it and make adjustments in color, background, font etc. as per your unique business setting.
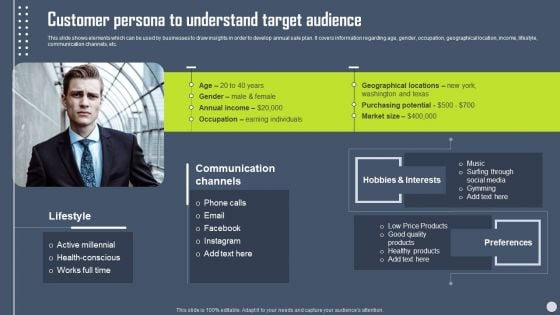
Boosting Yearly Business Revenue Customer Persona To Understand Target Audience Background PDF
This slide shows elements which can be used by businesses to draw insights in order to develop annual sale plan. It covers information regarding age, gender, occupation, geographical location, income, lifestyle, communication channels, etc. Crafting an eye-catching presentation has never been more straightforward. Let your presentation shine with this tasteful yet straightforward Boosting Yearly Business Revenue Customer Persona To Understand Target Audience Background PDF template. It offers a minimalistic and classy look that is great for making a statement. The colors have been employed intelligently to add a bit of playfulness while still remaining professional. Construct the ideal Boosting Yearly Business Revenue Customer Persona To Understand Target Audience Background PDF that effortlessly grabs the attention of your audience Begin now and be certain to wow your customers.
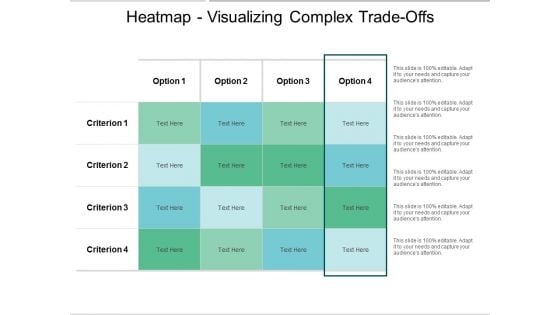
Heatmap Visualizing Complex Trade Offs Ppt PowerPoint Presentation Gallery Template
Presenting this set of slides with name heatmap visualizing complex trade offs ppt powerpoint presentation gallery template. The topics discussed in these slides are heat map, data analytics, business quarterly. This is a completely editable PowerPoint presentation and is available for immediate download. Download now and impress your audience.

Project Management Timeline Ppt PowerPoint Presentation Complete Deck With Slides
Presenting this set of slides with name project management timeline ppt powerpoint presentation complete deck with slides. The topics discussed in these slides are net income, management, timeline, quarterly, milestone. This is a completely editable PowerPoint presentation and is available for immediate download. Download now and impress your audience.
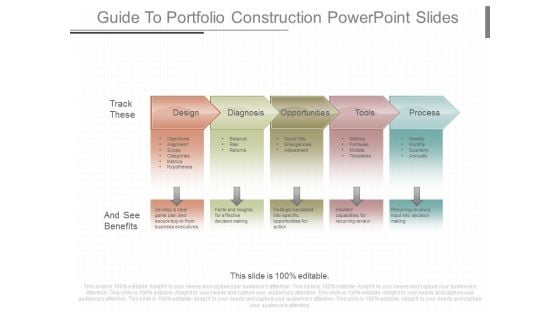
Guide To Portfolio Construction Powerpoint Slides
This is a guide to portfolio construction powerpoint slides. This is a five stage process. The stages in this process are design, diagnosis, opportunities, tools, process, objectives, alignment, scope, categories, metrics, hypotheses, balance, risk, returns, quick hits, emergencies, adjustment, metrics, formulas, models, templates, weekly, monthly, quarterly, annually, develop a clear game plan and secure buy in from business executives, facts and insights for effective decision making, findings translated into specific opportunities for action, installed capabilities for recurring review, recurring reviews, input into decision making, and see benefits, track these.
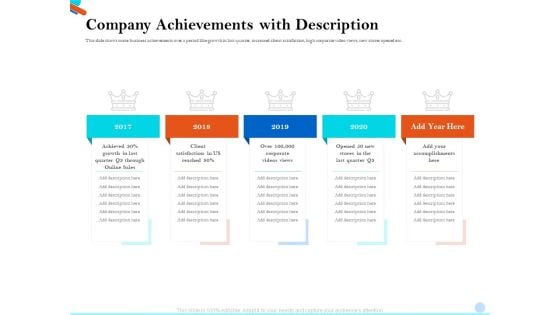
Pitch Presentation Raising Series C Funds Investment Company Achievements With Description Professional PDF
This slide shows some business achievements over a period like growth in last quarter, increased client satisfaction, high corporate video views, new stores opened etc. This is a pitch presentation raising series c funds investment company achievements with description professional pdf template with various stages. Focus and dispense information on four stages using this creative set, that comes with editable features. It contains large content boxes to add your information on topics like sales, growth, corporate, accomplishments. You can also showcase facts, figures, and other relevant content using this PPT layout. Grab it now.
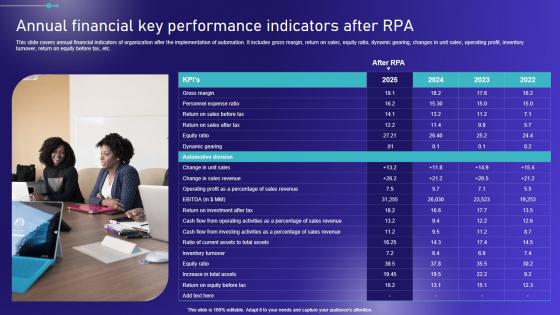
Annual Financial Key Performance Indicators After Embracing Robotic Process Elements PDF
This slide covers annual financial indicators of organization after the implementation of automation. It includes gross margin, return on sales, equity ratio, dynamic gearing, changes in unit sales, operating profit, inventory turnover, return on equity before tax, etc. Slidegeeks is one of the best resources for PowerPoint templates. You can download easily and regulate Annual Financial Key Performance Indicators After Embracing Robotic Process Elements PDF for your personal presentations from our wonderful collection. A few clicks is all it takes to discover and get the most relevant and appropriate templates. Use our Templates to add a unique zing and appeal to your presentation and meetings. All the slides are easy to edit and you can use them even for advertisement purposes. This slide covers annual financial indicators of organization after the implementation of automation. It includes gross margin, return on sales, equity ratio, dynamic gearing, changes in unit sales, operating profit, inventory turnover, return on equity before tax, etc.
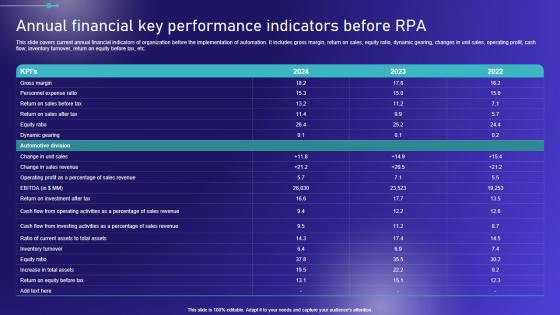
Annual Financial Key Performance Indicators Before Embracing Robotic Process Graphics PDF
This slide covers current annual financial indicators of organization before the implementation of automation. It includes gross margin, return on sales, equity ratio, dynamic gearing, changes in unit sales, operating profit, cash flow, inventory turnover, return on equity before tax, etc. Want to ace your presentation in front of a live audience Our Annual Financial Key Performance Indicators Before Embracing Robotic Process Graphics PDF can help you do that by engaging all the users towards you. Slidegeeks experts have put their efforts and expertise into creating these impeccable powerpoint presentations so that you can communicate your ideas clearly. Moreover, all the templates are customizable, and easy-to-edit and downloadable. Use these for both personal and commercial use. This slide covers current annual financial indicators of organization before the implementation of automation. It includes gross margin, return on sales, equity ratio, dynamic gearing, changes in unit sales, operating profit, cash flow, inventory turnover, return on equity before tax, etc.
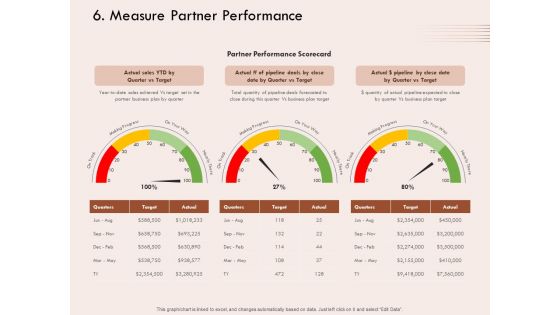
Steps Of Strategic Procurement Process Measure Partner Performance Ppt File Layout Ideas PDF
Presenting this set of slides with name steps of strategic procurement process measure partner performance ppt file layout ideas pdf. The topics discussed in these slides are target, quarter, business, plan. This is a completely editable PowerPoint presentation and is available for immediate download. Download now and impress your audience.
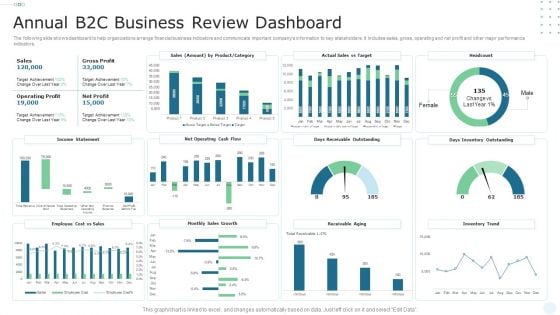
Annual B2C Business Review Dashboard Microsoft PDF
The following slide shows dashboard to help organizations arrange financial business indicators and communicate important companys information to key stakeholders. It includes sales, gross, operating and net profit and other major performance indicators. Showcasing this set of slides titled Annual B2C Business Review Dashboard Microsoft PDF. The topics addressed in these templates are Gross Profit, Sales, Operating Profit. All the content presented in this PPT design is completely editable. Download it and make adjustments in color, background, font etc. as per your unique business setting.
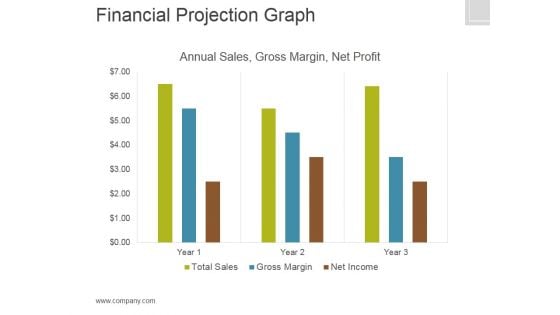
Financial Projection Graph Template 2 Ppt PowerPoint Presentation Graphics
This is a financial projection graph template 2 ppt powerpoint presentation graphics. This is a three stage process. The stages in this process are annual sales, gross margin, net profit, finance.
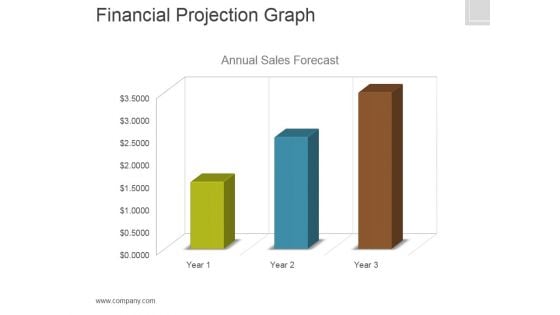
Financial Projection Graph Template 1 Ppt PowerPoint Presentation Clipart
This is a financial projection graph template 1 ppt powerpoint presentation clipart. This is a three stage process. The stages in this process are annual, sales, forecast, finance, marketing.
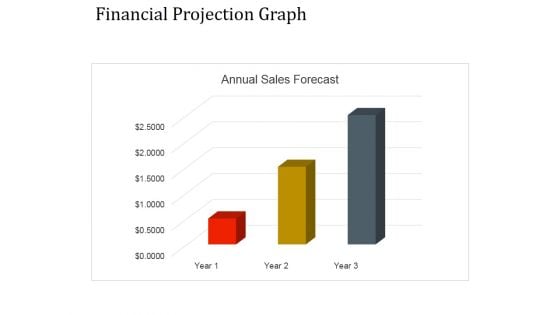
Financial Projection Graph Template 1 Ppt PowerPoint Presentation Graphics
This is a financial projection graph template 1 ppt powerpoint presentation graphics. This is a three stage process. The stages in this process are annual sales, business, management, marketing, strategy.
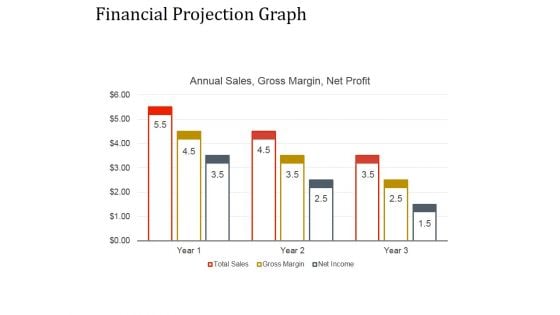
Financial Projection Graph Template 2 Ppt PowerPoint Presentation Ideas
This is a financial projection graph template 2 ppt powerpoint presentation ideas. This is a nine stage process. The stages in this process are annual sales, business, management, marketing, strategy.

Financial Projection Graph Template 1 Ppt PowerPoint Presentation Guide
This is a financial projection graph template 1 ppt powerpoint presentation guide. This is a three stage process. The stages in this process are annual sales, gross margin, net profit.
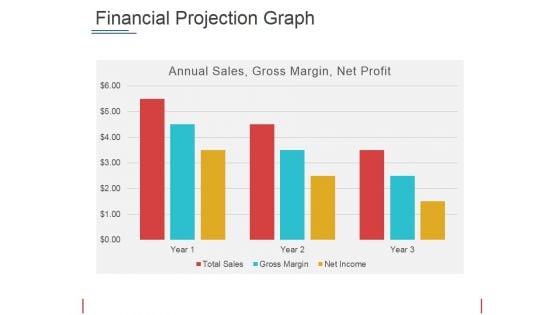
Financial Projection Graph Template 2 Ppt PowerPoint Presentation Show Picture
This is a financial projection graph template 2 ppt powerpoint presentation show picture. This is a three stage process. The stages in this process are annual sales, gross margin, net profit, years.
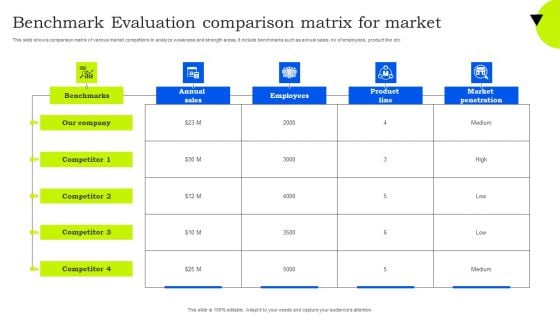
Benchmark Evaluation Comparison Matrix For Market Clipart PDF
This slide shows comparison matrix of various market competitors to analyze weakness and strength areas. It include benchmarks such as annual sales, no of employees, product line etc. Showcasing this set of slides titled Benchmark Evaluation Comparison Matrix For Market Clipart PDF. The topics addressed in these templates are Annual Sales, Employees, Product Line. All the content presented in this PPT design is completely editable. Download it and make adjustments in color, background, font etc. as per your unique business setting.
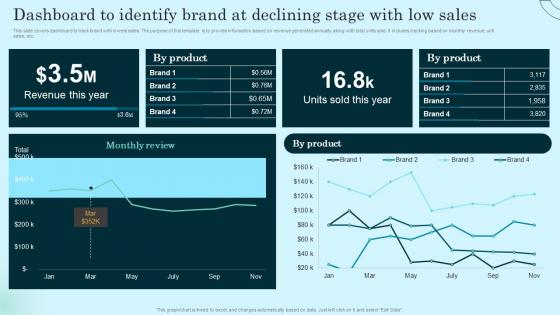
Dashboard To Identify Brand At Declining Stage Comprehensive Guide To Product Lifecycle Template Pdf
This slide covers dashboard to track brand with lowest sales. The purpose of this template is to provide information based on revenue generated annually along with total units sold. It includes tracking based on monthly revenue, unit sales, etc. From laying roadmaps to briefing everything in detail, our templates are perfect for you. You can set the stage with your presentation slides. All you have to do is download these easy to edit and customizable templates. Dashboard To Identify Brand At Declining Stage Comprehensive Guide To Product Lifecycle Template Pdf will help you deliver an outstanding performance that everyone would remember and praise you for. Do download this presentation today. This slide covers dashboard to track brand with lowest sales. The purpose of this template is to provide information based on revenue generated annually along with total units sold. It includes tracking based on monthly revenue, unit sales, etc.
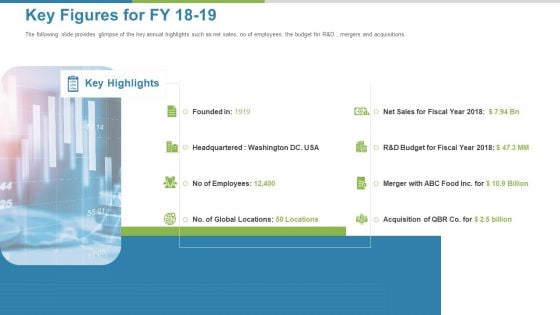
Work Execution Liability Key Figures For FY 18 To 19 Ppt Inspiration Graphics PDF
The following slide provides glimpse of the key annual highlights such as net sales, no of employees, the budget for R and D, mergers and acquisitions. Deliver an awe-inspiring pitch with this creative work execution liability key figures for fy 18 to 19 ppt inspiration graphics pdf bundle. Topics like global locations, net sales, budget, acquisition, headquartered can be discussed with this completely editable template. It is available for immediate download depending on the needs and requirements of the user.
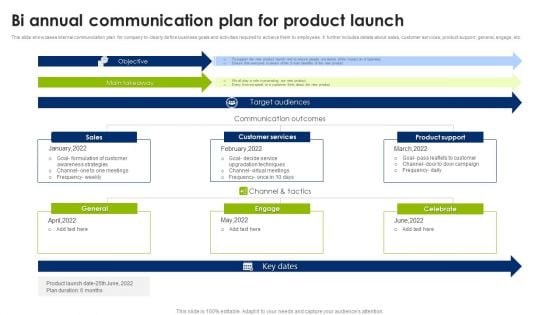
Bi Annual Communication Plan For Product Launch Infographics PDF
This slide showcases internal communication plan for company to clearly define business goals and activities required to achieve them to employees. It further includes details about sales, customer services, product support, general, engage, etc. Pitch your topic with ease and precision using this Bi Annual Communication Plan For Product Launch Infographics PDF. This layout presents information on Objective, Main Takeaway, Sales. It is also available for immediate download and adjustment. So, changes can be made in the color, design, graphics or any other component to create a unique layout.
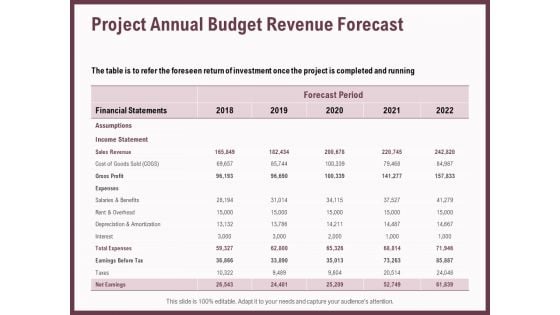
Elements Project Annual Budget Revenue Forecast Ppt Infographics Inspiration PDF
Deliver an awe inspiring pitch with this creative elements project annual budget revenue forecast ppt infographics inspiration pdf bundle. Topics like sales, revenue, interest, income, gross profit can be discussed with this completely editable template. It is available for immediate download depending on the needs and requirements of the user.

Analyzing Income Statement Annually To Monitor Business Customer Segmentation Clipart Pdf
This slide provides glimpse about year over year profit and loss statement to assess the profitability of Nestle SA. It includes net sales, EBITDA, operating profit, operating margin, pre-tax benefit, net income, net margin, etc. If your project calls for a presentation, then Slidegeeks is your go-to partner because we have professionally designed, easy-to-edit templates that are perfect for any presentation. After downloading, you can easily edit Analyzing Income Statement Annually To Monitor Business Customer Segmentation Clipart Pdf and make the changes accordingly. You can rearrange slides or fill them with different images. Check out all the handy templates This slide provides glimpse about year over year profit and loss statement to assess the profitability of Nestle SA. It includes net sales, EBITDA, operating profit, operating margin, pre-tax benefit, net income, net margin, etc.
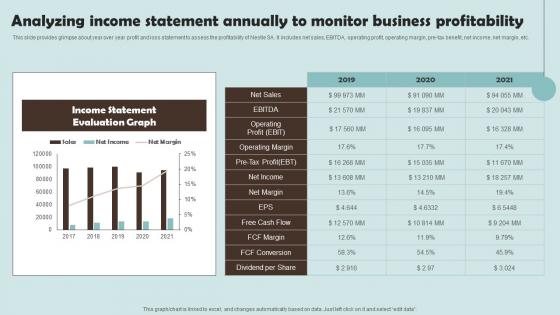
Analyzing Income Statement Annually To Monitor Outline Of Nestle Management Formats Pdf
This slide provides glimpse about year over year profit and loss statement to assess the profitability of Nestle SA. It includes net sales, EBITDA, operating profit, operating margin, pre-tax benefit, net income, net margin, etc.Slidegeeks is one of the best resources for PowerPoint templates. You can download easily and regulate Analyzing Income Statement Annually To Monitor Outline Of Nestle Management Formats Pdf for your personal presentations from our wonderful collection. A few clicks is all it takes to discover and get the most relevant and appropriate templates. Use our Templates to add a unique zing and appeal to your presentation and meetings. All the slides are easy to edit and you can use them even for advertisement purposes. This slide provides glimpse about year over year profit and loss statement to assess the profitability of Nestle SA. It includes net sales, EBITDA, operating profit, operating margin, pre tax benefit, net income, net margin, etc.
Annual Operative Action Plan For Organization Financials Summary Base Plan Icons PDF
Deliver and pitch your topic in the best possible manner with this annual operative action plan for organization financials summary base plan icons pdf. Use them to share invaluable insights on cost, sales, revenue, expense, acquisition and impress your audience. This template can be altered and modified as per your expectations. So, grab it now.
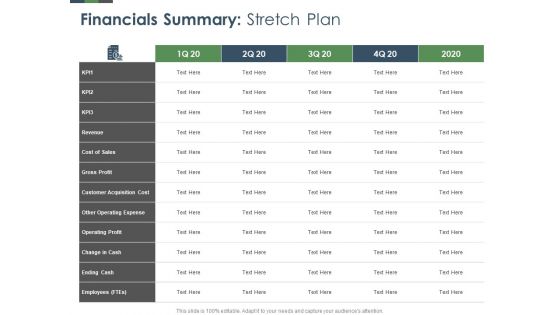
Annual Operative Action Plan For Organization Financials Summary Stretch Plan Clipart PDF
Deliver an awe inspiring pitch with this creative annual operative action plan for organization financials summary stretch plan clipart pdf bundle. Topics like cost, sales, revenue, expense, acquisition can be discussed with this completely editable template. It is available for immediate download depending on the needs and requirements of the user.

Chart Showing Staff Roles With Annual Compensation Ppt PowerPoint Presentation File Background Image PDF
Presenting this set of slides with name chart showing staff roles with annual compensation ppt powerpoint presentation file background image pdf. The topics discussed in these slides are sales, implementation, cost. This is a completely editable PowerPoint presentation and is available for immediate download. Download now and impress your audience.
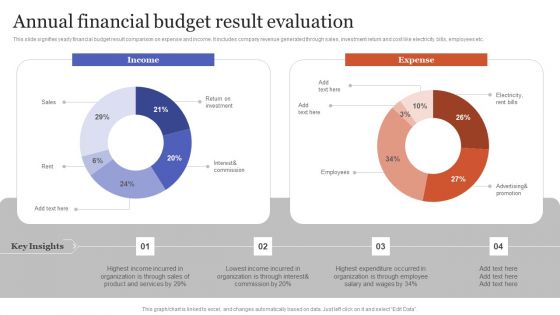
Annual Financial Budget Result Evaluation Brochure PDF
This slide signifies yearly financial budget result comparison on expense and income. It includes company revenue generated through sales, investment return and cost like electricity bills, employees etc.Showcasing this set of slides titled Annual Financial Budget Result Evaluation Brochure PDF. The topics addressed in these templates are Interest Commission, Return Investment, Advertising Promotion. All the content presented in this PPT design is completely editable. Download it and make adjustments in color, background, font etc. as per your unique business setting.
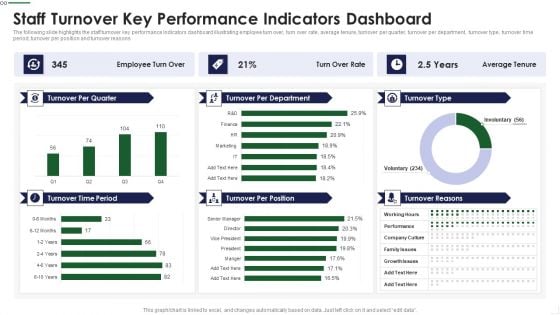
Staff Turnover Key Performance Indicators Dashboard Sample PDF
The following slide highlights the staff turnover key performance Indicators dashboard illustrating employee turn over, turn over rate, average tenure, turnover per quarter, turnover per department, turnover type, turnover time period, turnover per position and turnover reasons Deliver and pitch your topic in the best possible manner with this Staff Turnover Key Performance Indicators Dashboard Sample PDF Use them to share invaluable insights on Management Goals, Subjective Appraisal, Product Defects and impress your audience. This template can be altered and modified as per your expectations. So, grab it now.
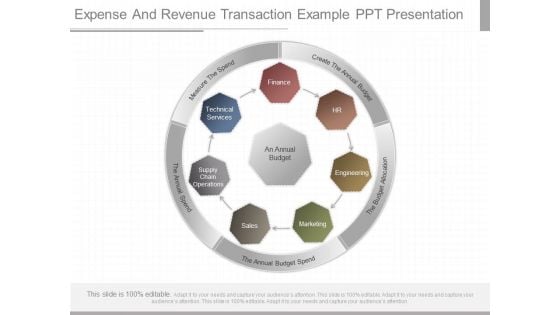
Expense And Revenue Transaction Example Ppt Presentation
This is a expense and revenue transaction example ppt presentation. This is a seven stage process. The stages in this process are an annual budget, create the annual budget, the budget allocation, the annual budget spend, the annual spend, measure the spend, finance, hr, engineering, marketing, sales, supply chain operations, technical services.
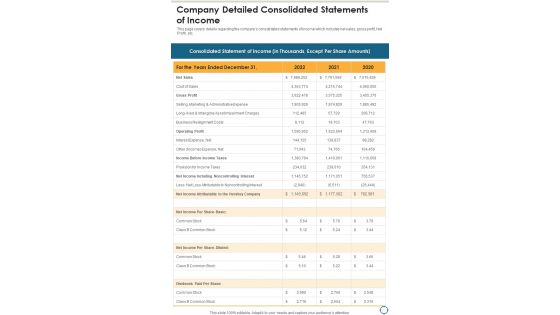
Company Detailed Consolidated Statements Of Income One Pager Documents
This page covers details regarding the companys consolidated statements of income which includes net sales, gross profit, Net Profit, etc. Presenting you a fantastic Company Detailed Consolidated Statements Of Income One Pager Documents. This piece is crafted on hours of research and professional design efforts to ensure you have the best resource. It is completely editable and its design allow you to rehash its elements to suit your needs. Get this Company Detailed Consolidated Statements Of Income One Pager Documents A4 One-pager now.

 Home
Home