statistics
Industry Statistics For AI Technology In Video Games Information Pdf
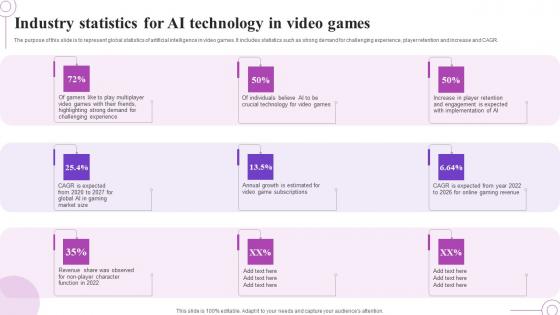
The purpose of this slide is to represent global statistics of artificial intelligence in video games. It includes statistics such as strong demand for challenging experience, player retention and increase and CAGR.Pitch your topic with ease and precision using this Industry Statistics For AI Technology In Video Games Information Pdf This layout presents information on Individuals Believe, Engagement Expected, Player Retention It is also available for immediate download and adjustment. So, changes can be made in the color, design, graphics or any other component to create a unique layout. The purpose of this slide is to represent global statistics of artificial intelligence in video games. It includes statistics such as strong demand for challenging experience, player retention and increase and CAGR.
Statistics Showcasing Robotic Process Automation With AI Market Download Pdf
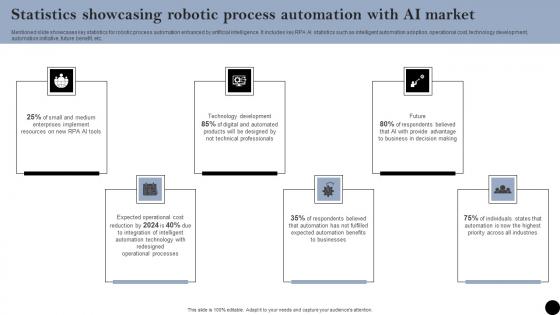
Mentioned slide showcases key statistics for robotic process automation enhanced by artificial intelligence. It includes key RPA AI statistics such as intelligent automation adoption, operational cost, technology development, automation initiative, future benefit, etc. Pitch your topic with ease and precision using this Statistics Showcasing Robotic Process Automation With AI Market Download Pdf. This layout presents information on Technology Development, Automation Initiative, Future Benefit. It is also available for immediate download and adjustment. So, changes can be made in the color, design, graphics or any other component to create a unique layout. Mentioned slide showcases key statistics for robotic process automation enhanced by artificial intelligence. It includes key RPA AI statistics such as intelligent automation adoption, operational cost, technology development, automation initiative, future benefit, etc.
Key Statistics Automotive Manufacturing Company Profile CP SS V
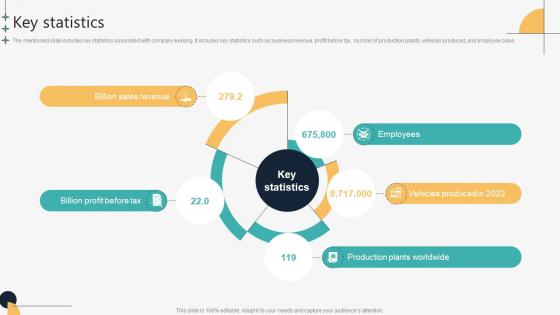
The mentioned slide includes key statistics associated with company working. It includes key statistics such as business revenue, profit before tax, number of production plants, vehicles produced, and employee base.Welcome to our selection of the Key Statistics Automotive Manufacturing Company Profile CP SS V. These are designed to help you showcase your creativity and bring your sphere to life. Planning and Innovation are essential for any business that is just starting out. This collection contains the designs that you need for your everyday presentations. All of our PowerPoints are 100 percent editable, so you can customize them to suit your needs. This multi-purpose template can be used in various situations. Grab these presentation templates today. The mentioned slide includes key statistics associated with company working. It includes key statistics such as business revenue, profit before tax, number of production plants, vehicles produced, and employee base.
Key Statistics Automobile Development Company Profile CP SS V
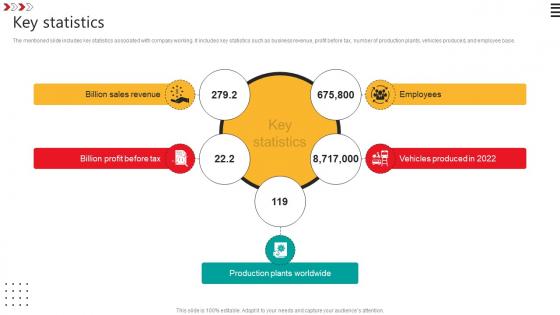
The mentioned slide includes key statistics associated with company working. It includes key statistics such as business revenue, profit before tax, number of production plants, vehicles produced, and employee base.Welcome to our selection of the Key Statistics Automobile Development Company Profile CP SS V. These are designed to help you showcase your creativity and bring your sphere to life. Planning and Innovation are essential for any business that is just starting out. This collection contains the designs that you need for your everyday presentations. All of our PowerPoints are 100 percent editable, so you can customize them to suit your needs. This multi-purpose template can be used in various situations. Grab these presentation templates today. The mentioned slide includes key statistics associated with company working. It includes key statistics such as business revenue, profit before tax, number of production plants, vehicles produced, and employee base.
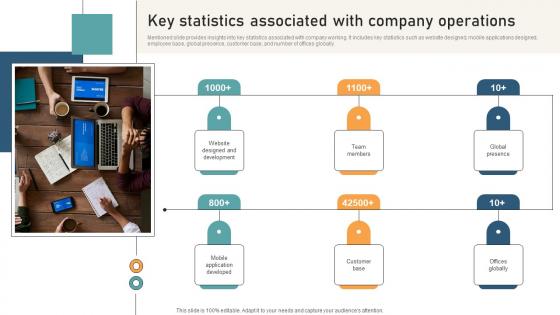
Comprehensive Guide For Website Key Statistics Associated With Company Operations
Mentioned slide provides insights into key statistics associated with company working. It includes key statistics such as website designed, mobile applications designed, employee base, global presence, customer base, and number of offices globally. Slidegeeks is one of the best resources for PowerPoint templates. You can download easily and regulate Comprehensive Guide For Website Key Statistics Associated With Company Operations for your personal presentations from our wonderful collection. A few clicks is all it takes to discover and get the most relevant and appropriate templates. Use our Templates to add a unique zing and appeal to your presentation and meetings. All the slides are easy to edit and you can use them even for advertisement purposes. Mentioned slide provides insights into key statistics associated with company working. It includes key statistics such as website designed, mobile applications designed, employee base, global presence, customer base, and number of offices globally.
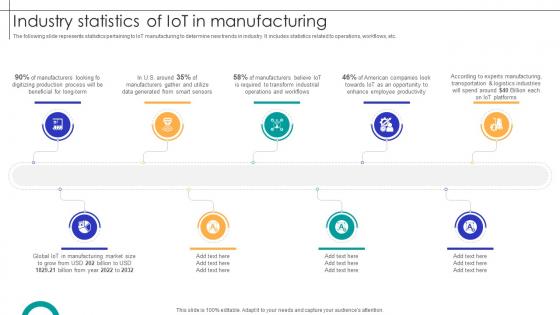
Industry Statistics Of IOT In Manufacturing Streamlining Production Ppt Sample
The following slide represents statistics pertaining to IoT manufacturing to determine new trends in industry. It includes statistics related to operations, workflows, etc. This Industry Statistics Of IOT In Manufacturing Streamlining Production Ppt Sample from Slidegeeks makes it easy to present information on your topic with precision. It provides customization options, so you can make changes to the colors, design, graphics, or any other component to create a unique layout. It is also available for immediate download, so you can begin using it right away. Slidegeeks has done good research to ensure that you have everything you need to make your presentation stand out. Make a name out there for a brilliant performance. The following slide represents statistics pertaining to IoT manufacturing to determine new trends in industry. It includes statistics related to operations, workflows, etc.
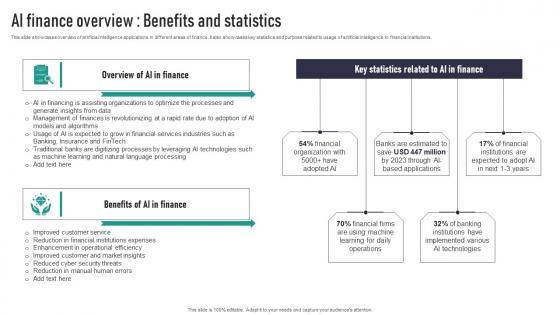
AI Finance Overview Benefits And Statistics Microsoft Pdf
This slide showcases overview of artificial intelligence applications in different areas of finance. It also showcases key statistics and purpose related to usage of artificial intelligence in financial institutions. Find highly impressive AI Finance Overview Benefits And Statistics Microsoft Pdf on Slidegeeks to deliver a meaningful presentation. You can save an ample amount of time using these presentation templates. No need to worry to prepare everything from scratch because Slidegeeks experts have already done a huge research and work for you. You need to download AI Finance Overview Benefits And Statistics Microsoft Pdf for your upcoming presentation. All the presentation templates are 100 percent editable and you can change the color and personalize the content accordingly. Download now This slide showcases overview of artificial intelligence applications in different areas of finance. It also showcases key statistics and purpose related to usage of artificial intelligence in financial institutions.
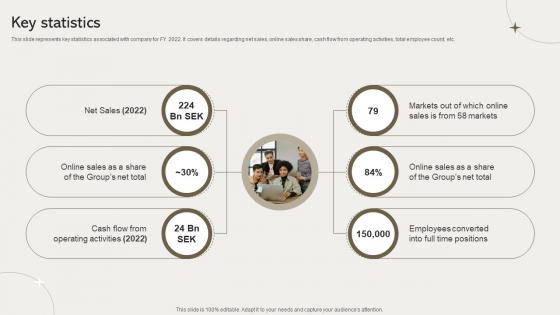
Key Statistics Clothing Retailer Company Profile CP SS V
This slide represents key statistics associated with company for FY 2022. It covers details regarding net sales, online sales share, cash flow from operating activities, total employee count, etc. Formulating a presentation can take up a lot of effort and time, so the content and message should always be the primary focus. The visuals of the PowerPoint can enhance the presenters message, so our Key Statistics Clothing Retailer Company Profile CP SS V was created to help save time. Instead of worrying about the design, the presenter can concentrate on the message while our designers work on creating the ideal templates for whatever situation is needed. Slidegeeks has experts for everything from amazing designs to valuable content, we have put everything into Key Statistics Clothing Retailer Company Profile CP SS V. This slide represents key statistics associated with company for FY 2022. It covers details regarding net sales, online sales share, cash flow from operating activities, total employee count, etc.
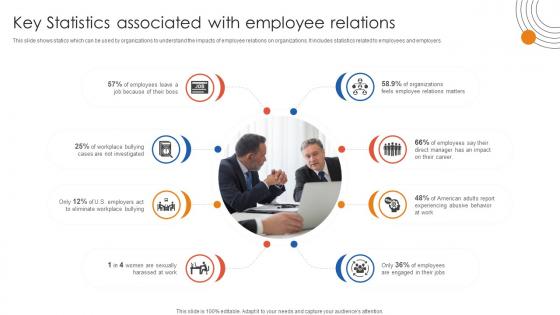
Human Resource Industrial Relationship Key Statistics Associated With Employee Relations
This slide shows statics which can be used by organizations to understand the impacts of employee relations on organizations. It includes statistics related to employees and employers. This Human Resource Industrial Relationship Key Statistics Associated With Employee Relations is perfect for any presentation, be it in front of clients or colleagues. It is a versatile and stylish solution for organizing your meetings. The Human Resource Industrial Relationship Key Statistics Associated With Employee Relations features a modern design for your presentation meetings. The adjustable and customizable slides provide unlimited possibilities for acing up your presentation. Slidegeeks has done all the homework before launching the product for you. So, do not wait, grab the presentation templates today This slide shows statics which can be used by organizations to understand the impacts of employee relations on organizations. It includes statistics related to employees and employers.
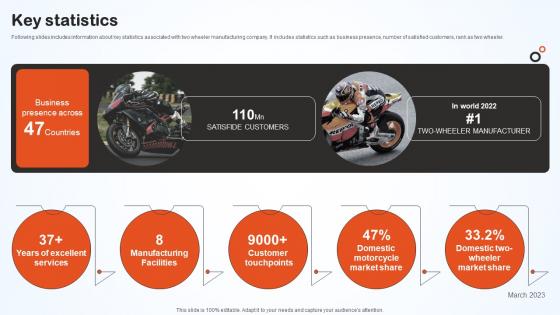
Key Statistics Hero Bike Company Profile CP SS V
Following slides includes information about key statistics associated with two wheeler manufacturing company. It includes statistics such as business presence, number of satisfied customers, rank as two wheeler. Explore a selection of the finest Key Statistics Hero Bike Company Profile CP SS V here. With a plethora of professionally designed and pre-made slide templates, you can quickly and easily find the right one for your upcoming presentation. You can use our Key Statistics Hero Bike Company Profile CP SS V to effectively convey your message to a wider audience. Slidegeeks has done a lot of research before preparing these presentation templates. The content can be personalized and the slides are highly editable. Grab templates today from Slidegeeks. Following slides includes information about key statistics associated with two wheeler manufacturing company. It includes statistics such as business presence, number of satisfied customers, rank as two wheeler.

Managing Technical And Non Key Statistics Associated With Company Operations
Mentioned slide provides insights into key statistics associated with company working. It includes key statistics such as website designed, mobile applications designed, employee base, global presence, customer base, and number of offices globally. Here you can discover an assortment of the finest PowerPoint and Google Slides templates. With these templates, you can create presentations for a variety of purposes while simultaneously providing your audience with an eye-catching visual experience. Download Managing Technical And Non Key Statistics Associated With Company Operations to deliver an impeccable presentation. These templates will make your job of preparing presentations much quicker, yet still, maintain a high level of quality. Slidegeeks has experienced researchers who prepare these templates and write high-quality content for you. Later on, you can personalize the content by editing the Managing Technical And Non Key Statistics Associated With Company Operations. Mentioned slide provides insights into key statistics associated with company working. It includes key statistics such as website designed, mobile applications designed, employee base, global presence, customer base, and number of offices globally.
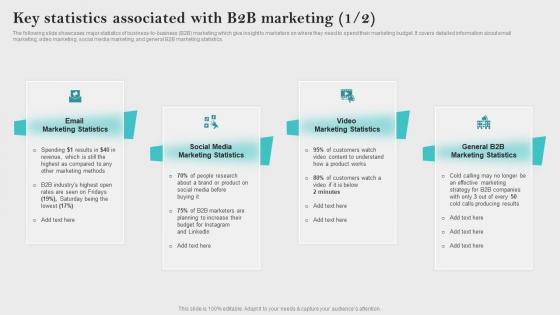
Key Statistics Associated With Innovative Business Promotion Ideas Demonstration Pdf
The following slide showcases major statistics of business to business B2B marketing which give insight to marketers on where they need to spend their marketing budget. It covers detailed information about email marketing, video marketing, social media marketing, and general B2B marketing statistics. Presenting this PowerPoint presentation, titled Key Statistics Associated With Innovative Business Promotion Ideas Demonstration Pdf, with topics curated by our researchers after extensive research. This editable presentation is available for immediate download and provides attractive features when used. Download now and captivate your audience. Presenting this Key Statistics Associated With Innovative Business Promotion Ideas Demonstration Pdf. Our researchers have carefully researched and created these slides with all aspects taken into consideration. This is a completely customizable Key Statistics Associated With Innovative Business Promotion Ideas Demonstration Pdf that is available for immediate downloading. Download now and make an impact on your audience. Highlight the attractive features available with our PPTs. The following slide showcases major statistics of business to business B2B marketing which give insight to marketers on where they need to spend their marketing budget. It covers detailed information about email marketing, video marketing, social media marketing, and general B2B marketing statistics.
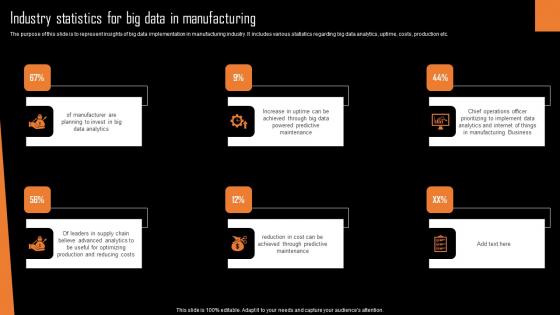
Industry Statistics For Big Data In Manufacturing Formats Pdf
The purpose of this slide is to represent insights of big data implementation in manufacturing industry. It includes various statistics regarding big data analytics, uptime, costs, production etc.Pitch your topic with ease and precision using this Industry Statistics For Big Data In Manufacturing Formats Pdf This layout presents information on Manufacturing Business, Prioritizing Implement Data, Chief Operations It is also available for immediate download and adjustment. So, changes can be made in the color, design, graphics or any other component to create a unique layout. The purpose of this slide is to represent insights of big data implementation in manufacturing industry. It includes various statistics regarding big data analytics, uptime, costs, production etc
Big Data Use Statistics Icon Ppt Ideas Layouts pdf
Pitch your topic with ease and precision using this Big Data Use Statistics Icon Ppt Ideas Layouts pdf. This layout presents information on Big Data, Use Statistics, Icon. It is also available for immediate download and adjustment. So, changes can be made in the color, design, graphics or any other component to create a unique layout. Our Big Data Use Statistics Icon Ppt Ideas Layouts pdf are topically designed to provide an attractive backdrop to any subject. Use them to look like a presentation pro.
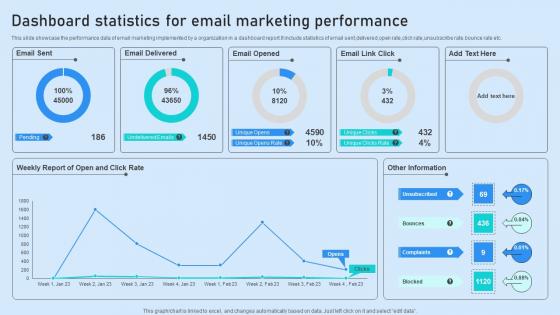
Dashboard Statistics For Email Marketing Performance Guidelines Pdf
This slide showcase the performance data of email marketing implemented by a organization in a dashboard report.It include statistics of email sent,delivered,open rate,click rate,unsubscribe rate,bounce rate etc. Showcasing this set of slides titled Dashboard Statistics For Email Marketing Performance Guidelines Pdf. The topics addressed in these templates are Email Delivered, Email Opened, Performance. All the content presented in this PPT design is completely editable. Download it and make adjustments in color, background, font etc. as per your unique business setting. This slide showcase the performance data of email marketing implemented by a organization in a dashboard report.It include statistics of email sent,delivered,open rate,click rate,unsubscribe rate,bounce rate etc.
Descriptive Statistics In Powerpoint And Google Slides Cpb
Presenting our innovatively designed set of slides titled Descriptive Statistics In Powerpoint And Google Slides Cpb. This completely editable PowerPoint graphic exhibits Descriptive Statistics that will help you convey the message impactfully. It can be accessed with Google Slides and is available in both standard screen and widescreen aspect ratios. Apart from this, you can download this well structured PowerPoint template design in different formats like PDF, JPG, and PNG. So, click the download button now to gain full access to this PPT design. Our Descriptive Statistics In Powerpoint And Google Slides Cpb are topically designed to provide an attractive backdrop to any subject. Use them to look like a presentation pro.
Descriptive Statistics Financial In Powerpoint And Google Slides Cpb
Presenting our innovatively-designed set of slides titled Descriptive Statistics Financial In Powerpoint And Google Slides Cpb. This completely editable PowerPoint graphic exhibits Descriptive Statistics Financial that will help you convey the message impactfully. It can be accessed with Google Slides and is available in both standard screen and widescreen aspect ratios. Apart from this, you can download this well-structured PowerPoint template design in different formats like PDF, JPG, and PNG. So, click the download button now to gain full access to this PPT design. Our Descriptive Statistics Financial In Powerpoint And Google Slides Cpb are topically designed to provide an attractive backdrop to any subject. Use them to look like a presentation pro.
Dyslexia Statistics In Powerpoint And Google Slides Cpb
Presenting our innovatively designed set of slides titled Dyslexia Statistics In Powerpoint And Google Slides Cpb. This completely editable PowerPoint graphic exhibits Dyslexia Statistics that will help you convey the message impactfully. It can be accessed with Google Slides and is available in both standard screen and widescreen aspect ratios. Apart from this, you can download this well structured PowerPoint template design in different formats like PDF, JPG, and PNG. So, click the download button now to gain full access to this PPT design. Our Dyslexia Statistics In Powerpoint And Google Slides Cpb are topically designed to provide an attractive backdrop to any subject. Use them to look like a presentation pro.
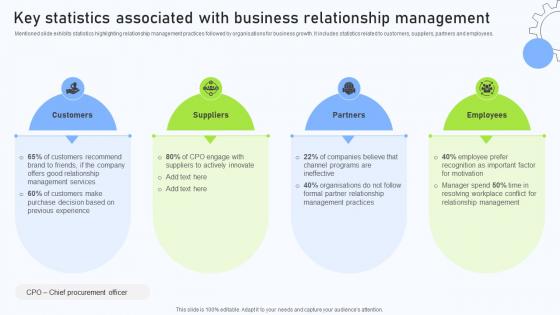
Relationship Management Automation Key Statistics Associated With Business Relationship
Mentioned slide exhibits statistics highlighting relationship management practices followed by organisations for business growth. It includes statistics related to customers, suppliers, partners and employees. This modern and well-arranged Relationship Management Automation Key Statistics Associated With Business Relationship provides lots of creative possibilities. It is very simple to customize and edit with the Powerpoint Software. Just drag and drop your pictures into the shapes. All facets of this template can be edited with Powerpoint, no extra software is necessary. Add your own material, put your images in the places assigned for them, adjust the colors, and then you can show your slides to the world, with an animated slide included. Mentioned slide exhibits statistics highlighting relationship management practices followed by organisations for business growth. It includes statistics related to customers, suppliers, partners and employees.
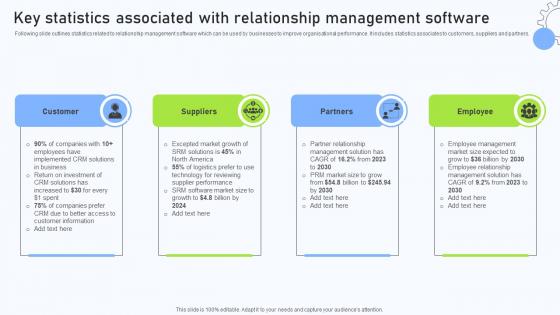
Relationship Management Automation Software Key Statistics Associated With Relationship
Following slide outlines statistics related to relationship management software which can be used by businesses to improve organisational performance. It includes statistics associates to customers, suppliers and partners. Want to ace your presentation in front of a live audience Our Relationship Management Automation Software Key Statistics Associated With Relationship can help you do that by engaging all the users towards you. Slidegeeks experts have put their efforts and expertise into creating these impeccable powerpoint presentations so that you can communicate your ideas clearly. Moreover, all the templates are customizable, and easy-to-edit and downloadable. Use these for both personal and commercial use. Following slide outlines statistics related to relationship management software which can be used by businesses to improve organisational performance. It includes statistics associates to customers, suppliers and partners.
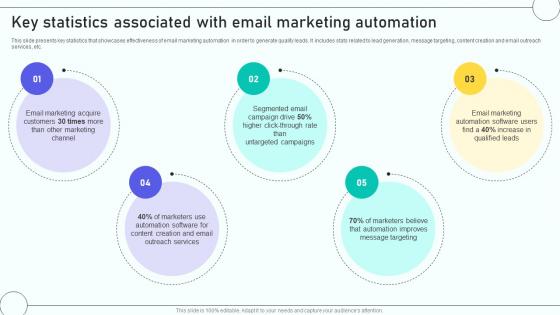
Email Marketing Automation Process Key Statistics Associated With Email Marketing
This slide presents key statistics that showcases effectiveness of email marketing automation in order to generate quality leads. It includes stats related to lead generation, message targeting, content creation and email outreach services, etc. This Email Marketing Automation Process Key Statistics Associated With Email Marketing is perfect for any presentation, be it in front of clients or colleagues. It is a versatile and stylish solution for organizing your meetings. The Email Marketing Automation Process Key Statistics Associated With Email Marketing features a modern design for your presentation meetings. The adjustable and customizable slides provide unlimited possibilities for acing up your presentation. Slidegeeks has done all the homework before launching the product for you. So, do not wait, grab the presentation templates today This slide presents key statistics that showcases effectiveness of email marketing automation in order to generate quality leads. It includes stats related to lead generation, message targeting, content creation and email outreach services, etc.
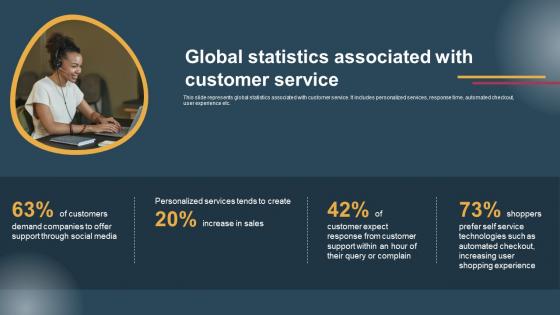
Global Statistics Associated Conversion Of Customer Support Services Formats Pdf
This slide represents global statistics associated with customer service. It includes personalized services, response time, automated checkout, user experience etc. Find highly impressive Global Statistics Associated Conversion Of Customer Support Services Formats Pdf on Slidegeeks to deliver a meaningful presentation. You can save an ample amount of time using these presentation templates. No need to worry to prepare everything from scratch because Slidegeeks experts have already done a huge research and work for you. You need to download Global Statistics Associated Conversion Of Customer Support Services Formats Pdf for your upcoming presentation. All the presentation templates are 100 percent editable and you can change the color and personalize the content accordingly. Download now. This slide represents global statistics associated with customer service. It includes personalized services, response time, automated checkout, user experience etc.
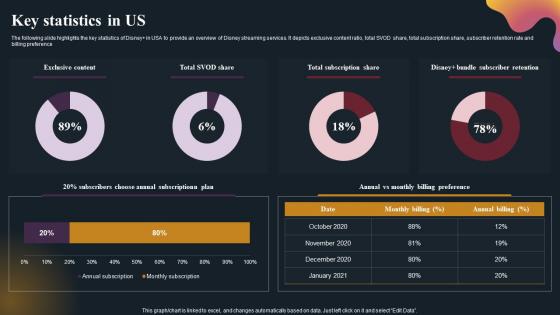
Key Statistics In Us OTT Platform Company Outline Brochure Pdf
The following slide highlights the key statistics of DisneyPlus in USA to provide an overview of Disney streaming services. It depicts exclusive content ratio, total SVOD share, total subscription share, subscriber retention rate and billing preference. Crafting an eye-catching presentation has never been more straightforward. Let your presentation shine with this tasteful yet straightforward Key Statistics In Us OTT Platform Company Outline Brochure Pdf template. It offers a minimalistic and classy look that is great for making a statement. The colors have been employed intelligently to add a bit of playfulness while still remaining professional. Construct the ideal Key Statistics In Us OTT Platform Company Outline Brochure Pdf that effortlessly grabs the attention of your audience Begin now and be certain to wow your customers The following slide highlights the key statistics of DisneyPlus in USA to provide an overview of Disney streaming services. It depicts exclusive content ratio, total SVOD share, total subscription share, subscriber retention rate and billing preference
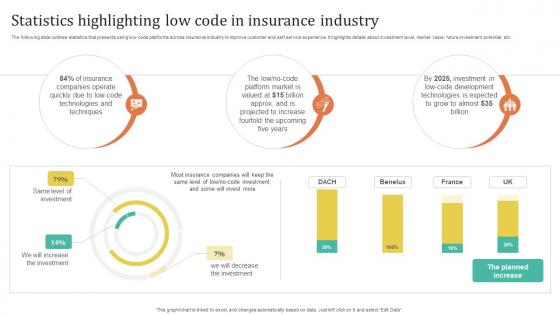
Improving Customer Satisfaction Statistics Highlighting Low Code In Insurance Industry
The following slide outlines statistics that presents using low code platforms across insurance industry to improve customer and self service experience. It highlights details about investment level, market value, future investment potential, etc. Find highly impressive Improving Customer Satisfaction Statistics Highlighting Low Code In Insurance Industry on Slidegeeks to deliver a meaningful presentation. You can save an ample amount of time using these presentation templates. No need to worry to prepare everything from scratch because Slidegeeks experts have already done a huge research and work for you. You need to download Improving Customer Satisfaction Statistics Highlighting Low Code In Insurance Industry for your upcoming presentation. All the presentation templates are 100 percent editable and you can change the color and personalize the content accordingly. Download now The following slide outlines statistics that presents using low code platforms across insurance industry to improve customer and self service experience. It highlights details about investment level, market value, future investment potential, etc.
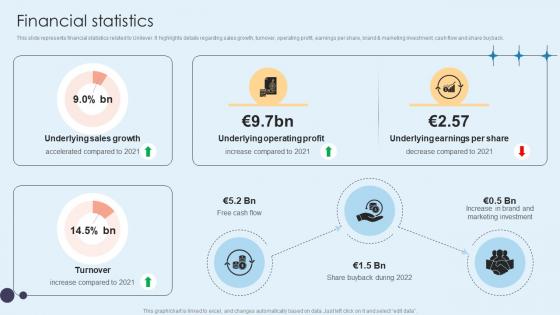
Financial Statistics Home Care Solutions Company Profile CP SS V
This slide represents financial statistics related to Unilever. It highlights details regarding sales growth, turnover, operating profit, earnings per share, brand and marketing investment, cash flow and share buyback.Formulating a presentation can take up a lot of effort and time, so the content and message should always be the primary focus. The visuals of the PowerPoint can enhance the presenters message, so our Financial Statistics Home Care Solutions Company Profile CP SS V was created to help save time. Instead of worrying about the design, the presenter can concentrate on the message while our designers work on creating the ideal templates for whatever situation is needed. Slidegeeks has experts for everything from amazing designs to valuable content, we have put everything into Financial Statistics Home Care Solutions Company Profile CP SS V. This slide represents financial statistics related to Unilever. It highlights details regarding sales growth, turnover, operating profit, earnings per share, brand and marketing investment, cash flow and share buyback.
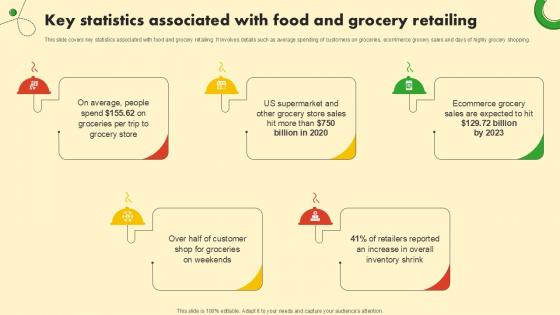
Key Statistics Associated With Food And Grocery Retail Ppt Sample
This slide covers key statistics associated with food and grocery retailing. It involves details such as average spending of customers on groceries, ecommerce grocery sales and days of highly grocery shopping. Do you have to make sure that everyone on your team knows about any specific topic I yes, then you should give Key Statistics Associated With Food And Grocery Retail Ppt Sample a try. Our experts have put a lot of knowledge and effort into creating this impeccable Key Statistics Associated With Food And Grocery Retail Ppt Sample. You can use this template for your upcoming presentations, as the slides are perfect to represent even the tiniest detail. You can download these templates from the Slidegeeks website and these are easy to edit. So grab these today This slide covers key statistics associated with food and grocery retailing. It involves details such as average spending of customers on groceries, ecommerce grocery sales and days of highly grocery shopping.
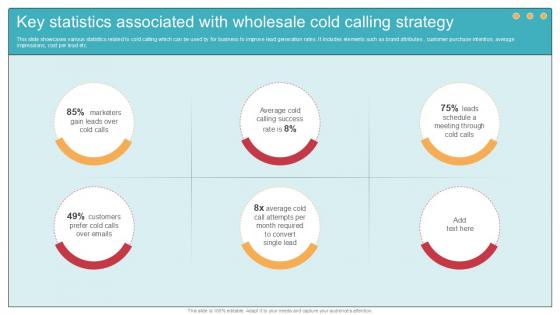
Key Statistics Associated With Comprehensive Guide To Wholesale Ppt Presentation
This slide showcases various statistics related to cold calling which can be used by for business to improve lead generation rates. It includes elements such as brand attributes , customer purchase intention, average impressions, cost per lead etc. Get a simple yet stunning designed Key Statistics Associated With Comprehensive Guide To Wholesale Ppt Presentation. It is the best one to establish the tone in your meetings. It is an excellent way to make your presentations highly effective. So, download this PPT today from Slidegeeks and see the positive impacts. Our easy-to-edit Key Statistics Associated With Comprehensive Guide To Wholesale Ppt Presentation can be your go-to option for all upcoming conferences and meetings. So, what are you waiting for Grab this template today. This slide showcases various statistics related to cold calling which can be used by for business to improve lead generation rates. It includes elements such as brand attributes , customer purchase intention, average impressions, cost per lead etc.
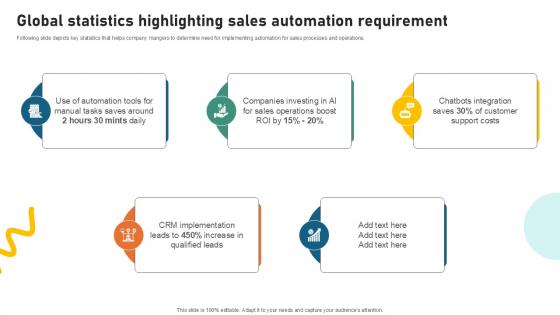
Global Statistics Highlighting Sample Pitch Deck For Video Ppt Sample
Following slide depicts key statistics that helps company mangers to determine need for implementing automation for sales processes and operations. Whether you have daily or monthly meetings, a brilliant presentation is necessary. Global Statistics Highlighting Sample Pitch Deck For Video Ppt Sample can be your best option for delivering a presentation. Represent everything in detail using Global Statistics Highlighting Sample Pitch Deck For Video Ppt Sample and make yourself stand out in meetings. The template is versatile and follows a structure that will cater to your requirements. All the templates prepared by Slidegeeks are easy to download and edit. Our research experts have taken care of the corporate themes as well. So, give it a try and see the results. Following slide depicts key statistics that helps company mangers to determine need for implementing automation for sales processes and operations.
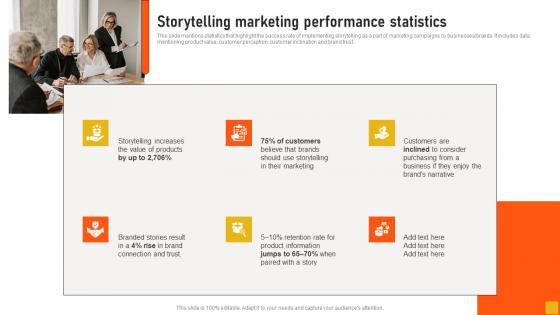
Storytelling Marketing Performance Statistics Comprehensive Guide Slides Pdf
This slide mentions statistics that highlight the success rate of implementing storytelling as a part of marketing campaigns by businesses brands. It includes data mentioning product value, customer perception, customer inclination and brand trust. Welcome to our selection of the Storytelling Marketing Performance Statistics Comprehensive Guide Slides Pdf These are designed to help you showcase your creativity and bring your sphere to life. Planning and Innovation are essential for any business that is just starting out. This collection contains the designs that you need for your everyday presentations. All of our PowerPoints are 100 percent editable, so you can customize them to suit your needs. This multi-purpose template can be used in various situations. Grab these presentation templates today. This slide mentions statistics that highlight the success rate of implementing storytelling as a part of marketing campaigns by businesses brands. It includes data mentioning product value, customer perception, customer inclination and brand trust.
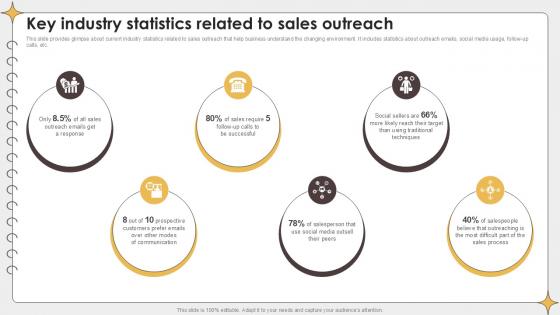
Key Industry Statistics Related To Planning Outreach Campaigns PPT Presentation
This slide provides glimpse about current industry statistics related to sales outreach that help business understand the changing environment. It includes statistics about outreach emails, social media usage, follow-up calls, etc. Here you can discover an assortment of the finest PowerPoint and Google Slides templates. With these templates, you can create presentations for a variety of purposes while simultaneously providing your audience with an eye-catching visual experience. Download Key Industry Statistics Related To Planning Outreach Campaigns PPT Presentation to deliver an impeccable presentation. These templates will make your job of preparing presentations much quicker, yet still, maintain a high level of quality. Slidegeeks has experienced researchers who prepare these templates and write high-quality content for you. Later on, you can personalize the content by editing the Key Industry Statistics Related To Planning Outreach Campaigns PPT Presentation. This slide provides glimpse about current industry statistics related to sales outreach that help business understand the changing environment. It includes statistics about outreach emails, social media usage, follow-up calls, etc.

Release Statistics For Regression Testing Corrective Regression Testing Ppt Sample
The purpose of this slide is to highlight the release statistics. It also includes an example of release statistics which include various components like application name, release number, scope, etc. Formulating a presentation can take up a lot of effort and time, so the content and message should always be the primary focus. The visuals of the PowerPoint can enhance the presenters message, so our Release Statistics For Regression Testing Corrective Regression Testing Ppt Sample was created to help save time. Instead of worrying about the design, the presenter can concentrate on the message while our designers work on creating the ideal templates for whatever situation is needed. Slidegeeks has experts for everything from amazing designs to valuable content, we have put everything into Release Statistics For Regression Testing Corrective Regression Testing Ppt Sample The purpose of this slide is to highlight the release statistics. It also includes an example of release statistics which include various components like application name, release number, scope, etc.
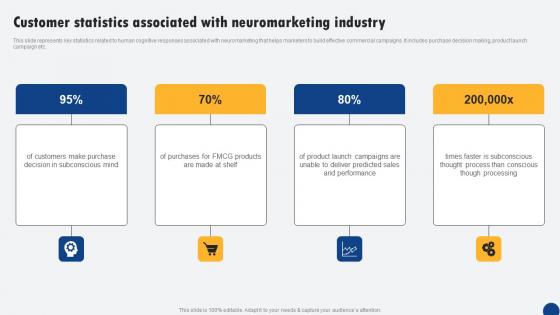
Customer Statistics Associated With Neuromarketing Driven Digital Marketing Elements Pdf
This slide represents key statistics related to human cognitive responses associated with neuromarketing that helps marketers to build effective commercial campaigns. It includes purchase decision making, product launch campaign etc. Slidegeeks is one of the best resources for PowerPoint templates. You can download easily and regulate Customer Statistics Associated With Neuromarketing Driven Digital Marketing Elements Pdf for your personal presentations from our wonderful collection. A few clicks is all it takes to discover and get the most relevant and appropriate templates. Use our Templates to add a unique zing and appeal to your presentation and meetings. All the slides are easy to edit and you can use them even for advertisement purposes. This slide represents key statistics related to human cognitive responses associated with neuromarketing that helps marketers to build effective commercial campaigns. It includes purchase decision making, product launch campaign etc.
Uterine Fibroids Statistics In Powerpoint And Google Slides Cpb
Presenting our innovatively designed set of slides titled Uterine Fibroids Statistics In Powerpoint And Google Slides Cpb This completely editable PowerPoint graphic exhibits Uterine Fibroids Statistics that will help you convey the message impactfully. It can be accessed with Google Slides and is available in both standard screen and widescreen aspect ratios. Apart from this, you can download this well structured PowerPoint template design in different formats like PDF, JPG, and PNG. So, click the download button now to gain full access to this PPT design. Our Uterine Fibroids Statistics In Powerpoint And Google Slides Cpb are topically designed to provide an attractive backdrop to any subject. Use them to look like a presentation pro.
Randomization Statistics Chart In Powerpoint And Google Slides Cpb
Introducing our well designed Randomization Statistics Chart In Powerpoint And Google Slides Cpb. This PowerPoint design presents information on topics like Randomization Statistics Chart. As it is predesigned it helps boost your confidence level. It also makes you a better presenter because of its high-quality content and graphics. This PPT layout can be downloaded and used in different formats like PDF, PNG, and JPG. Not only this, it is available in both Standard Screen and Widescreen aspect ratios for your convenience. Therefore, click on the download button now to persuade and impress your audience. Our Randomization Statistics Chart In Powerpoint And Google Slides Cpb are topically designed to provide an attractive backdrop to any subject. Use them to look like a presentation pro.
Statistics Branches In Powerpoint And Google Slides Cpb
Introducing our well designed Statistics Branches In Powerpoint And Google Slides Cpb. This PowerPoint design presents information on topics like Statistics Branches. As it is predesigned it helps boost your confidence level. It also makes you a better presenter because of its high-quality content and graphics. This PPT layout can be downloaded and used in different formats like PDF, PNG, and JPG. Not only this, it is available in both Standard Screen and Widescreen aspect ratios for your convenience. Therefore, click on the download button now to persuade and impress your audience. Our Statistics Branches In Powerpoint And Google Slides Cpb are topically designed to provide an attractive backdrop to any subject. Use them to look like a presentation pro.
Explanatory Variable Statistics In Powerpoint And Google Slides Cpb
Introducing our well-designed Explanatory Variable Statistics In Powerpoint And Google Slides Cpb This PowerPoint design presents information on topics like Explanatory Variable Statistics As it is predesigned it helps boost your confidence level. It also makes you a better presenter because of its high-quality content and graphics. This PPT layout can be downloaded and used in different formats like PDF, PNG, and JPG. Not only this, it is available in both Standard Screen and Widescreen aspect ratios for your convenience. Therefore, click on the download button now to persuade and impress your audience. Our Explanatory Variable Statistics In Powerpoint And Google Slides Cpb are topically designed to provide an attractive backdrop to any subject. Use them to look like a presentation pro.
Block Design Statistics In Powerpoint And Google Slides Cpb
Introducing our well-designed Block Design Statistics In Powerpoint And Google Slides Cpb. This PowerPoint design presents information on topics like Block Design Statistics. As it is predesigned it helps boost your confidence level. It also makes you a better presenter because of its high-quality content and graphics. This PPT layout can be downloaded and used in different formats like PDF, PNG, and JPG. Not only this, it is available in both Standard Screen and Widescreen aspect ratios for your convenience. Therefore, click on the download button now to persuade and impress your audience. Our Block Design Statistics In Powerpoint And Google Slides Cpb are topically designed to provide an attractive backdrop to any subject. Use them to look like a presentation pro.
Sustainability Statistics Clothing Retailer Company Profile CP SS V
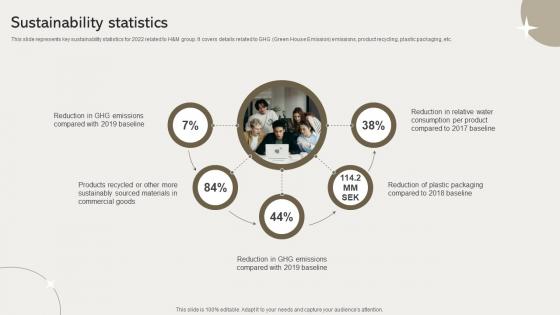
This slide represents key sustainability statistics for 2022 related to HandM group. It covers details related to GHG Green House Emission emissions, product recycling, plastic packaging, etc. Slidegeeks has constructed Sustainability Statistics Clothing Retailer Company Profile CP SS V after conducting extensive research and examination. These presentation templates are constantly being generated and modified based on user preferences and critiques from editors. Here, you will find the most attractive templates for a range of purposes while taking into account ratings and remarks from users regarding the content. This is an excellent jumping-off point to explore our content and will give new users an insight into our top-notch PowerPoint Templates. This slide represents key sustainability statistics for 2022 related to HandM group. It covers details related to GHG Green House Emission emissions, product recycling, plastic packaging, etc.
Improving Customer Satisfaction Statistics Highlighting Social Media Platform Usage
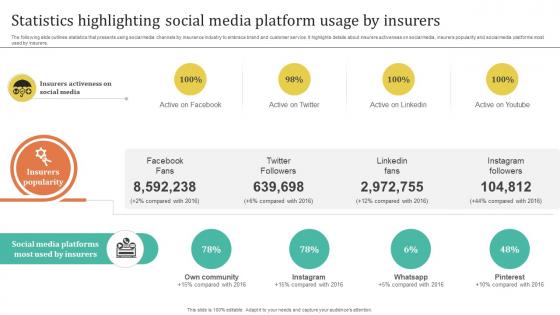
The following slide outlines statistics that presents using social media channels by insurance industry to embrace brand and customer service. It highlights details about insurers activeness on social media, insurers popularity and social media platforms most used by insurers. If your project calls for a presentation, then Slidegeeks is your go-to partner because we have professionally designed, easy-to-edit templates that are perfect for any presentation. After downloading, you can easily edit Improving Customer Satisfaction Statistics Highlighting Social Media Platform Usage and make the changes accordingly. You can rearrange slides or fill them with different images. Check out all the handy templates The following slide outlines statistics that presents using social media channels by insurance industry to embrace brand and customer service. It highlights details about insurers activeness on social media, insurers popularity and social media platforms most used by insurers.

Key Statistics Consumer Electronics Company Profile CP SS V
Mentioned slide provides information about key statistics associated with Apple Inc. products. It includes key points such as iPhone users, iPhone market share, and demographics.Want to ace your presentation in front of a live audience Our Key Statistics Consumer Electronics Company Profile CP SS V can help you do that by engaging all the users towards you. Slidegeeks experts have put their efforts and expertise into creating these impeccable powerpoint presentations so that you can communicate your ideas clearly. Moreover, all the templates are customizable, and easy-to-edit and downloadable. Use these for both personal and commercial use. Mentioned slide provides information about key statistics associated with Apple Inc. products. It includes key points such as iPhone users, iPhone market share, and demographics.
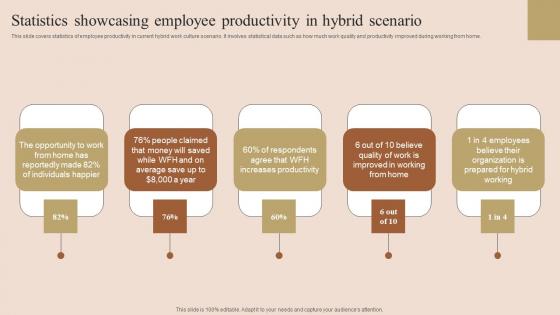
Employee Performance Improvement Techniques Statistics Showcasing Employee Elements Pdf
This slide covers statistics of employee productivity in current hybrid work culture scenario. It involves statistical data such as how much work quality and productivity improved during working from home. Present like a pro with Employee Performance Improvement Techniques Statistics Showcasing Employee Elements Pdf Create beautiful presentations together with your team, using our easy to use presentation slides. Share your ideas in real time and make changes on the fly by downloading our templates. So whether you are in the office, on the go, or in a remote location, you can stay in sync with your team and present your ideas with confidence. With Slidegeeks presentation got a whole lot easier. Grab these presentations today. This slide covers statistics of employee productivity in current hybrid work culture scenario. It involves statistical data such as how much work quality and productivity improved during working from home.

Business Statistics Meeting Success PowerPoint Templates And PowerPoint Themes 0612
Business Statistics Meeting Success PowerPoint Templates And PowerPoint Themes PPT Slides-Microsoft Powerpoint Templates and Background with business statistics Decorate your presentation with our Business Statistics Meeting Success PowerPoint Templates And PowerPoint Themes 0612. You will come out on top.

Statistics Marketing PowerPoint Templates And PowerPoint Themes 0612
Statistics Marketing PowerPoint Templates And PowerPoint Themes PPT Slides-Microsoft Powerpoint Templates and Background with business statistics Get fashionable with our Statistics Marketing PowerPoint Templates And PowerPoint Themes 0612. Whatever you display will be in.

Rescue Statistics Business PowerPoint Templates And PowerPoint Themes 0712
Rescue Statistics Business PowerPoint Templates And PowerPoint Themes 0712-Microsoft Powerpoint Templates and Background with rescue statistics bar Get enticed by the look of our Rescue Statistics Business PowerPoint Templates And PowerPoint Themes 0712. They creare a captivating aura.
Rescue Icon Statistics Finance PowerPoint Templates And PowerPoint Themes 0812
Rescue Icon Statistics Finance PowerPoint Templates And PowerPoint Themes 0812-Microsoft Powerpoint Templates and Background with rescue icon statistics Spread it out in equal doses. Get the portions right with our Rescue Icon Statistics Finance PowerPoint Templates And PowerPoint Themes 0812.

Rescue Statistics Business PowerPoint Templates And PowerPoint Themes 0812
Rescue Statistics Business PowerPoint Templates And PowerPoint Themes 0812-Microsoft Powerpoint Templates and Background with rescue statistics bar Help your audience absorb your ideas. Our Rescue Statistics Business PowerPoint Templates And PowerPoint Themes 0812 assist assimilation.
Algebraic Statistics In Powerpoint And Google Slides Cpb
Presenting our innovatively designed set of slides titled Algebraic Statistics In Powerpoint And Google Slides Cpb. This completely editable PowerPoint graphic exhibits Algebraic Statistics that will help you convey the message impactfully. It can be accessed with Google Slides and is available in both standard screen and widescreen aspect ratios. Apart from this, you can download this well structured PowerPoint template design in different formats like PDF, JPG, and PNG. So, click the download button now to gain full access to this PPT design. Our Algebraic Statistics In Powerpoint And Google Slides Cpb are topically designed to provide an attractive backdrop to any subject. Use them to look like a presentation pro.

Business Statistics Success PowerPoint Templates And PowerPoint Backgrounds 0711
Microsoft PowerPoint Template and Background with business statistics Extend an invitation with our Business Statistics Success PowerPoint Templates And PowerPoint Backgrounds 0711. Allow the audience into your thoughts.

Business Statistics Success PowerPoint Themes And PowerPoint Slides 0711
Microsoft PowerPoint Theme and Slide with business statistics Customize our Business Statistics Success PowerPoint Themes And PowerPoint Slides 0711 to your thoughts. Display for all the essential you.
Misleading Statistics New Companys Ppt PowerPoint Presentation Summary Mockup
This is a misleading statistics new companys ppt powerpoint presentation summary mockup. This is a five stage process. The stages in this process are misleading statistics, new companys.
Web Tracking Statistics Ppt PowerPoint Presentation Model Summary Cpb
This is a web tracking statistics ppt powerpoint presentation model summary cpb. This is a four stage process. The stages in this process are web tracking statistics.
Business Travel Statistics Ppt PowerPoint Presentation Icon Information Cpb
This is a business travel statistics ppt powerpoint presentation icon information cpb. This is a two stage process. The stages in this process are business travel statistics.
Sales Statistics Ppt Powerpoint Presentation Portfolio Introduction Cpb
This is a sales statistics ppt powerpoint presentation portfolio introduction cpb. This is a three stage process. The stages in this process are sales statistics.
Ad Campaign Statistics Ppt PowerPoint Presentation Gallery Smartart Cpb
This is a ad campaign statistics ppt powerpoint presentation gallery smartart cpb. This is a five stage process. The stages in this process are ad campaign statistics.
Quantitative Analysis Statistics Ppt PowerPoint Presentation Layouts Layouts Cpb
This is a quantitative analysis statistics ppt powerpoint presentation layouts layouts cpb. This is a eight stage process. The stages in this process are quantitative analysis statistics.
Local Business Statistics Ppt Powerpoint Presentation Visuals Cpb
This is a local business statistics ppt powerpoint presentation visuals cpb. This is a four stage process. The stages in this process are local business statistics.
Employee Wellness Statistics Ppt PowerPoint Presentation Outline Gridlines
This is a employee wellness statistics ppt powerpoint presentation outline gridlines. This is a five stage process. The stages in this process are employee wellness statistics.

Branding Statistics Ppt Powerpoint Presentation Ideas Layouts Cpb
This is a branding statistics ppt powerpoint presentation ideas layouts cpb. This is a five stage process. The stages in this process are branding statistics.
Tracking Statistics Ppt Powerpoint Presentation Infographic Template Graphic Images
This is a tracking statistics ppt powerpoint presentation infographic template graphic images. This is a eight stage process. The stages in this process are tracking statistics.
Automotive Industry Statistics Ppt PowerPoint Presentation Inspiration Graphics Design Cpb
This is a automotive industry statistics ppt powerpoint presentation inspiration graphics design cpb. This is a three stage process. The stages in this process are automotive industry statistics.


 Continue with Email

 Home
Home


