work plan
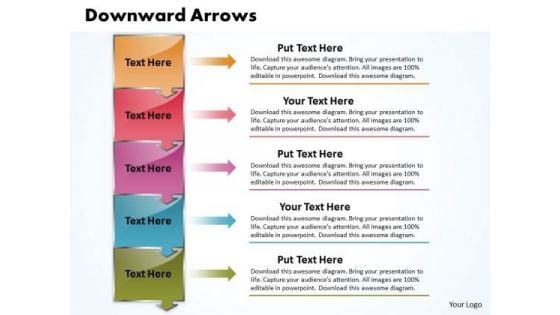
Ppt 5 Techno PowerPoint Slide Text Arrows Pointing Downwards Templates
PPT 5 techno powerpoint slide text arrows Pointing downwards Templates-Our amazing Diagram consists of a design of Five arrows attached to each other and placed in vertical manner displaying their content sidewise. It signifies the concept of degree, division, footing, grade, juncture, lap, leg, length, moment, node, phase, plane, point, and point in time, rung, standing, status.-PPT 5 techno powerpoint slide text arrows Pointing downwards Templates-Advertising, Arrow, Background, Banner, Concept, Creative, Design, Direction, Flow, Illustration, Label, Layout, Manual, Marketing, Modern, Next, Number, Offer, One, Options, Order, Page, Pointer, Process, Product, Promotion, Sequence, Simple, Special, Step, Symbol Dish out your stuff on our Ppt 5 Techno PowerPoint Slide Text Arrows Pointing Downwards Templates. You will be known as a man of high degree.
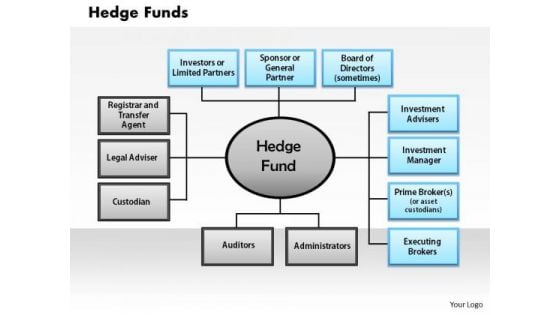
Business Framework Hedge Funds PowerPoint Presentation
This image slide displays hedge funds which is an investment vehicle that pools capital from a number of investors and invests in securities and other instruments. This image slide may be used to depict finance management in your presentations. This image slide will enhance the quality of your presentations.
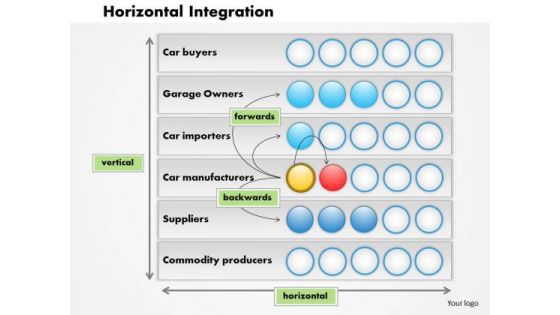
Business Framework Horizontal Integration PowerPoint Presentation
This image slide has been designed to display innovative diagram of horizontal integration. This image slide has been designed with matrix with vertical and horizontal measures. This image slide displays the concept of business and marketing management. Use this image slide to enhance the quality of your presentations.
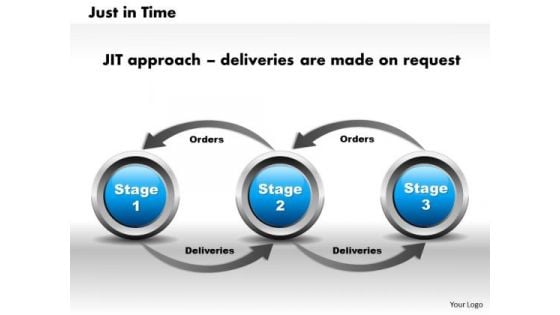
Business Framework Just In Time PowerPoint Presentation
Captivate the attention of your audience with the help of professionally designed diagram of just in time approach. This diagram contains three circles depicting different stages of orders and deliveries. Just in time approach relates to inventory management. Use this professional and customized business diagram in your PowerPoint presentations.
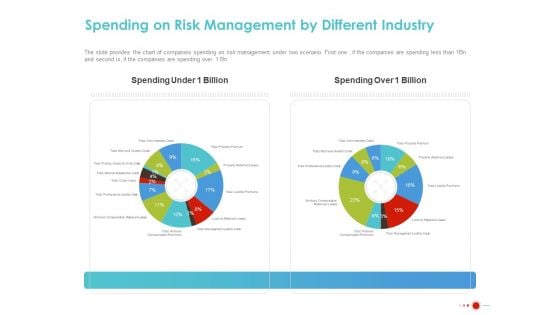
COVID 19 Mitigating Impact On High Tech Industry Spending On Risk Management By Different Industry Diagrams PDF
Presenting this set of slides with name covid 19 mitigating impact on high tech industry spending on risk management by different industry diagrams pdf. The topics discussed in these slides are total property premiums, property retained losses, total liability premiums, liability retained losses, total management liability costs, workers compensation retained losses, sales. This is a completely editable PowerPoint presentation and is available for immediate download. Download now and impress your audience.
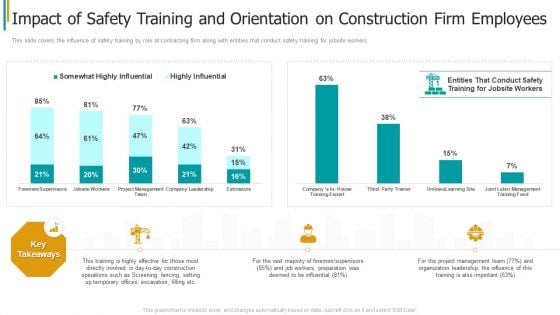
Construction Sector Project Risk Management Impact Of Safety Training And Orientation On Construction Firm Employees Rules PDF
This slide covers the influence of safety training by role at contracting firm along with entities that conduct safety training for jobsite workers. Deliver an awe inspiring pitch with this creative construction sector project risk management impact of safety training and orientation on construction firm employees rules pdf bundle. Topics like training, effective, management, organization, leadership can be discussed with this completely editable template. It is available for immediate download depending on the needs and requirements of the user.
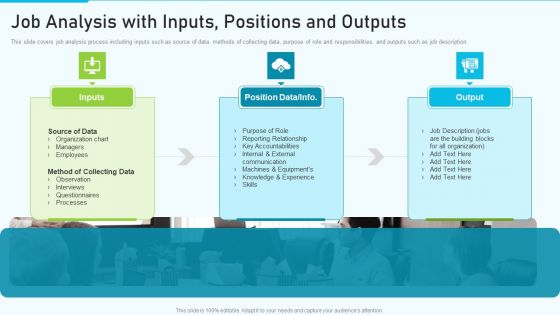
The Optimum Human Capital Strategic Tools And Templates Job Analysis With Inputs Portrait PDF
This slide covers job analysis process including inputs such as source of data, methods of collecting data, purpose of role and responsibilities, and outputs such as job description. Presenting the optimum human capital strategic tools and templates job analysis with inputs portrait pdf to provide visual cues and insights. Share and navigate important information on three stages that need your due attention. This template can be used to pitch topics like method, organization, equipment. In addtion, this PPT design contains high resolution images, graphics, etc, that are easily editable and available for immediate download.
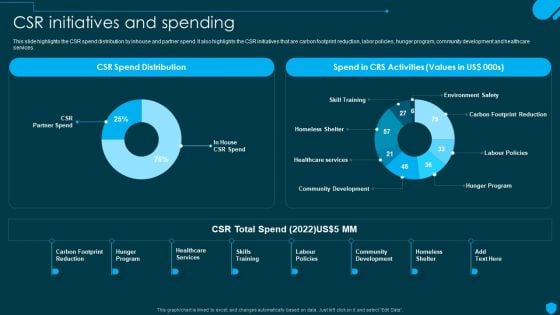
Security And Human Resource Services Business Profile CSR Initiatives And Spending Download PDF
This slide highlights the CSR spend distribution by inhouse and partner spend. It also highlights the CSR initiatives that are carbon footprint reduction, labor policies, hunger program, community development and healthcare services. Do you have an important presentation coming up Are you looking for something that will make your presentation stand out from the rest Look no further than Security And Human Resource Services Business Profile CSR Initiatives And Spending Download PDF. With our professional designs, you can trust that your presentation will pop and make delivering it a smooth process. And with Slidegeeks, you can trust that your presentation will be unique and memorable. So why wait Grab Security And Human Resource Services Business Profile CSR Initiatives And Spending Download PDF today and make your presentation stand out from the rest.
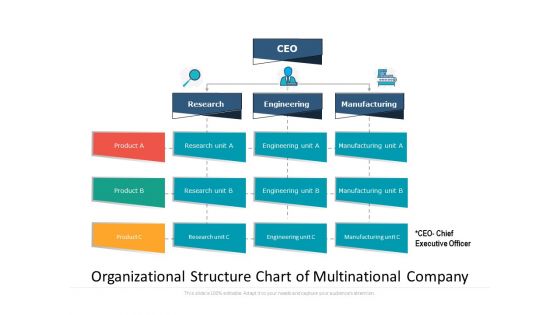
Organizational Structure Chart Of Multinational Company Ppt PowerPoint Presentation Layouts Graphics Pictures PDF
Persuade your audience using this organizational structure chart of multinational company ppt powerpoint presentation layouts graphics pictures pdf. This PPT design covers five stages, thus making it a great tool to use. It also caters to a variety of topics including engineering, manufacturing, product, organizational. Download this PPT design now to present a convincing pitch that not only emphasizes the topic but also showcases your presentation skills.
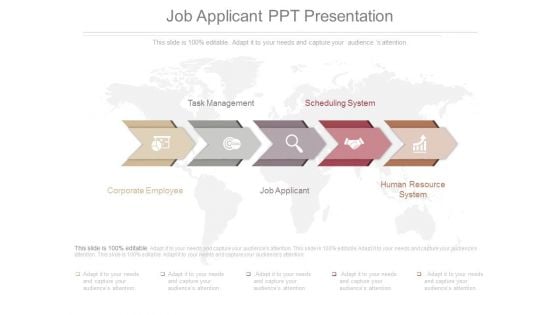
Job Applicant Ppt Presentation
This is a job applicant ppt presentation. This is a five stage process. The stages in this time process are task management, scheduling system, corporate employee, job applicant, human resource system.
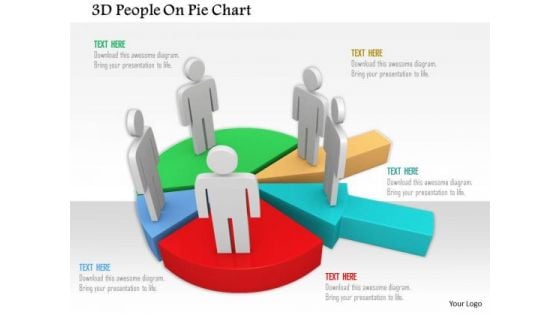
3d People On Pie Chart PowerPoint Templates
This power point diagram has been crafted with graphic of 3d team members on pie chart. This 3d diagram contains the concept of team management and result analysis. Use this diagram to create an impact on your viewers.
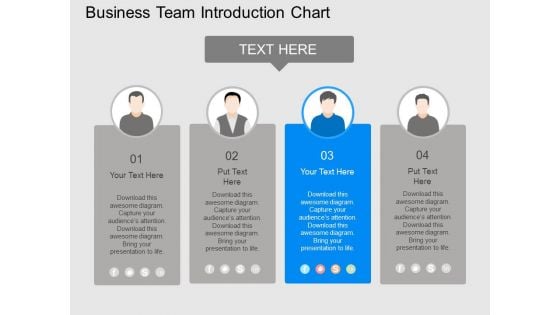
Business Team Introduction Chart Powerpoint Template
Graphic of team introduction chart has been used to design this power point template. This PPT diagram contains the concept of HR management. Use this PPT diagram slide to make outstanding presentations.
Three Dimensions For Employee Training With Icons Ppt PowerPoint Presentation Gallery Graphics Example PDF
This slide shows the three different dimensions of workforce development which includes strategic framework, system oversight and service delivery with strategic directions, funding, pathways, diversity and excellence, etc. Persuade your audience using this three dimensions for employee training with icons ppt powerpoint presentation gallery graphics example pdf. This PPT design covers three stages, thus making it a great tool to use. It also caters to a variety of topics including strategic framework, system oversight, service delivery. Download this PPT design now to present a convincing pitch that not only emphasizes the topic but also showcases your presentation skills.
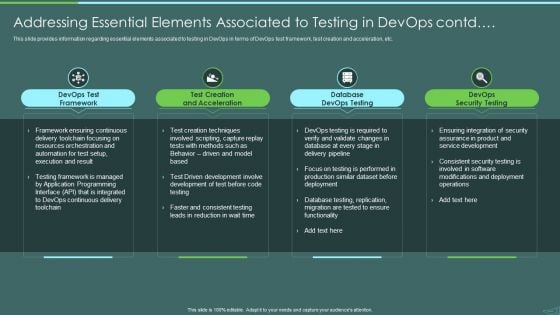
Devops Quality Assurance And Testing To Improve Speed And Quality IT Addressing Essential Elements Pictures PDF
This slide provides information regarding essential elements associated to testing in DevOps in terms of DevOps test framework, test creation and acceleration, etc. Presenting devops quality assurance and testing to improve speed and quality it addressing essential elements pictures pdf to provide visual cues and insights. Share and navigate important information on four stages that need your due attention. This template can be used to pitch topics like devops test framework, test creation and acceleration, database devops testing, devops security testing. In addtion, this PPT design contains high resolution images, graphics, etc, that are easily editable and available for immediate download.
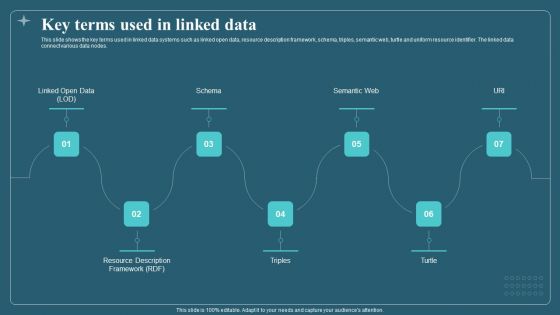
Associated Data IT Key Terms Used In Linked Data Pictures PDF
This slide shows the key terms used in linked data systems such as linked open data, resource description framework, schema, triples, semantic web, turtle and uniform resource identifier. The linked data connect various data nodes. Presenting Associated Data IT Key Terms Used In Linked Data Pictures PDF to provide visual cues and insights. Share and navigate important information on seven stages that need your due attention. This template can be used to pitch topics like Linked Open Data, Semantic Web, Resource Description Framework. In addtion, this PPT design contains high resolution images, graphics, etc, that are easily editable and available for immediate download.
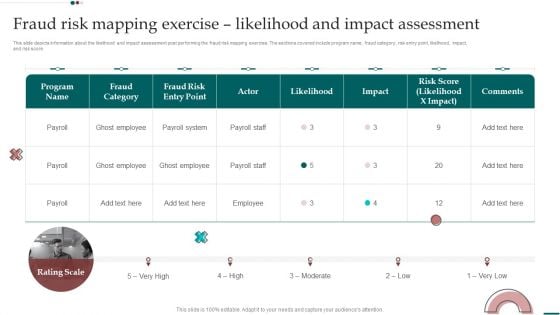
Scam Inquiry And Response Playbook Fraud Risk Mapping Exercise Likelihood And Impact Assessment Slides PDF
Mentioned slide depicts the companys framework, which is currently being used to prevent fraud risk events. The framework has four major stages assess, design and implement, evaluate and adapt, and commit. From laying roadmaps to briefing everything in detail, our templates are perfect for you. You can set the stage with your presentation slides. All you have to do is download these easy to edit and customizable templates. Scam Inquiry And Response Playbook Fraud Risk Mapping Exercise Likelihood And Impact Assessment Slides PDF will help you deliver an outstanding performance that everyone would remember and praise you for. Do download this presentation today.
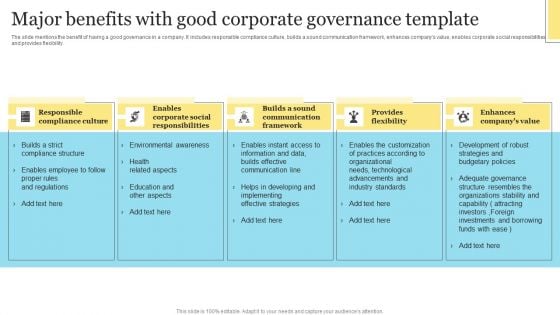
Major Benefits With Good Corporate Governance Template Slides PDF
The slide mentions the benefit of having a good governance in a company. It includes responsible compliance culture, builds a sound communication framework, enhances companys value, enables corporate social responsibilities and provides flexibility. Persuade your audience using this Major Benefits With Good Corporate Governance Template Slides PDF. This PPT design covers five stages, thus making it a great tool to use. It also caters to a variety of topics including Responsible Compliance Culture, Enables Corporate Social, Communication Framework . Download this PPT design now to present a convincing pitch that not only emphasizes the topic but also showcases your presentation skills.
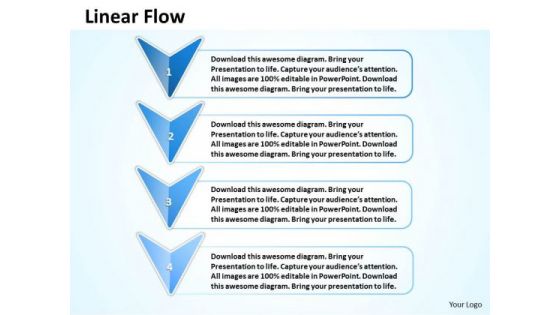
Ppt 4 Power Point Stage Linear Flow Arrow Org Chart PowerPoint 2007 Templates
PPT 4 power point stage linear flow arrow org chart powerpoint 2007 Templates-Use this Astonishing PowerPoint Diagram on the black Background to describe the different phases of a Development Mechanism. It symbolizes continuous flow, interminable, looped, no end of, no end to, on a treadmill, perpetual, prolonged, regular etc.-PPT 4 power point stage linear flow arrow org chart powerpoint 2007 Templates-Abstract, Arrow, Art, Artistic, Background, Business, Colorful, Communication, Computer-Graphics, Concept, Creation, Data, Decoration, Decorative, Design, Design-Element, Digital, Direction, Effect, Elegance, Element, Energy, Flow, Go, Idea, Illustration, Modern, Movement, Network, Symbol Economise on the time you have. Equip yourself with our Ppt 4 Power Point Stage Linear Flow Arrow Org Chart PowerPoint 2007 Templates.
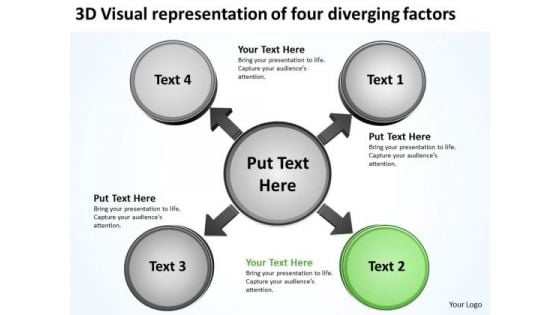
Visual Representation Of Four Diverging Factors Circular Motion Diagram PowerPoint Templates
We present our visual representation of four diverging factors Circular Motion Diagram PowerPoint templates.Present our Arrows PowerPoint Templates because like your thoughts arrows are inherently precise and true. Download our Shapes PowerPoint Templates because this an appropriate template to get your ideas across to your target audience. Download and present our Process and Flows PowerPoint Templates because this can explain the various related aspects of these varied tracks and how they will, on hitting their own targets, cumulatively contribute to hitting GOLD. Present our Flow charts PowerPoint Templates because you are ready to flap your wings and launch off. All poised are you to touch the sky with glory. Download and present our Business PowerPoint Templates because it illustrates the city with a lasting tryst with resilience. You epitomise the qualities that give your city its fame.Use these PowerPoint slides for presentations relating to Arrows, background, blue, chart, circle, circular, circulation, color, connection, continuity, cycle, cyclic, diagram, direction, empty, flow, graph, icon, illustration, isolated, isolated on white, loop, motion, presentation, process, progress, reason, recycle, recycling, repetition, report, result, ring, rotation, round, scheme, section, step, symbol, teamwork, four dimensional. The prominent colors used in the PowerPoint template are Green lime , Black, Gray. The feedback we get is that our visual representation of four diverging factors Circular Motion Diagram PowerPoint templates are Charming. The feedback we get is that our color PowerPoint templates and PPT Slides are Magnificent. People tell us our visual representation of four diverging factors Circular Motion Diagram PowerPoint templates are Fashionable. We assure you our connection PowerPoint templates and PPT Slides are visually appealing. We assure you our visual representation of four diverging factors Circular Motion Diagram PowerPoint templates are Nostalgic. The feedback we get is that our circular PowerPoint templates and PPT Slides are Exuberant. The assistance of our Visual Representation Of Four Diverging Factors Circular Motion Diagram PowerPoint Templates is not just figurative. Experience their effect in front of your eyes.
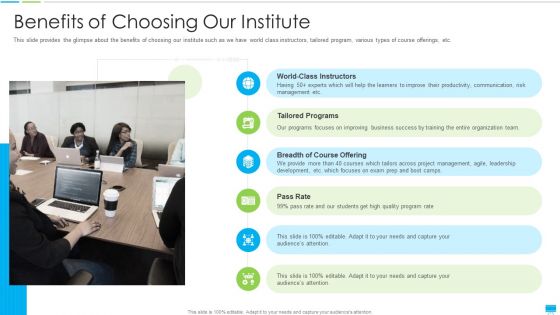
Project Management Coaching IT Benefits Of Choosing Our Institute Infographics PDF
This slide provides the glimpse about the benefits of choosing our institute such as we have world class instructors, tailored program, various types of course offerings, etc. Presenting project management coaching it benefits of choosing our institute infographics pdf to provide visual cues and insights. Share and navigate important information on six stages that need your due attention. This template can be used to pitch topics like communication, productivity, risk, team, development. In addtion, this PPT design contains high resolution images, graphics, etc, that are easily editable and available for immediate download.
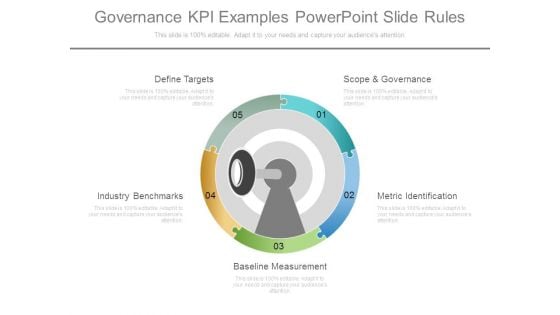
Governance Kpi Examples Powerpoint Slide Rules
This is a governance kpi examples powerpoint slide rules. This is a five stage process. The stages in this process are define targets, scope and governance, industry benchmarks, metric identification, baseline measurement.

Comprehensive Guide To Acquire Customers Affiliate Marketing For Low Cost Advertising Mockup PDF
This slide covers the benefits of running affiliate marketing programs to generate traffic or leads for product and service promotion. It includes critical stats such as 80 precent of brands running affiliate programs, 16 precent of eCommerce sales, and 15 30 precent of revenue from affiliate programs. Do you have to make sure that everyone on your team knows about any specific topic I yes, then you should give Comprehensive Guide To Acquire Customers Affiliate Marketing For Low Cost Advertising Mockup PDF a try. Our experts have put a lot of knowledge and effort into creating this impeccable Comprehensive Guide To Acquire Customers Affiliate Marketing For Low Cost Advertising Mockup PDF. You can use this template for your upcoming presentations, as the slides are perfect to represent even the tiniest detail. You can download these templates from the Slidegeeks website and these are easy to edit. So grab these today.
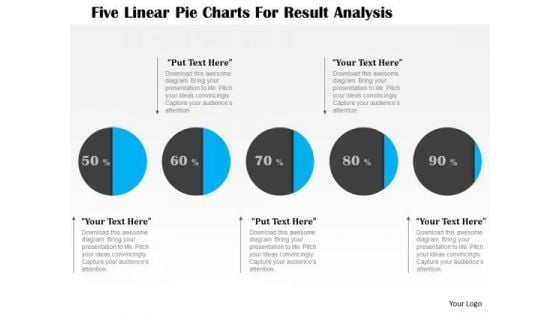
Business Diagram Five Linear Pie Charts For Result Analysis Presentation Template
This business diagram displays graphic of five staged process flow diagram. This PPT slide contains the concept of business data representation. Use this diagram to build professional presentation for your viewers.
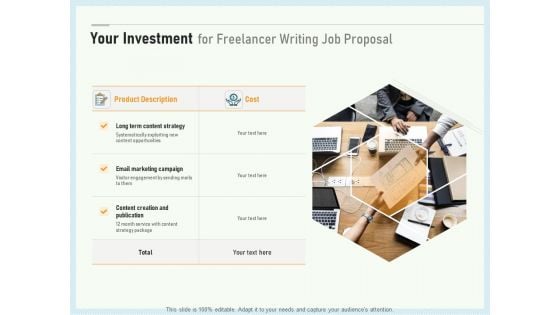
Writing A Bid Your Investment For Freelancer Writing Job Proposal Ppt PowerPoint Presentation Portfolio Samples PDF
Presenting writing a bid your investment for freelancer writing job proposal ppt powerpoint presentation portfolio samples pdf to provide visual cues and insights. Share and navigate important information on one stages that need your due attention. This template can be used to pitch topics like long term content strategy, email marketing campaign, content creation and publication. In addtion, this PPT design contains high-resolution images, graphics, etc, that are easily editable and available for immediate download.

Fibers IT Imaging Technology Overview And Use Cases
This slide describes the overview of imaging technology used in photonics. The purpose of this slide is to highlight the main use cases of the technology in biological and medical imaging, material characterizations, manufacturing and quality control, and so on. Make sure to capture your audiences attention in your business displays with our gratis customizable Fibers IT Imaging Technology Overview And Use Cases. These are great for business strategies, office conferences, capital raising or task suggestions. If you desire to acquire more customers for your tech business and ensure they stay satisfied, create your own sales presentation with these plain slides. This slide describes the overview of imaging technology used in photonics. The purpose of this slide is to highlight the main use cases of the technology in biological and medical imaging, material characterizations, manufacturing and quality control, and so on.
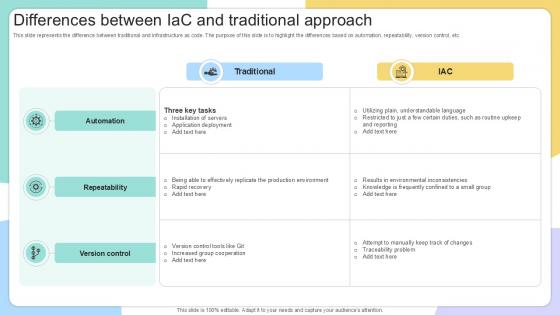
Differences Between IAC And Traditional IAC Tools For Performance Analysis PPT Template
This slide represents the difference between traditional and infrastructure as code. The purpose of this slide is to highlight the differences based on automation, repeatability, version control, etc. Make sure to capture your audiences attention in your business displays with our gratis customizable Differences Between IAC And Traditional IAC Tools For Performance Analysis PPT Template. These are great for business strategies, office conferences, capital raising or task suggestions. If you desire to acquire more customers for your tech business and ensure they stay satisfied, create your own sales presentation with these plain slides. This slide represents the difference between traditional and infrastructure as code. The purpose of this slide is to highlight the differences based on automation, repeatability, version control, etc.
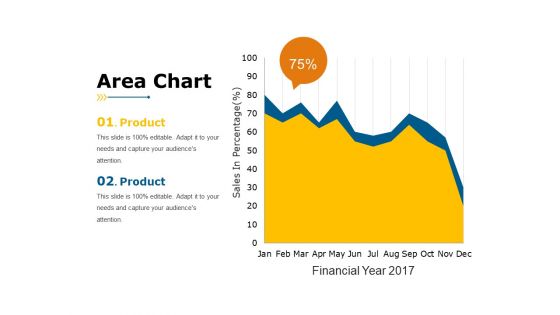
Area Chart Ppt PowerPoint Presentation Slides Rules
This is a area chart ppt powerpoint presentation slides rules. This is a two stage process. The stages in this process are sales in percentage, business, marketing, product, finance.
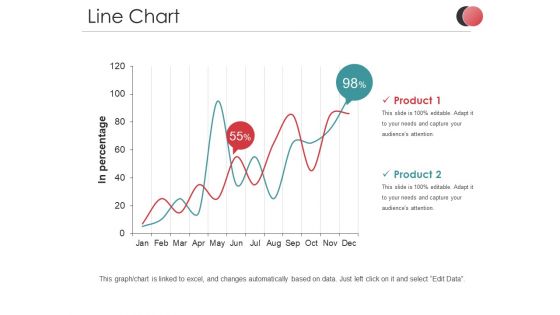
Line Chart Ppt PowerPoint Presentation Professional Ideas
This is a line chart ppt powerpoint presentation professional ideas. This is a two stage process. The stages in this process are in percentage, product, business, marketing, finance, percentage.
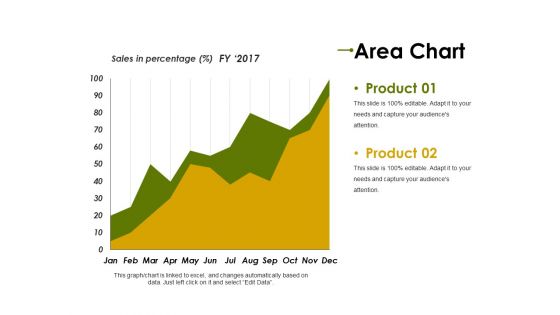
Area Chart Ppt PowerPoint Presentation Summary Objects
This is a area chart ppt powerpoint presentation summary objects. This is a two stage process. The stages in this process are product, sales in percentage, finance, business, marketing.
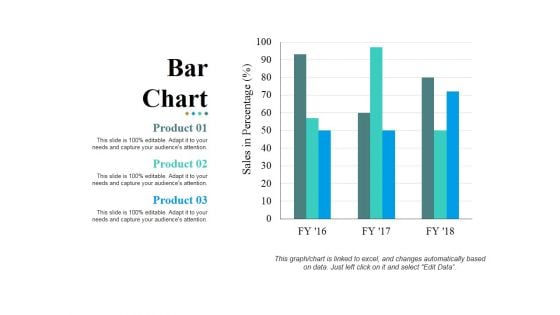
Bar Chart Ppt PowerPoint Presentation Layouts Pictures
This is a bar chart ppt powerpoint presentation layouts pictures. This is a three stage process. The stages in this process are bar graph, product, sales in percentage, business, marketing.
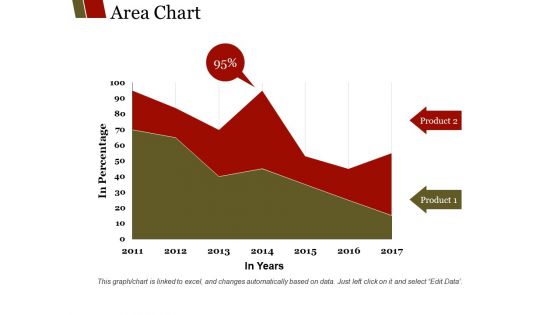
Area Chart Ppt PowerPoint Presentation Show Templates
This is a area chart ppt powerpoint presentation show templates. This is a two stage process. The stages in this process are product, in percentage, in years, finance, graph.
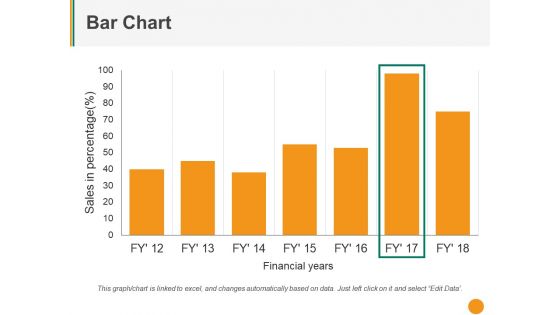
Bar Chart Ppt PowerPoint Presentation Styles Outfit
This is a bar chart ppt powerpoint presentation styles outfit. This is a Seven stage process. The stages in this process are sales in percentage, financial years, graph, business.
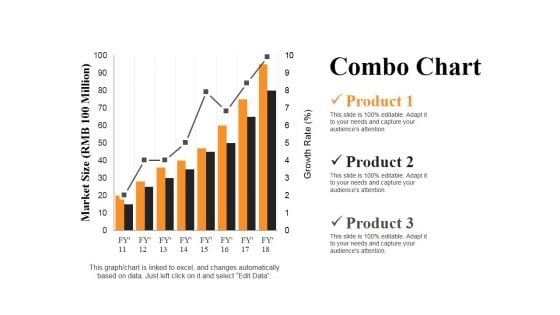
Combo Chart Ppt PowerPoint Presentation Summary Slides
This is a combo chart ppt powerpoint presentation summary slides. This is a three stage process. The stages in this process are market size, product, growth rate, bar graph, success.
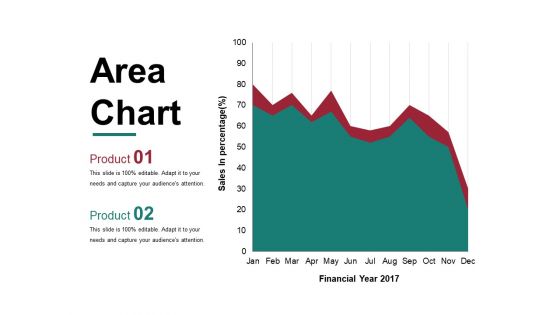
Area Chart Ppt PowerPoint Presentation Layouts Maker
This is a area chart ppt powerpoint presentation layouts maker. This is a two stage process. The stages in this process are financial year, sales in percentage, graph, business, marketing.
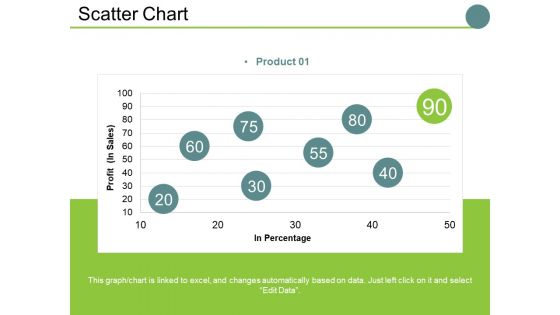
Scatter Chart Ppt PowerPoint Presentation Slides Examples
This is a scatter chart ppt powerpoint presentation slides examples. This is a one stage process. The stages in this process are profit , in percentage, business, marketing, finance, graph.
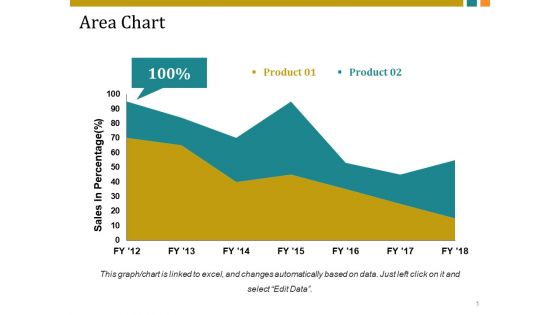
Area Chart Ppt PowerPoint Presentation Professional Brochure
This is a area chart ppt powerpoint presentation professional brochure. This is a two stage process. The stages in this process are sales in percentage, business, marketing, finance, graph.

Bar Chart Ppt PowerPoint Presentation Portfolio Diagrams
This is a bar chart ppt powerpoint presentation portfolio diagrams. This is a three stage process. The stages in this process are sales in percentage, business, marketing, graph, finance.
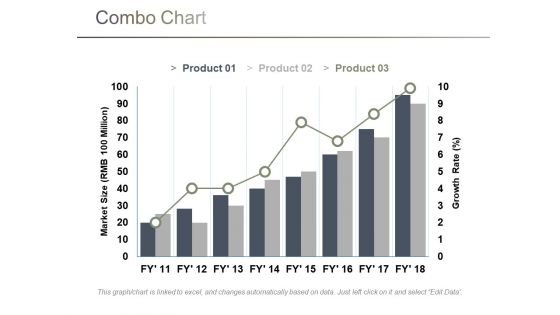
Combo Chart Ppt PowerPoint Presentation Pictures Shapes
This is a combo chart ppt powerpoint presentation pictures shapes. This is a three stage process. The stages in this process are market size, growth rate, business, marketing, graph.
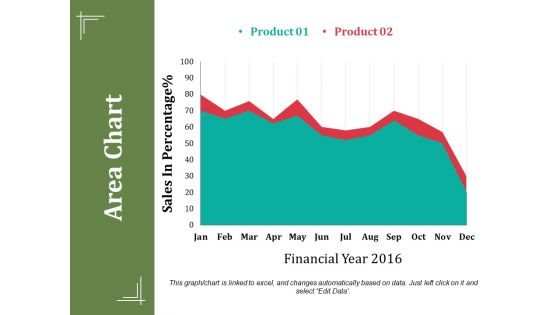
Area Chart Ppt PowerPoint Presentation Summary Show
This is a area chart ppt powerpoint presentation summary show. This is a two stage process. The stages in this process are sales in percentage, financial year, business, marketing, finance.
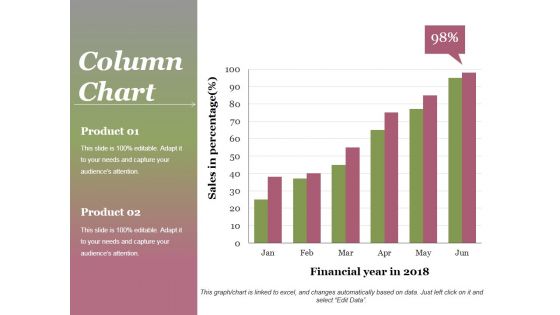
Column Chart Ppt PowerPoint Presentation Gallery Background
This is a column chart ppt powerpoint presentation gallery background. This is a two stage process. The stages in this process are product, sales in percentage, financial year, graph, success.
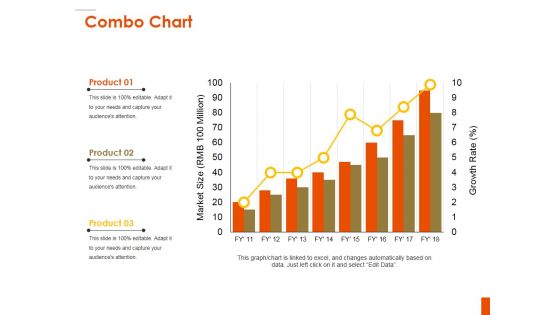
Combo Chart Ppt PowerPoint Presentation Inspiration Background
This is a combo chart ppt powerpoint presentation inspiration background. This is a three stage process. The stages in this process are product, bar graph, market size, growth, growth rate.
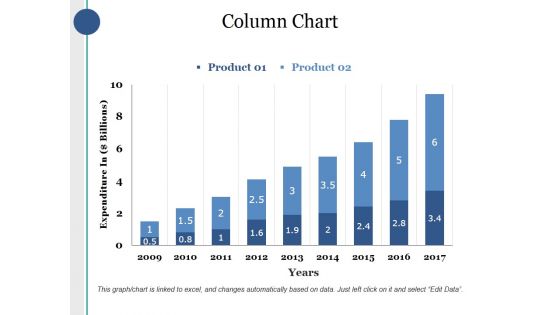
Column Chart Ppt PowerPoint Presentation Infographics Deck
This is a column chart ppt powerpoint presentation infographics deck. This is a two stage process. The stages in this process are product, expenditure in, years, bar graph, growth.
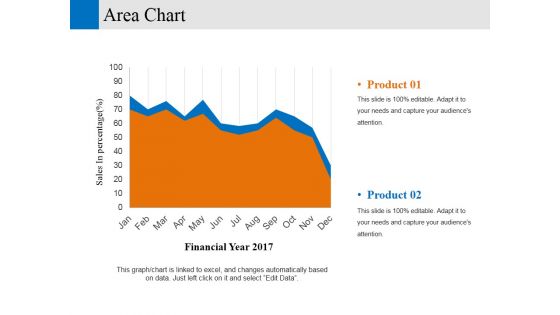
area chart ppt powerpoint presentation professional elements
This is a area chart ppt powerpoint presentation professional elements. This is a two stage process. The stages in this process are financial year sales in percentage, business, marketing, graph.
Bar Chart Ppt PowerPoint Presentation Icon Information
This is a bar chart ppt powerpoint presentation icon information. This is a one stage process. The stages in this process are product, sales in percentage, financial years, bar graph, growth.
Bar Chart Ppt PowerPoint Presentation Icon Introduction
This is a bar chart ppt powerpoint presentation icon introduction. This is a seven stage process. The stages in this process are in years, in percentage, business, marketing, graph.
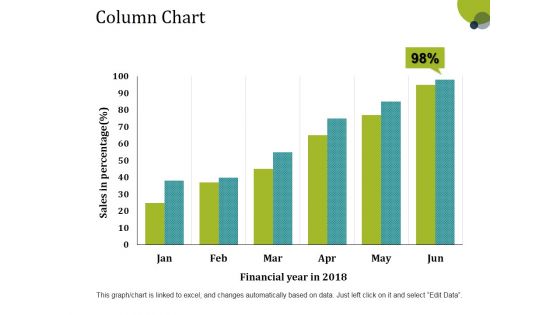
Column Chart Ppt PowerPoint Presentation Layouts Tips
This is a column chart ppt powerpoint presentation layouts tips. This is a six stage process. The stages in this process are sales in percentage, financial year, bar graph, growth, success.
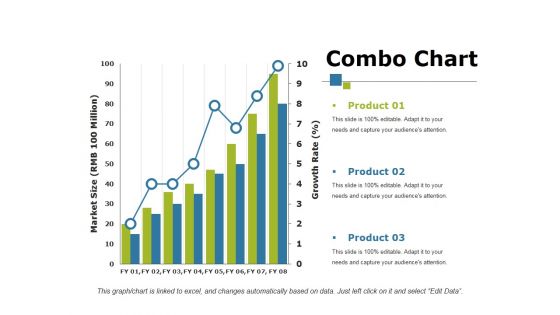
Combo Chart Ppt PowerPoint Presentation Show Influencers
This is a combo chart ppt powerpoint presentation show influencers. This is a three stage process. The stages in this process are product, bar graph, growth, growth rate, market size.
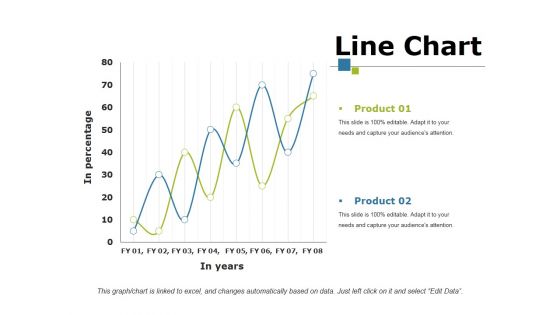
Line Chart Ppt PowerPoint Presentation Portfolio Mockup
This is a line chart ppt powerpoint presentation portfolio mockup. This is a two stage process. The stages in this process are product, in percentage, in year, growth, success.
Column Chart Ppt PowerPoint Presentation Icon Guide
This is a column chart ppt powerpoint presentation icon guide. This is a two stage process. The stages in this process are business, year, sales in percentage, marketing, graph.
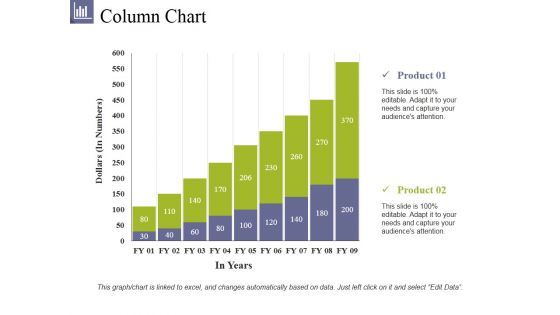
Column Chart Ppt PowerPoint Presentation File Summary
This is a column chart ppt powerpoint presentation file summary. This is a two stage process. The stages in this process are product, dollars, in years, bar graph, growth.
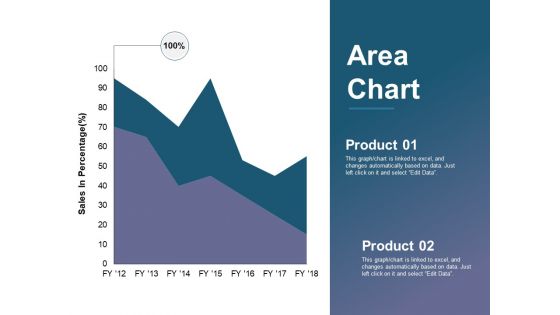
Area Chart Ppt PowerPoint Presentation Summary Information
This is a area chart ppt powerpoint presentation summary information. This is a two stage process. The stages in this process are business, sales in percentage, percentage, marketing, graph.
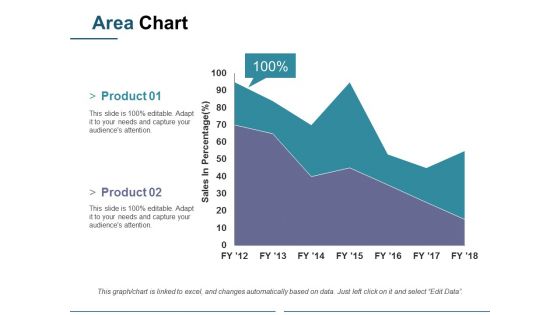
Area Chart Ppt PowerPoint Presentation Pictures Vector
This is a area chart ppt powerpoint presentation pictures vector. This is a two stage process. The stages in this process are sales in percentage, business, marketing, graph, percentage.
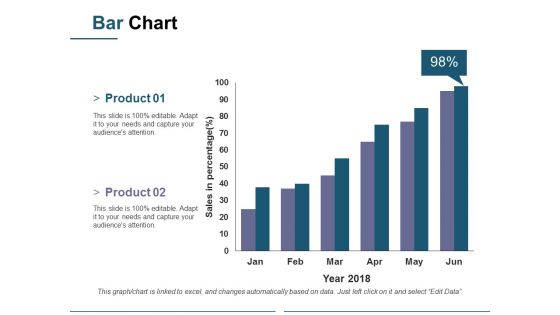
Bar Chart Ppt PowerPoint Presentation Model Sample
This is a bar chart ppt powerpoint presentation model sample. This is a two stage process. The stages in this process are sales in percentage, business, marketing, graph, percentage, year.
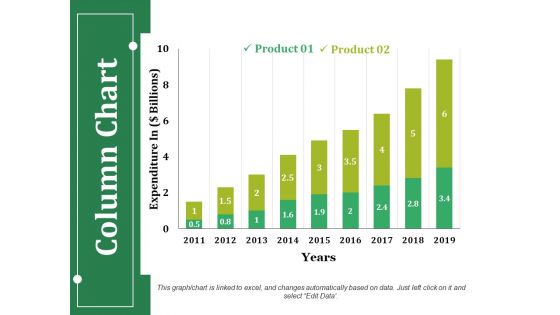
Column Chart Ppt PowerPoint Presentation Infographics Guidelines
This is a column chart ppt powerpoint presentation infographics guidelines. This is a two stage process. The stages in this process are product, expenditure in, years, business, bar graph.
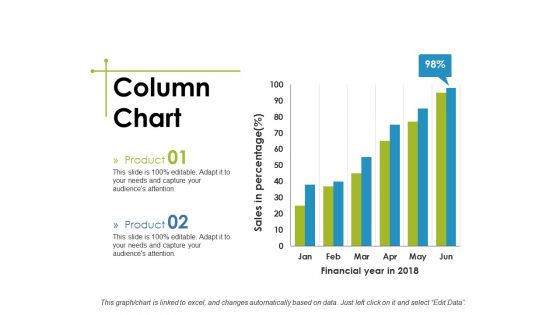
Column Chart Ppt PowerPoint Presentation Show Structure
This is a column chart ppt powerpoint presentation show structure. This is a two stage process. The stages in this process are business, financial year in, sales in percentage, marketing, graph.
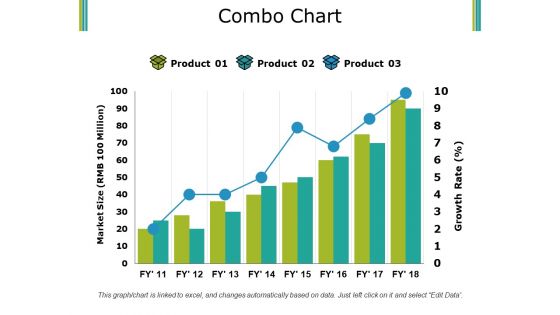
Combo Chart Ppt PowerPoint Presentation Pictures Summary
This is a combo chart ppt powerpoint presentation pictures summary. This is a three stage process. The stages in this process are product, market size, growth rate, bar graph, success.
Area Chart Ppt PowerPoint Presentation Icon Aids
This is a area chart ppt powerpoint presentation icon aids. This is a three stage process. The stages in this process are financial years, sales in percentage, business, marketing, graph.
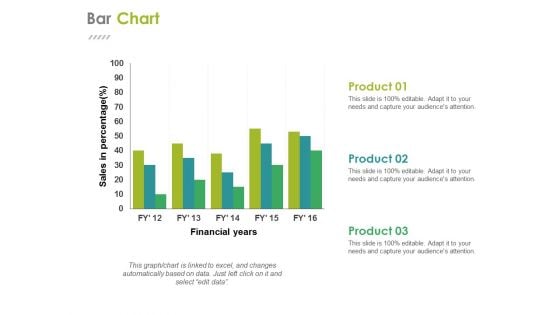
Bar Chart Ppt PowerPoint Presentation Summary Themes
This is a bar chart ppt powerpoint presentation summary themes. This is a three stage process. The stages in this process are financial years, sales in percentage, business, marketing, graph.
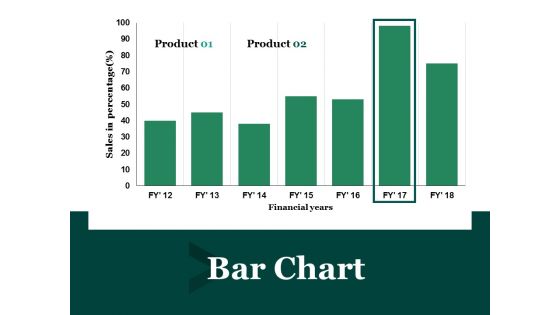
Bar Chart Ppt PowerPoint Presentation Layouts Template
This is a bar chart ppt powerpoint presentation layouts template. This is a two stage process. The stages in this process are financial year, sales in percentage, business, marketing, finance.
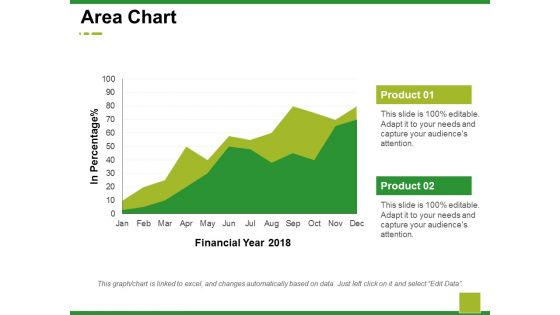
Area Chart Ppt PowerPoint Presentation Model Demonstration
This is a area chart ppt powerpoint presentation model demonstration. This is a two stage process. The stages in this process are business, marketing, financial year, in percentage, graph.


 Continue with Email

 Home
Home


