work plan

Column Chart Ppt PowerPoint Presentation Pictures Graphic Images
This is a column chart ppt powerpoint presentation pictures graphic images. This is a two stage process. The stages in this process are product, years, growth, success, bar graph.
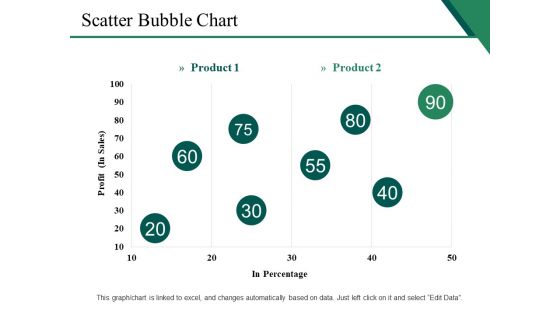
Scatter Bubble Chart Ppt PowerPoint Presentation Gallery Show
This is a scatter bubble chart ppt powerpoint presentation gallery show. This is a two stage process. The stages in this process are profit, in percentage, finance, marketing, business.
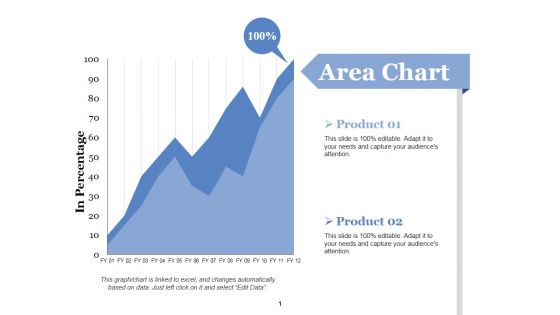
Area Chart Ppt PowerPoint Presentation Portfolio Graphics Design
This is a area chart ppt powerpoint presentation portfolio graphics design. This is a two stage process. The stages in this process are business, marketing, in percentage, graph, finance.
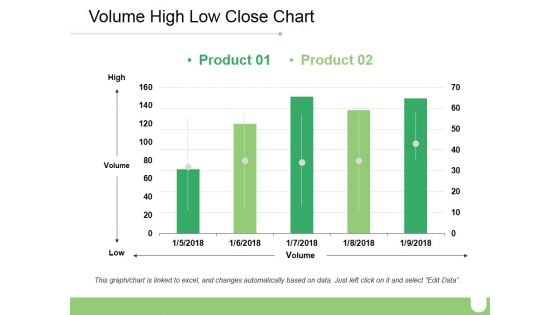
Volume High Low Close Chart Ppt PowerPoint Presentation Inspiration Brochure
This is a volume high low close chart ppt powerpoint presentation inspiration brochure. This is a two stage process. The stages in this process are business, high, volume, low, marketing.
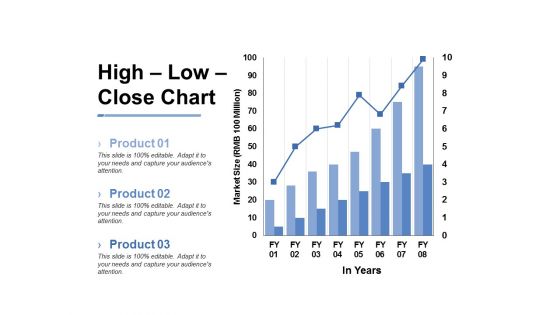
High Low Close Chart Ppt PowerPoint Presentation Inspiration Slide
This is a high low close chart ppt powerpoint presentation inspiration slide. This is a three stage process. The stages in this process are business, marketing, market size, in years, graph.
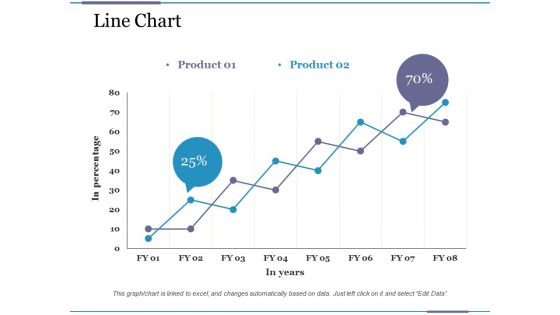
Line Chart Ppt PowerPoint Presentation Pictures File Formats
This is a line chart ppt powerpoint presentation pictures file formats. This is a two stage process. The stages in this process are business, financial, in percentage, in years, graph.
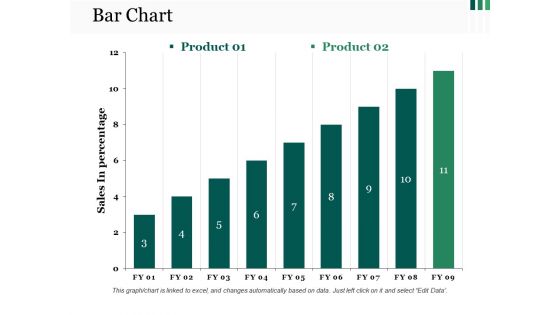
Bar Chart Ppt PowerPoint Presentation Show Format Ideas
This is a bar chart ppt powerpoint presentation show format ideas. This is a two stage process. The stages in this process are bar graph, growth, success, business, marketing.
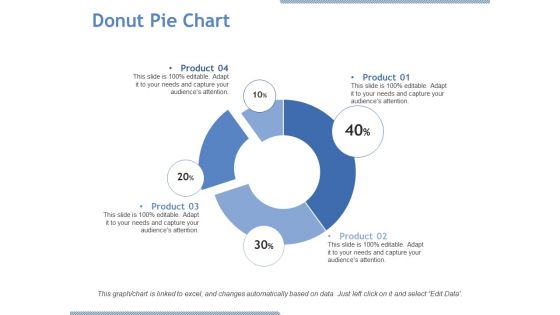
Donut Pie Chart Ppt PowerPoint Presentation Visual Aids Model
This is a donut pie chart ppt powerpoint presentation visual aids model. This is a four stage process. The stages in this process are product, percentage, finance, donut, business.
Column Chart Ppt PowerPoint Presentation Infographic Template Icon
This is a column chart ppt powerpoint presentation infographic template icon. This is a two stage process. The stages in this process are business, marketing, sales in percentage, financial year, graph.
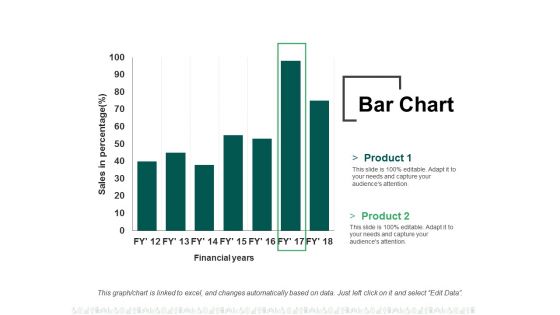
Bar Chart Ppt PowerPoint Presentation Summary File Formats
This is a bar chart ppt powerpoint presentation summary file formats. This is a two stage process. The stages in this process are business, finance, financial years, sales in percentage, graph.

Column Chart Ppt PowerPoint Presentation Layouts Graphic Images
This is a column chart ppt powerpoint presentation layouts graphic images. This is a two stage process. The stages in this process are business, finance, years, graph, expenditure in, marketing.
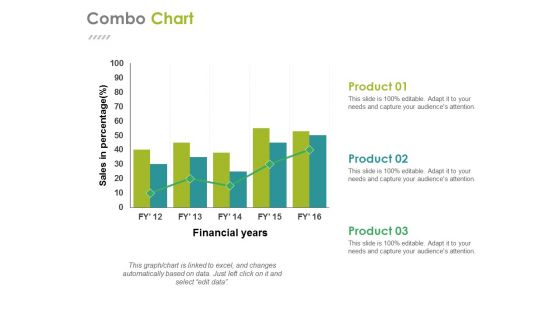
Combo Chart Ppt PowerPoint Presentation Gallery Design Ideas
This is a combo chart ppt powerpoint presentation gallery design ideas. This is a three stage process. The stages in this process are business, financial years, sales in percentage, finance, graph.
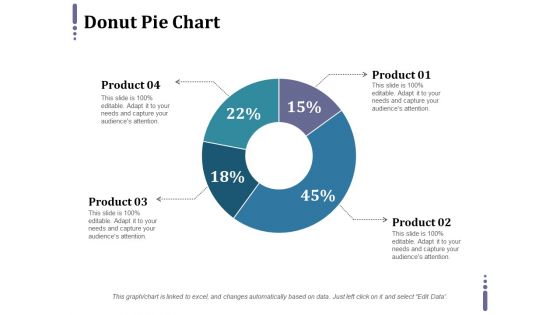
Donut Pie Chart Ppt PowerPoint Presentation Pictures Layout Ideas
This is a donut pie chart ppt powerpoint presentation pictures layout ideas. This is a four stage process. The stages in this process are percentage, finance, donut, business, product.
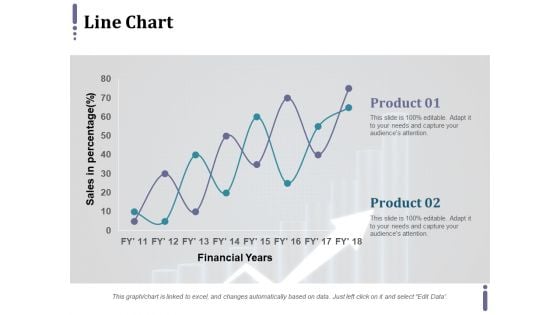
Line Chart Ppt PowerPoint Presentation Infographic Template Master Slide
This is a line chart ppt powerpoint presentation infographic template master slide. This is a two stage process. The stages in this process are product, financial years, sales in percentage.
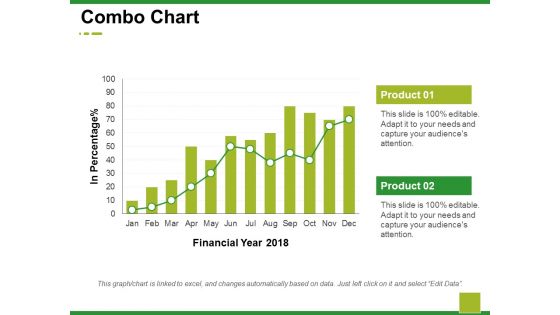
Combo Chart Ppt PowerPoint Presentation Summary Background Images
This is a combo chart ppt powerpoint presentation summary background images. This is a two stage process. The stages in this process are business, marketing, financial year, in percentage, graph.
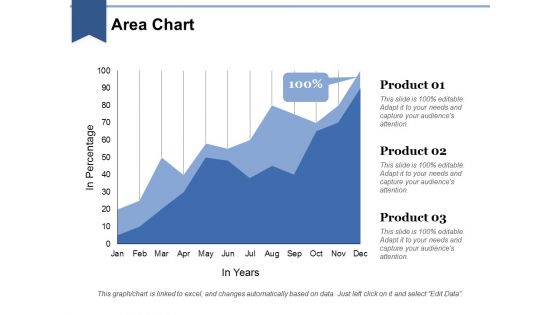
Area Chart Ppt PowerPoint Presentation Layouts Graphic Images
This is a area chart ppt powerpoint presentation layouts graphic images. This is a three stage process. The stages in this process are business, in years, marketing, in percentage, finance, graph.

Regression Line Chart Ppt PowerPoint Presentation Visual Aids Summary
This is a regression line chart ppt powerpoint presentation visual aids summary. This is a two stage process. The stages in this process are linear periodization, linear growth, linear progression.
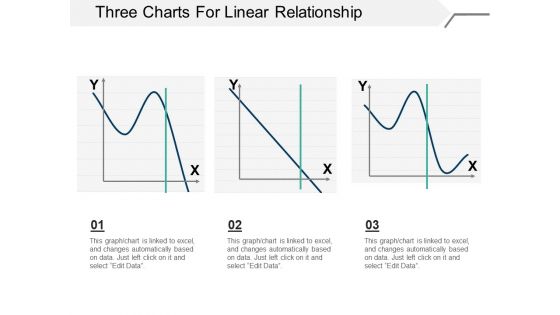
Three Charts For Linear Relationship Ppt PowerPoint Presentation Model Example
This is a three charts for linear relationship ppt powerpoint presentation model example. This is a three stage process. The stages in this process are linear periodization, linear growth, linear progression.
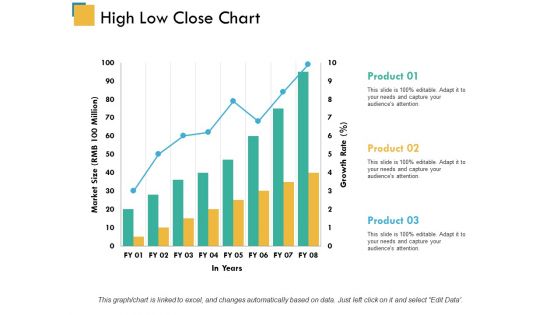
High Low Close Chart Ppt PowerPoint Presentation Model Inspiration
This is a high low close chart ppt powerpoint presentation model inspiration. This is a three stage process. The stages in this process are product, market size, in years.
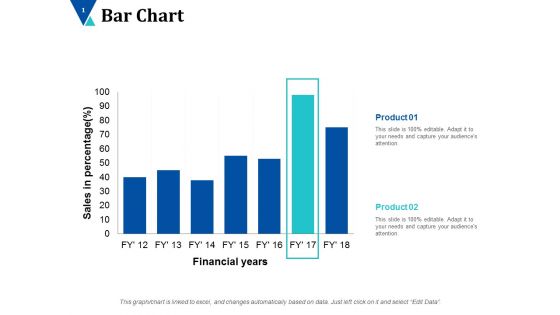
Bar Chart Finance Ppt PowerPoint Presentation Infographics Background Images
This is a bar chart finance ppt powerpoint presentation infographics background images. This is a seven stages process. The stages in this process are alpha testing, beta testing, full scale show.
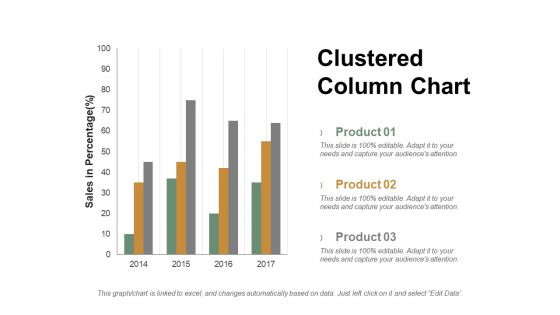
Clustered Column Chart Ppt PowerPoint Presentation Professional Ideas
This is a clustered column chart ppt powerpoint presentation professional ideas. This is a three stage process. The stages in this process are product, sales in percentage, column, years.
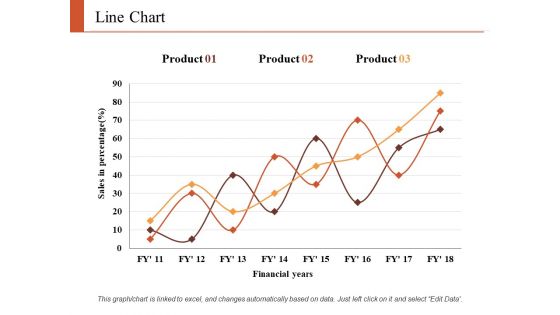
Line Chart Finance Ppt PowerPoint Presentation Infographic Template Graphics Tutorials
This is a line chart finance ppt powerpoint presentation infographic template graphics tutorials. This is a three stage process. The stages in this process are finance, marketing, analysis, business, investment.
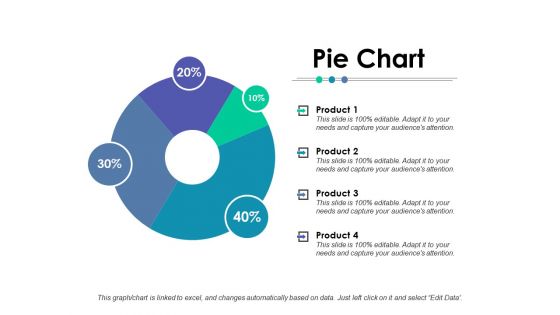
Pie Chart Finance Ppt PowerPoint Presentation Styles File Formats
This is a pie chart finance ppt powerpoint presentation styles file formats. This is a four stage process. The stages in this process are finance, analysis, business, investment, marketing.
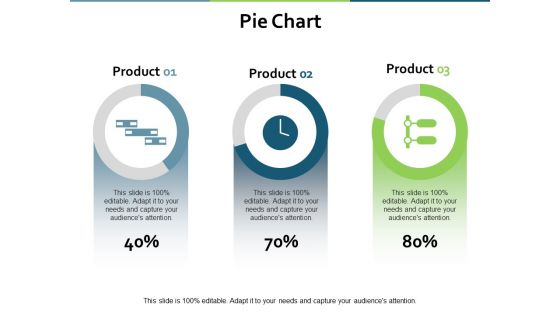
Pie Chart Marketing Finance Ppt PowerPoint Presentation Gallery Good
This is a pie chart marketing finance ppt powerpoint presentation gallery good. This is a three stage process. The stages in this process are finance, analysis, business, investment, marketing.
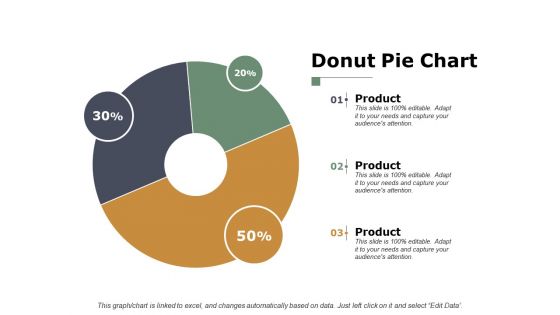
Donut Pie Chart Finance Ppt PowerPoint Presentation Inspiration Graphics
This is a donut pie chart finance ppt powerpoint presentation inspiration graphics. This is a three stage process. The stages in this process are finance, analysis, business, investment, marketing.
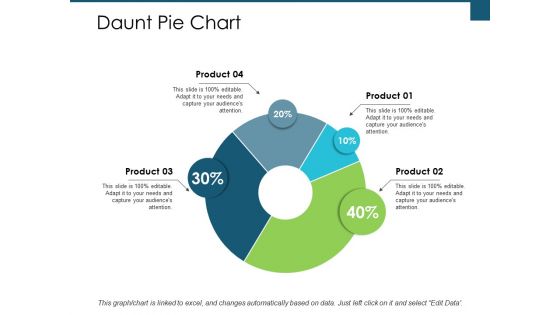
Daunt Pie Chart Investment Ppt PowerPoint Presentation Infographic Template Aids
This is a daunt pie chart investment ppt powerpoint presentation infographic template aids. This is a four stage process. The stages in this process are finance, analysis, business, investment, marketing.
Clustered Bar Chart Marketing Ppt PowerPoint Presentation Layouts Icon
This is a clustered bar chart marketing ppt powerpoint presentation layouts icon. This is a four stage process. The stages in this process are finance, marketing, analysis, business, investment.
Donut Pie Chart Marketing Ppt PowerPoint Presentation Infographic Template Icon
This is a donut pie chart marketing ppt powerpoint presentation infographic template icon. This is a five stage process. The stages in this process are finance, marketing, analysis, business, investment.
Bar Chart Finance Marketing Ppt PowerPoint Presentation Icon Display
This is a bar chart finance marketing ppt powerpoint presentation icon display. This is a three stage process. The stages in this process are finance, analysis, business, investment, marketing.
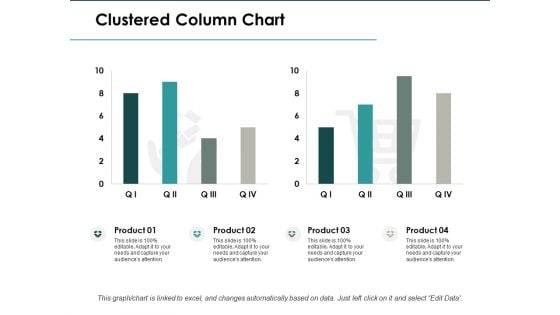
Clustered Column Chart Investment Ppt PowerPoint Presentation Infographic Template Clipart
This is a clustered column chart investment ppt powerpoint presentation infographic template clipart. This is a four stage process. The stages in this process are finance, analysis, business, investment, marketing.
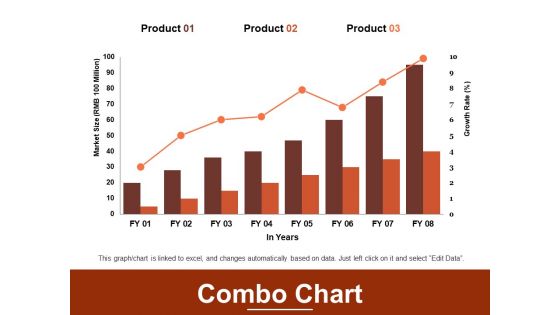
Combo Chart Finance Marketing Ppt PowerPoint Presentation File Guidelines
This is a combo chart finance marketing ppt powerpoint presentation file guidelines. This is a three stage process. The stages in this process are finance, analysis, business, investment, marketing.
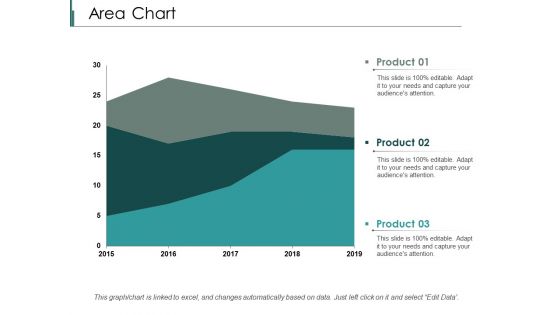
Area Chart Finance Ppt PowerPoint Presentation Styles Designs Download
This is a area chart finance ppt powerpoint presentation styles designs download. This is a three stage process. The stages in this process are finance, analysis, business, investment, marketing.
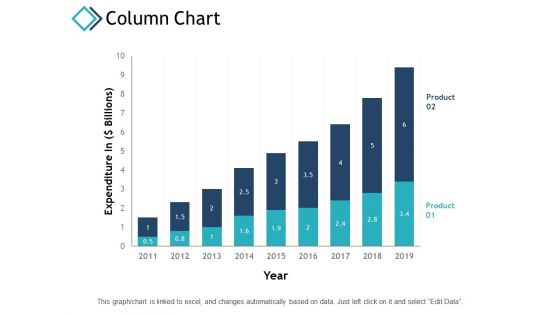
Column Chart Finance Investment Ppt PowerPoint Presentation Inspiration Template
This is a column chart finance investment ppt powerpoint presentation inspiration template. This is a two stage process. The stages in this process are finance, analysis, business, investment, marketing.
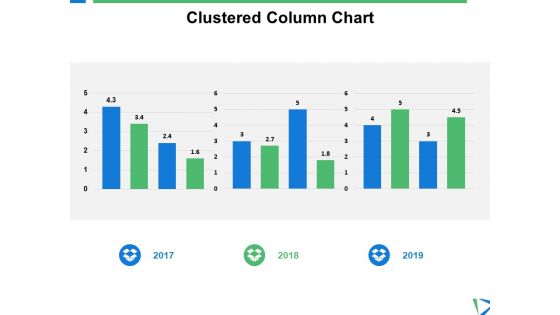
Clustered Column Chart Finance Ppt PowerPoint Presentation Gallery Styles
This is a clustered column chart finance ppt powerpoint presentation gallery styles. This is a three stage process. The stages in this process are finance, analysis, business, investment, marketing.
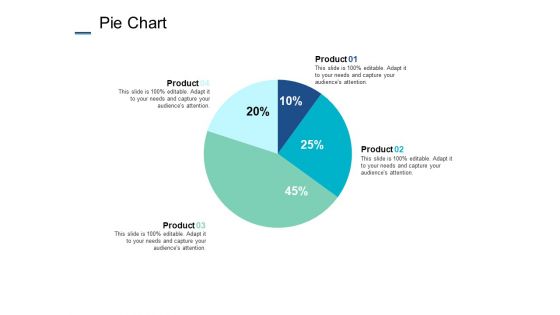
Pie Chart Finance Marketing Ppt PowerPoint Presentation Styles Outfit
This is a pie chart finance marketing ppt powerpoint presentation styles outfit. This is a four stage process. The stages in this process are finance, analysis, business, investment, marketing.
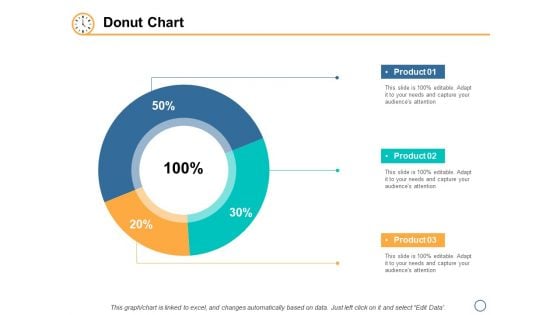
Pie Chart Marketing Finance Ppt PowerPoint Presentation File Guidelines
This is a pie chart marketing finance ppt powerpoint presentation file guidelines. This is a three stage process. The stages in this process are finance, analysis, business, investment, marketing.
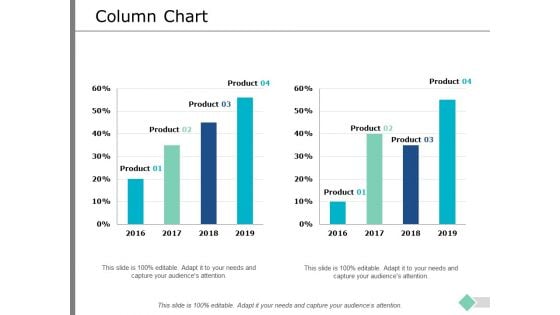
Column Chart Marketing Finance Ppt PowerPoint Presentation Infographic Template Rules
This is a column chart marketing finance ppt powerpoint presentation infographic template rules. This is a two stage process. The stages in this process are finance, analysis, business, investment, marketing.
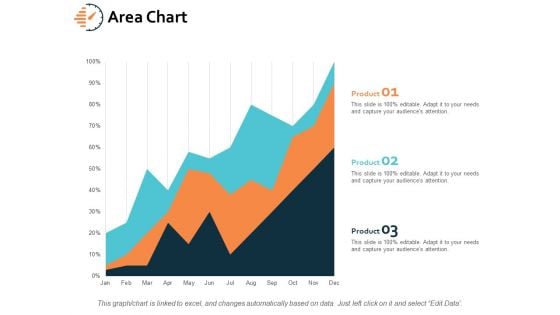
Area Chart Finance Marketing Ppt PowerPoint Presentation Gallery Graphics Design
This is a area chart finance marketing ppt powerpoint presentation gallery graphics design. This is a three stage process. The stages in this process are finance, analysis, business, investment, marketing.
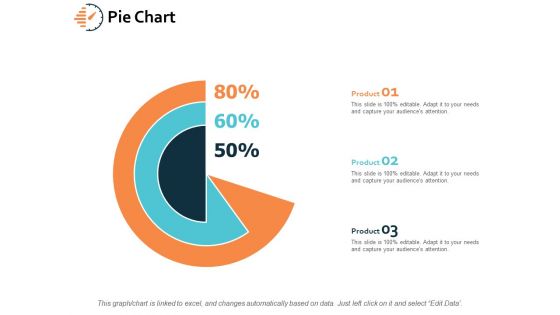
Pie Chart Investment Finance Ppt PowerPoint Presentation File Influencers
This is a pie chart investment finance ppt powerpoint presentation file influencers. This is a three stage process. The stages in this process are finance, analysis, business, investment, marketing.
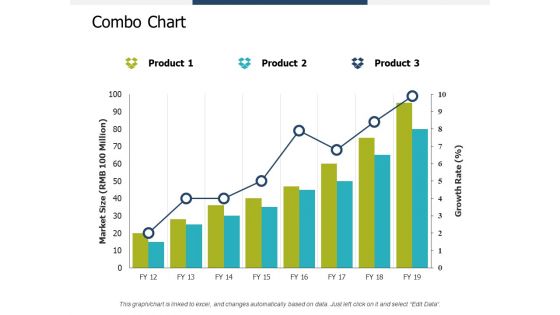
Combo Chart Investment Ppt PowerPoint Presentation Summary Infographic Template
This is a combo chart investment ppt powerpoint presentation summary infographic template. This is a three stage process. The stages in this process are finance, analysis, business, investment, marketing.
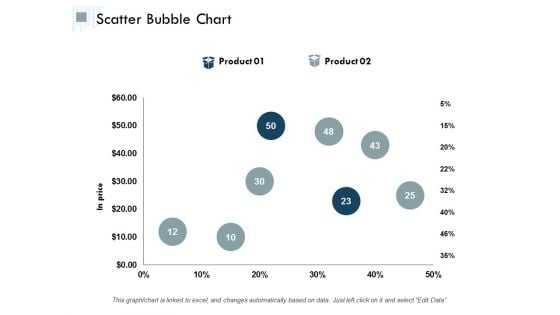
Scatter Bubble Chart Ppt PowerPoint Presentation Infographic Template Graphics Design
This is a scatter bubble chart ppt powerpoint presentation infographic template graphics design. This is a two stage process. The stages in this process are finance, analysis, business, investment, marketing.
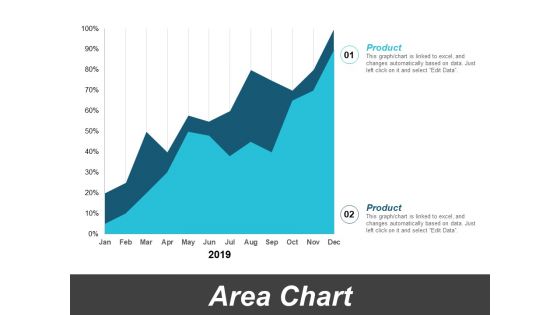
Area Chart Marketing Finance Ppt PowerPoint Presentation Ideas Elements
This is a area chart marketing finance ppt powerpoint presentation ideas elements. This is a two stage process. The stages in this process are finance, analysis, business, investment, marketing.
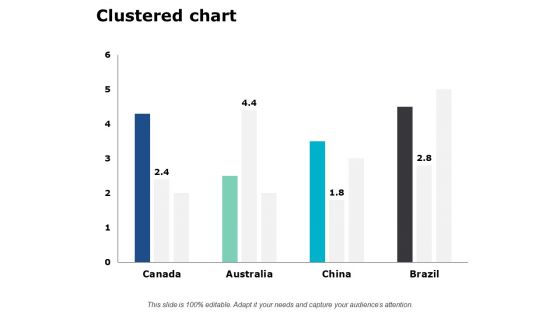
Clustered Chart Finance Marketing Ppt PowerPoint Presentation Layouts Outfit
This is a clustered chart finance marketing ppt powerpoint presentation layouts outfit. This is a four stage process. The stages in this process are finance, analysis, business, investment, marketing.
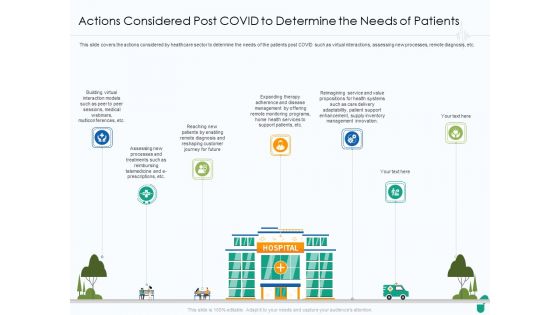
Actions Considered Post COVID To Determine The Needs Of Patients Ppt Slides Brochure PDF
This slide covers the actions considered by healthcare sector to determine the needs of the patients post COVID such as virtual interactions, assessing new processes, remote diagnosis, etc. Deliver and pitch your topic in the best possible manner with this actions considered post covid to determine the needs of patients ppt slides brochure pdf. Use them to share invaluable insights on customer journey, support patients, disease management, remote monitoring programs, supply inventory management innovation, reimagining service, health systems and impress your audience. This template can be altered and modified as per your expectations. So, grab it now.
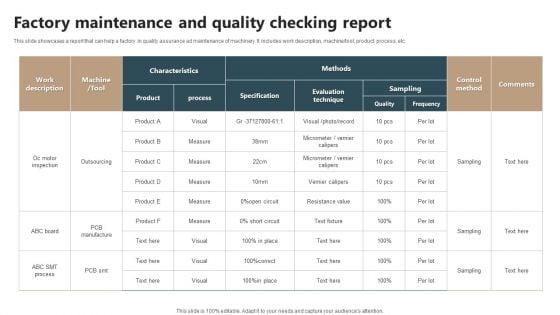
Factory Maintenance And Quality Checking Report Mockup PDF
This slide showcases a report on pharmaceutical products to check quality and quantity as per the set standards. It includes metrics such as packaging, identification, traceability, etc. Showcasing this set of slides titled Factory Maintenance And Quality Checking Report Mockup PDF. The topics addressed in these templates are Manufacturer, Quality Checking Report, Pharma Products. All the content presented in this PPT design is completely editable. Download it and make adjustments in color, background, font etc. as per your unique business setting.
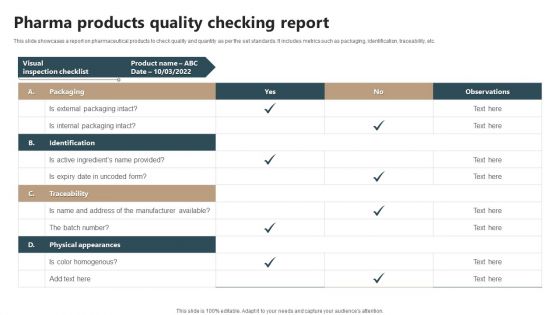
Pharma Products Quality Checking Report Summary PDF
This slide showcases a report on pharmaceutical products to check quality and quantity as per the set standards. It includes metrics such as packaging, identification, traceability, etc. Showcasing this set of slides titled Pharma Products Quality Checking Report Summary PDF. The topics addressed in these templates are Manufacturer, Physical Appearances, Products Quality Checking Report. All the content presented in this PPT design is completely editable. Download it and make adjustments in color, background, font etc. as per your unique business setting.
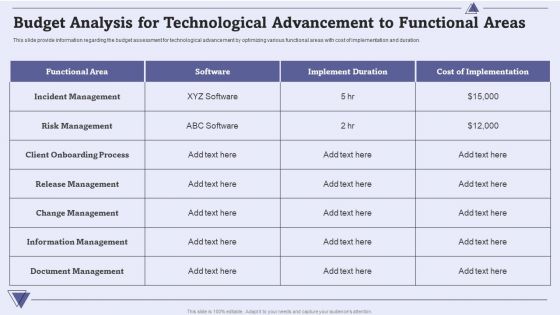
CIO For IT Cost Optimization Techniques Budget Analysis For Technological Advancement To Functional Areas Summary PDF
This slide provide information regarding the budget assessment for technological advancement by optimizing various functional areas with cost of implementation and duration. Deliver an awe inspiring pitch with this creative CIO For IT Cost Optimization Techniques Budget Analysis For Technological Advancement To Functional Areas Summary PDF bundle. Topics like Change Management, Information Management, Document Management can be discussed with this completely editable template. It is available for immediate download depending on the needs and requirements of the user.

Personnel Training Playbook Communication Skills Training For Executives Employees Elements PDF
This slide provides information regarding communication skills training for executives, employees and managers such as writing constructive feedbacks, storytelling and relationship building. Deliver and pitch your topic in the best possible manner with this Personnel Training Playbook Communication Skills Training For Executives Employees Elements PDF. Use them to share invaluable insights on Writing Constructive Feedback, Storytelling Relationship Building, Participants Learning Benefit and impress your audience. This template can be altered and modified as per your expectations. So, grab it now.
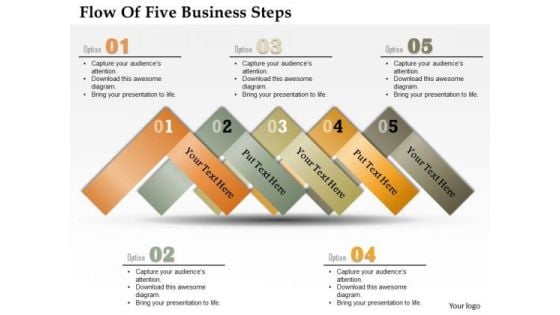
Consulting Slides Flow Of Five Business Steps Business Presentation
This diagram can be used in analyzing, designing, documenting or managing a process or program. Arrows represents flow of Information. It helps help the viewer to understand a process.
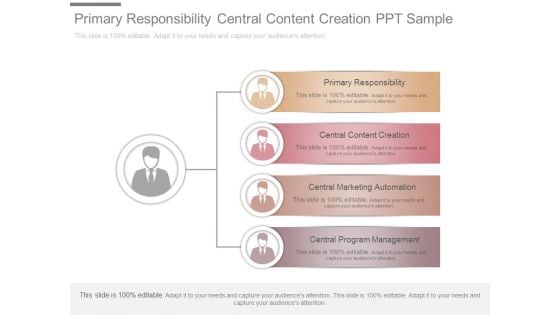
Primary Responsibility Central Content Creation Ppt Sample
This is a primary responsibility central content creation ppt sample. This is a four stage process. The stages in this process are primary responsibility, central content creation, central marketing automation, central program management.

Components Of Enterprise Architecture Diagram Presentation Diagrams
This is a components of enterprise architecture diagram presentation diagrams. This is a four stage process. The stages in this process are risk and security, program management, technology driven, business driven.
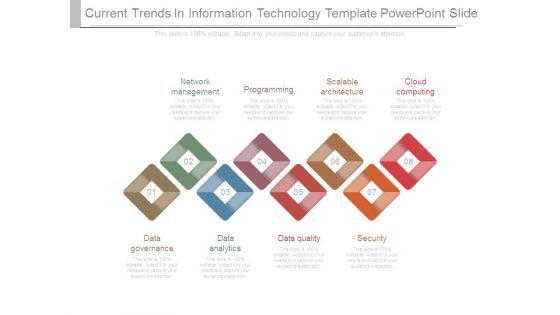
Current Trends In Information Technology Template Powerpoint Slide
This is a current trends in information technology template powerpoint slide. This is a eight stage process. The stages in this process are network management, programming, scalable architecture, cloud computing, data governance, data analytics, data quality, security.

Team Concept Business PowerPoint Templates And PowerPoint Themes 1112
We present our Team Concept Business PowerPoint Templates And PowerPoint Themes 1112.Use our Americana PowerPoint Templates because,And keep you group steady in the top bracket. Use our Business PowerPoint Templates because, Pinpoint the critical paths and areasin your process and set the timelines for their completion. Use our Communication PowerPoint Templates because,Adorn them with your ideas and thoughts. Use our Teamwork PowerPoint Templates because,represent the proress in our lives. Use our Globe PowerPoint Templates because, Clarity of thought has been the key to your growth.Use these PowerPoint slides for presentations relating to business concept design Americana Business Teamwork Communication Globe. The prominent colors used in the PowerPoint template are Green, White, Black Create a blueprint for your factory. Arrive at an apt design with our Team Concept Business PowerPoint Templates And PowerPoint Themes 1112.
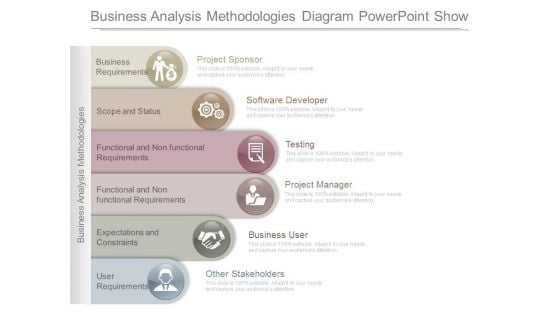
Business Analysis Methodologies Diagram Powerpoint Show
This is a business analysis methodologies diagram powerpoint show. This is a six stage process. The stages in this process are business requirements, scope and status, functional and non functional requirements, functional and non functional requirements, expectations and constraints, user requirements, project sponsor, software developer, testing, project manager, business user, other stakeholders, business analysis methodologies.

Rational Perspectives On Decision Making Chart Ppt Slides
This is a rational perspectives on decision making chart ppt slides. This is a six stage process. The stages in this process are recognition of decision requirement, diagnosis and analysis of causes, development of alternatives, selection of desired alternative, implementation of chosen alternative, evaluation and feedback, decision making process.
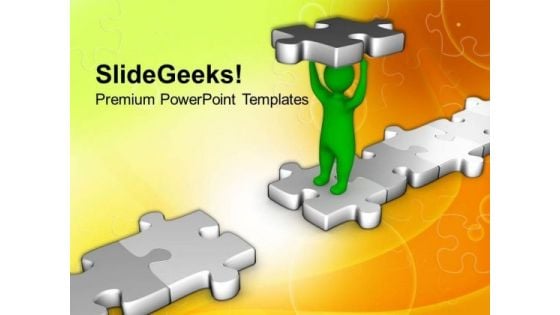
Fill The Gap And Make Bridge PowerPoint Templates Ppt Backgrounds For Slides 0513
Be your own editor with our Fill The Gap And Make Bridge PowerPoint Templates PPT Backgrounds For Slides. Align your thoughts as per your wishes. Land the idea with our Shapes PowerPoint Templates. Help it grow with your thoughts. Cover the compass with our success PowerPoint Templates. Your ideas will be acceptable to all. Our Fill The Gap And Make Bridge PowerPoint Templates Ppt Backgrounds For Slides 0513 are fairly broadbased. They give you ample scope to address your mind.
Three Seps Of Enterprise Network Security With Icons Ppt PowerPoint Presentation Icon Slide Portrait PDF
Presenting three seps of enterprise network security with icons ppt powerpoint presentation icon slide portrait pdf to dispense important information. This template comprises three stages. It also presents valuable insights into the topics including discover enforce harden, scope contain remediate, detect block defend. This is a completely customizable PowerPoint theme that can be put to use immediately. So, download it and address the topic impactfully.
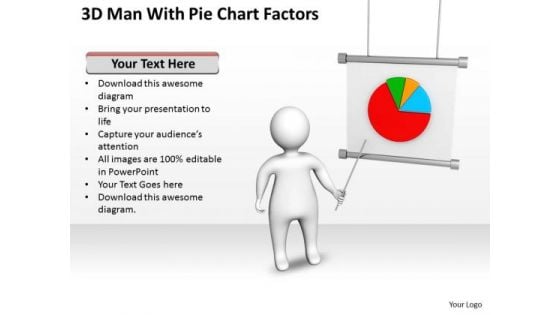
Business Charts Examples 3d Man With Pie Factors PowerPoint Slides
We present our business charts examples 3d man with pie factors PowerPoint Slides.Download and present our Finance PowerPoint Templates because Our PowerPoint Templates and Slides will definately Enhance the stature of your presentation. Adorn the beauty of your thoughts with their colourful backgrounds. Use our Arrows PowerPoint Templates because Our PowerPoint Templates and Slides are specially created by a professional team with vast experience. They diligently strive to come up with the right vehicle for your brilliant Ideas. Use our Business PowerPoint Templates because It can be used to Set your controls for the heart of the sun. Our PowerPoint Templates and Slides will be the propellant to get you there. Download our Marketing PowerPoint Templates because our PowerPoint Templates and Slides will give your ideas the shape. Download our Success PowerPoint Templates because Our PowerPoint Templates and Slides are created by a hardworking bunch of busybees. Always flitting around with solutions gauranteed to please.Use these PowerPoint slides for presentations relating to 3d, Arrow, Business, Businessman, Character, Chart, Concept, Corporate, Data, Development, Diagram, Display, Figure, Finance, Financial, Flip-Chart, Flipchart, Graph, Graphic, Green, Growth, Guy, Human, Icon, Idea, Illustration, Information, Investment, Market, Marketing, Men, Office, Part, People, Person, Pie, Presentation, Professional, Progress, Red, Reflection, Report, Shape, Shiny, Sign, Slice, Statistic, Success. The prominent colors used in the PowerPoint template are Red, Blue, Green. The feedback we get is that our business charts examples 3d man with pie factors PowerPoint Slides are designed by a team of presentation professionals. Customers tell us our Business PowerPoint templates and PPT Slides will make the presenter look like a pro even if they are not computer savvy. The feedback we get is that our business charts examples 3d man with pie factors PowerPoint Slides are topically designed to provide an attractive backdrop to any subject. Professionals tell us our Businessman PowerPoint templates and PPT Slides are aesthetically designed to attract attention. We guarantee that they will grab all the eyeballs you need. Presenters tell us our business charts examples 3d man with pie factors PowerPoint Slides will help you be quick off the draw. Just enter your specific text and see your points hit home. You can be sure our Character PowerPoint templates and PPT Slides have awesome images to get your point across. There is nothing fake about your commitment. Demonstrate authenticity with our Business Charts Examples 3d Man With Pie Factors PowerPoint Slides.
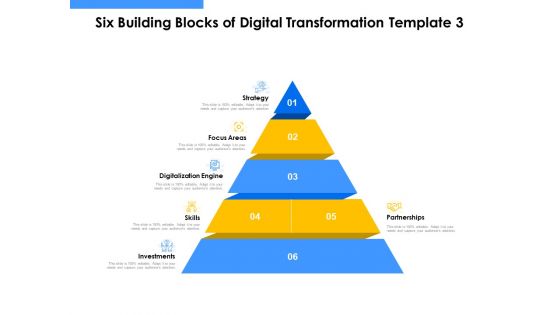
Employee Competency Matrix Six Building Blocks Of Digital Transformation Skills Ppt Professional Guidelines PDF
Presenting employee competency matrix six building blocks of digital transformation skills ppt professional guidelines pdf to provide visual cues and insights. Share and navigate important information on six stages that need your due attention. This template can be used to pitch topics like strategy and innovation, customer decision journey, process automation, data and analytics, technology, organization. In addition, this PPT design contains high-resolution images, graphics, etc, that are easily editable and available for immediate download.
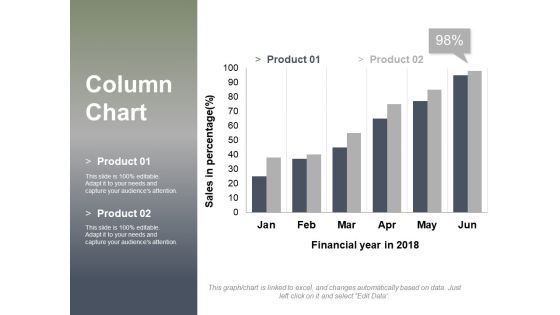
Column Chart Ppt PowerPoint Presentation Layouts Design Inspiration
This is a column chart ppt powerpoint presentation layouts design inspiration. This is a two stage process. The stages in this process are sales in percentage, financial year in, graph, business, finance, marketing.


 Continue with Email

 Home
Home


